Today we’ve launched the 1.5 release of Backyards (now Cisco Service Mesh Manager), Banzai Cloud’s production ready Istio distribution.
The vision of Backyards (now Cisco Service Mesh Manager) is to become a go-to solution for SREs and operation engineers to observe and control the health of their services and applications. The service mesh acts as the foundation layer that produces the most important network traffic metrics and traces in a unified way. The previous release was the first step towards this goal, and the new, 1.5 release keeps the same focus.
If you’re not familiar with Backyards (now Cisco Service Mesh Manager), learn about it on our website first, check out the documentation, or some of the related articles on our blog.
Check out Backyards in action on your own clusters!
Want to know more? Get in touch with us, or delve into the details of the latest release.
Or just take a look at some of the Istio features that Backyards automates and simplifies for you, and which we’ve already blogged about.
tl;dr 🔗︎
The 1.5 release of Backyards (now Cisco Service Mesh Manager) focuses on SRE observability tooling, and adds support for the newest Istio release:
- automatic application health monitoring
- a timeline view of service topology and metrics
- a full UI revamp for a faster and smoother experience
- support for Istio 1.8
What’s new 🔗︎
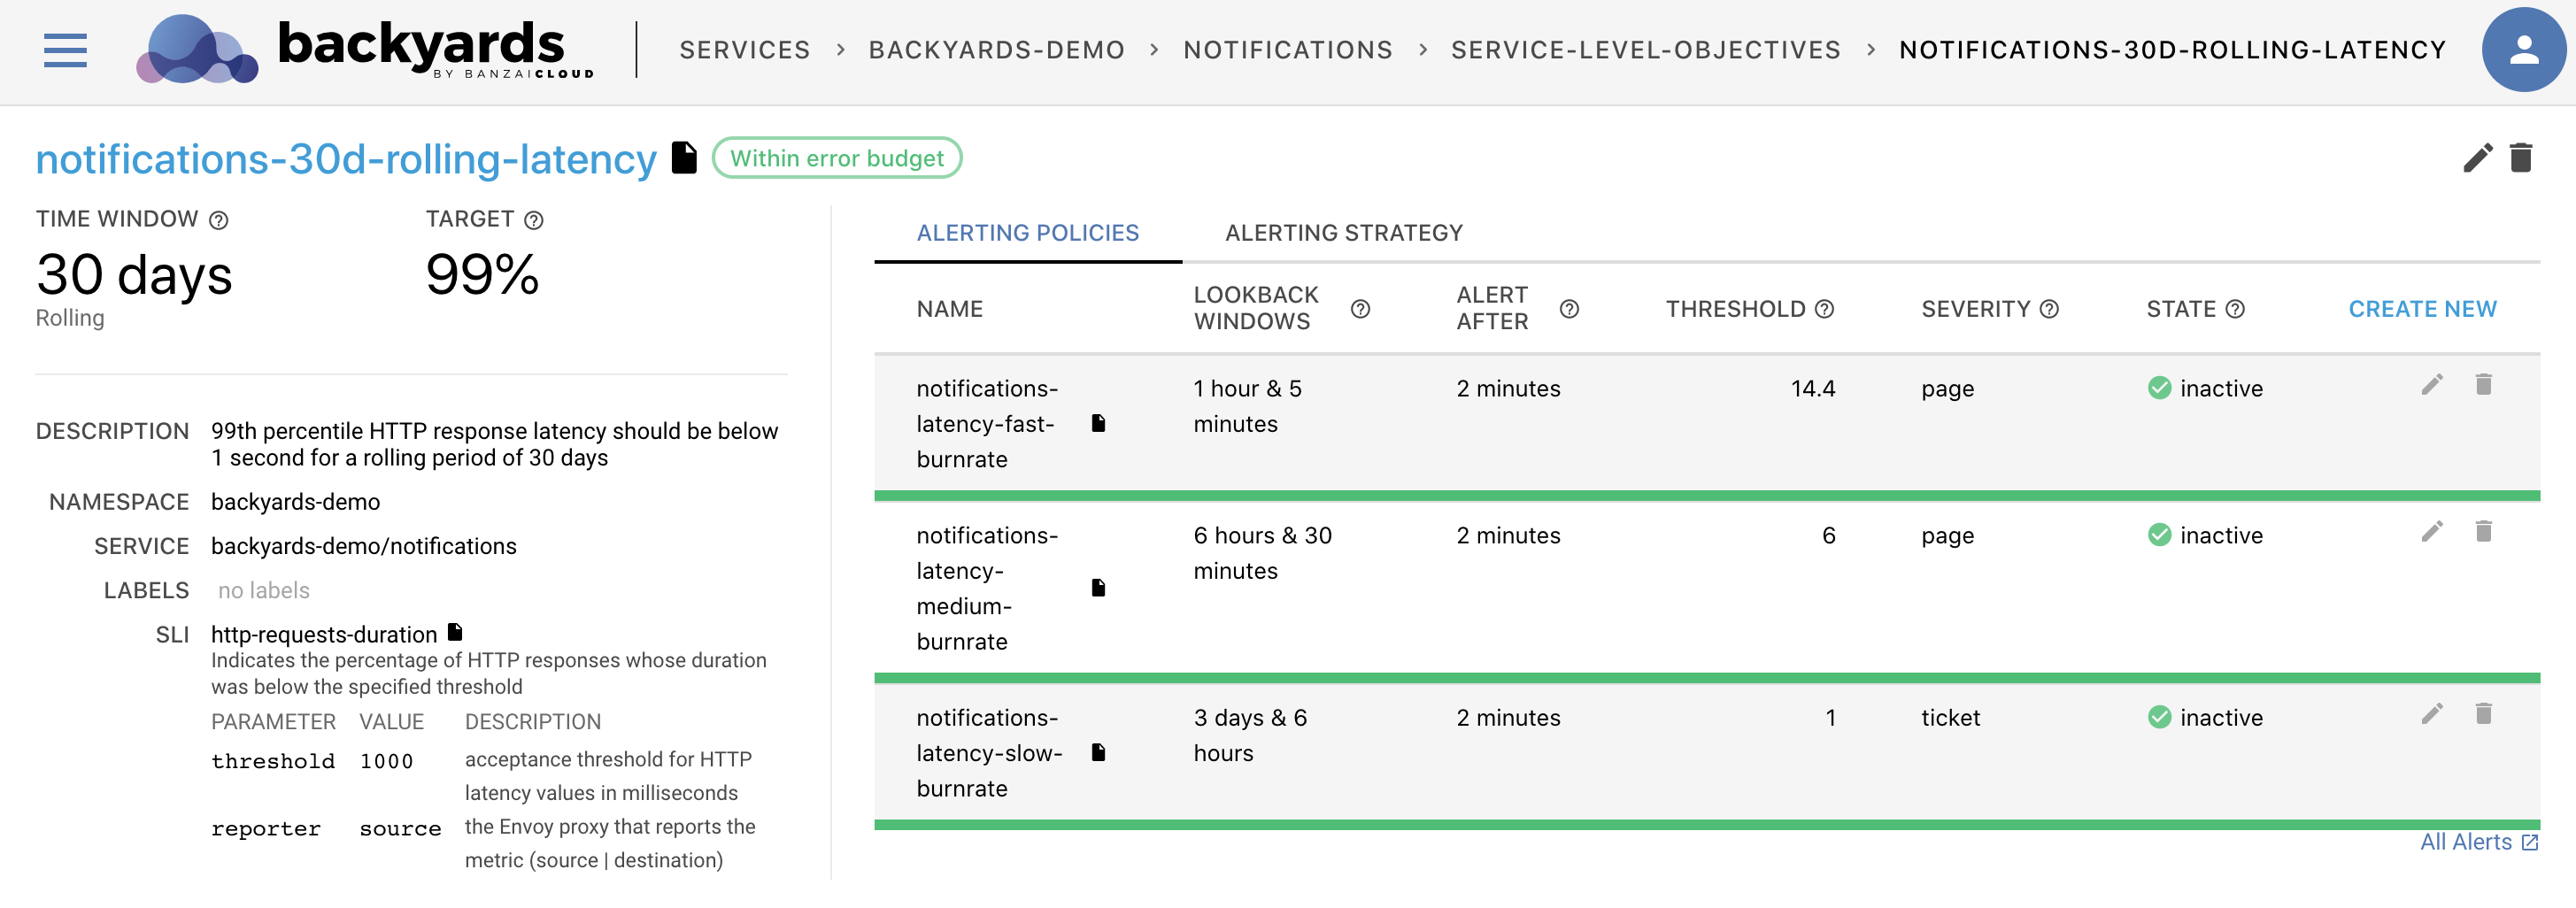
Up until the last few releases Backyards (now Cisco Service Mesh Manager) was an Istio distribution with a UI dashboard to control and observe the mesh. But the previous release started a shift to a higher-level vision, where the service mesh serves only as the foundation layer. That release introduced the management of Service Level Objectives (SLOs), and corresponding alerting capabilities.
The 1.5 release continues on this path, but introduces a different approach to control the health of your applications. While we still think that the SLO concept is great for services at scale, we understand that not everyone is Google, and you should keep things simple until it’s not absolutely necessary to change. And well, SLOs are all but simple. Not only because it’s hard to understand the concept, but also because they are only done right if your SLOs are continuously tuned and adjusted to your changing environment.
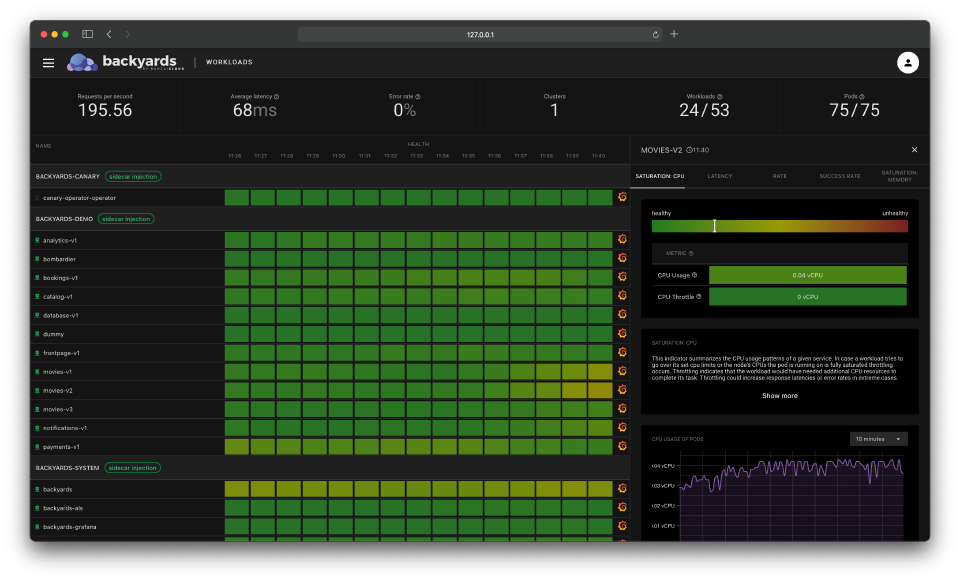
Our new approach is called automatic application health monitoring. This Backyards subsystem monitors all your services in the mesh, and - without a single line of manual configuration - computes a health score for each of them by taking into account a lot of different metrics. It doesn’t supersede SLOs, its goals are similar but a bit different. For complex applications with high loads having SLOs are still recommended, but our health scores can help track down production issues by highlighting possible root causes and providing information on best practices to minimize mean time to recovery.
This feature can be used starting from day 0 of the development phase of the application to find bottlenecks and possible issues. It can help diagnose issues when going to production, and provides root-cause analysis when it comes to incident fights during day 2 outages.
While the release is centered around this feature, we’ve added a few other things as well. Our new timeline view is one more tool to understand the behavior of your services by being able to easily check how your topology and metrics changed over time. We’ve also completely revamped our UI. It has a new look and feel, it’s faster and it’s using React behind the scenes instead of Angular as before. And as usual, we’re adding support for the latest Istio release, that’s now 1.8.
Now let’s see these things in detail.
Automatic application health monitoring 🔗︎
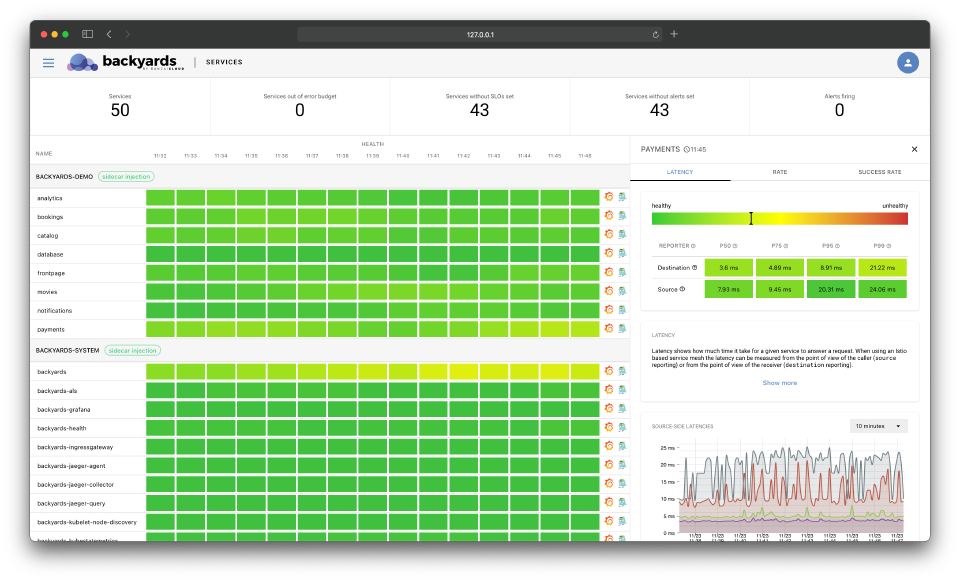
Automatic application health monitoring is our take on how to track service health in the simplest way possible. Backyards (now Cisco Service Mesh Manager) continuously monitors all services in the mesh and assigns a health score for each of them periodically. You can take a look at these health scores, and have an immediate understanding of which services behave incorrectly and for how long it is an ongoing issue.
The health scores are combined from various indicators and computed using outlier detection and other statistical algorithms. If a service has a bad score, you can further explore its indicators that build up the aggregated score to have a better picture about a failure.
We believe that everything can be a metric, so the indicators are all metric-based. We’re aggregating lots of indicators for all services, for example:
- Request rates from both source and destination reporting
- HTTP and gRPC success rates
- Latencies for p50, p95, p99
- OOMKills for a pod
- CPU and memory saturation
- CPU throttling
- Horizontal Pod Autoscaler metrics
Handling everything as a metric also enables us to make the health framework highly flexible. These default indicators are described in Kubernetes custom resources, and they can be extended by setting up additional CRs in the cluster. We’re planning to add other default indicators in the future, but you can also add your own custom metrics easily.
The health framework is based on the production ready Prometheus monitoring system and the enterprise grade Istio distribution, both provided by the core Backyards (now Cisco Service Mesh Manager) infrastructure.
If you want to dive deep into this feature, try out the evaluation version by following the steps in the documentation. You should also expect a blog post soon that describes these features in detail.
Timeline view of service topology and metrics 🔗︎
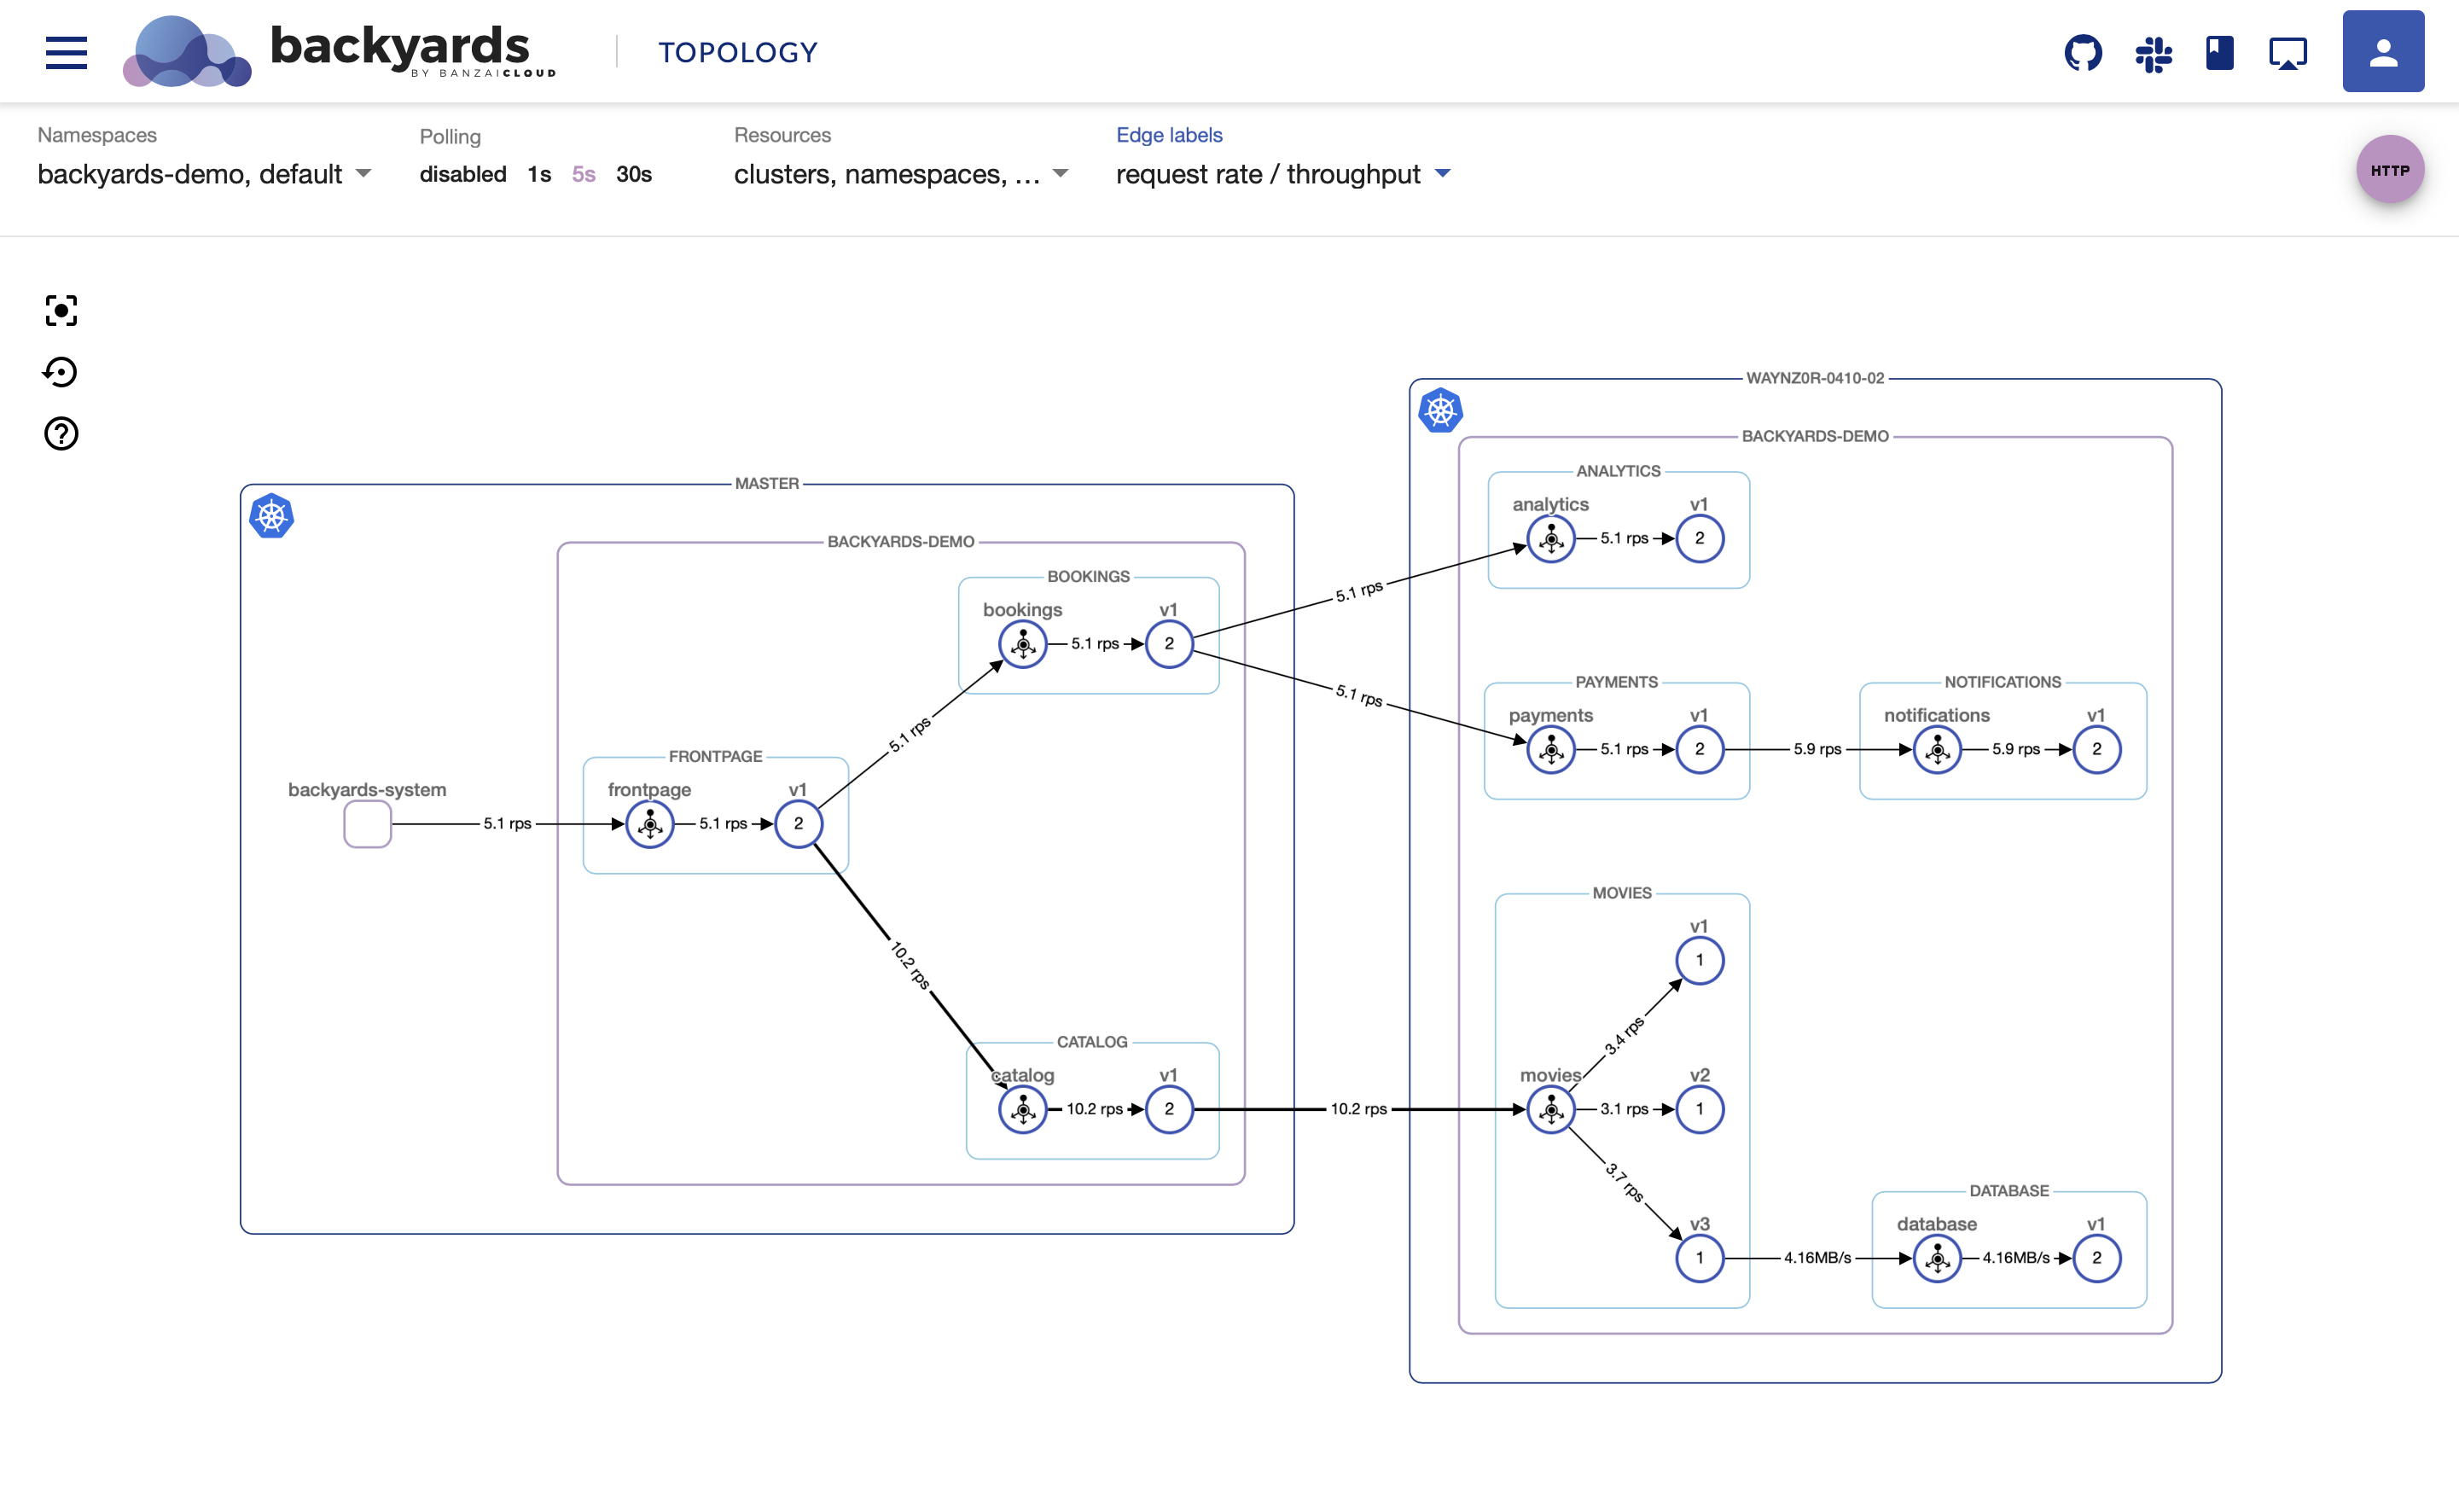
The first ever Backyards (now Cisco Service Mesh Manager) release already contained the topology view. Since then not much has changed, we’ve only had some small, almost invisible improvements. But we got multiple requests from customers that they want to see how their services and the corresponding metrics have changed over time.
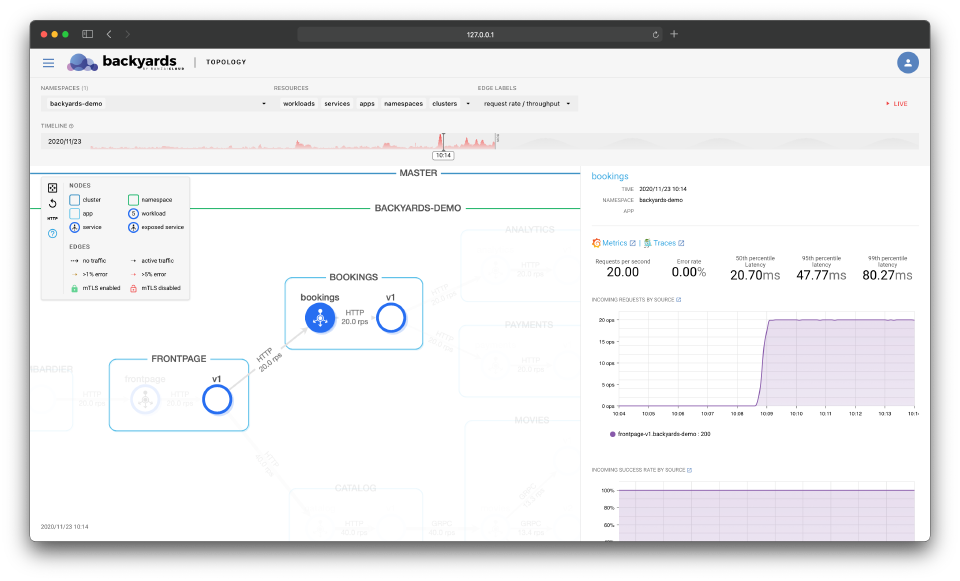
The timeline view allows you to select a specific point in time from the UI, and then move minutes back and forth to see how your most important metrics have changed. You can use it to check when and how things went awry for a specific service. For example when did your error rates go up, or how your latency values have changed over time when RPS values increased. It can be a good indicator to know where to look for errors in the logs, or to notice if something else has changed in the cluster that can be related to a specific failure.
The topology view is almost entirely based on metrics, and these metrics are coming from Prometheus. Prometheus is basically a time-series database, so it felt like a natural move to provide a timeline view based on these metrics. But our main topology view is enhanced with information from Kubernetes, that’s not directly available for a specific point in time. However, we are setting up kube-state-metrics as part of Backyards, that contains at least part of this information, and we’re using it as part of the timeline feature.
A full UI revamp 🔗︎
The Backyards (now Cisco Service Mesh Manager) dashboard got a new look and feel in the 1.5 release. We had two reasons for that: a technical one, and a UX one.
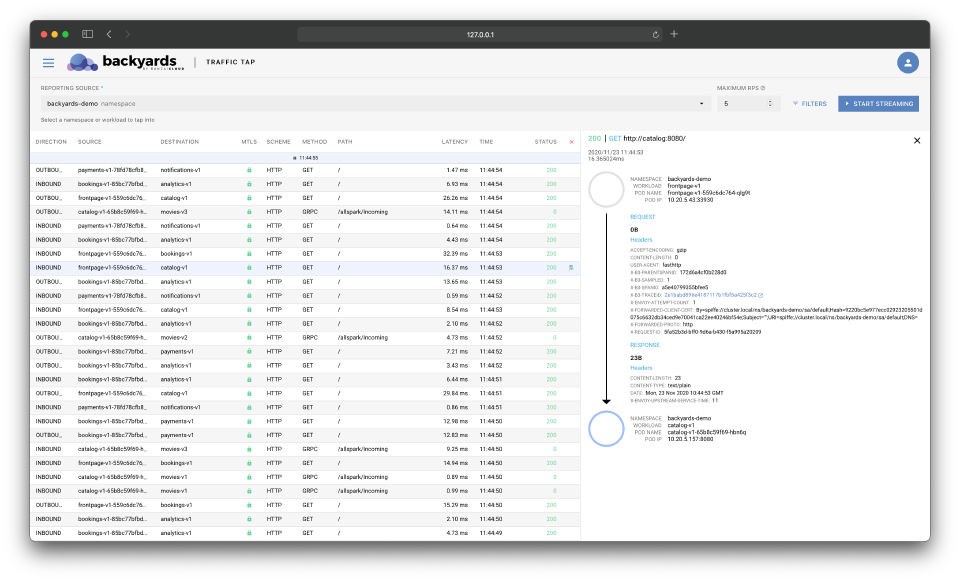
Out of these two reasons, the UX one is the more important. Some of the views on the dashboard, like the topology, or the embedded charts from Grafana often felt sluggish, and took a while to load especially on larger clusters. Now we’ve changed all the Grafana embeds to our own chart implementations, and completely revised how the topology view works to provide a smoother experience. We’ve also unified all of the forms on the UI, have a new breadcrumb navigation and did tons of other small enhancements around how things look like.
The technical reason is not something that’s obvious to our users at first sight. For historical reasons the UI was implemented partly in Angular, and partly in React. Now the Angular parts are completely gone and the full dashboard is in React. It allows us to move faster in the future, but there could be some rough edges because of the reimplementation of some features. If you can, give it a try, and let us know is you find a bug, or something’s not working as it should.
Istio 1.8 support 🔗︎
Istio 1.8 is again mostly about stability and operational experience, but introduces some interesting (experimental) features as well, especially around external VMs in the service mesh.
Backyards (now Cisco Service Mesh Manager) 1.5 comes with Istio 1.8 as the default installation option. The Backyards Istio distribution remains fully compatible with upstream Istio, while having a few additions on top, like FIPS compliance, custom resource managed ingress and egress gateways, or enhancements around multi-cluster topologies. Our distribution doesn’t add a new abstraction layer on top of well-known Istio concepts, so you can expect everything to work just like in an upstream Istio cluster.
Some of the higher impact changes in the new release are:
- workload-local DNS resolution to simplify VM integration and multi-cluster
- auto registration of external VMs by automatically creating
WorkloadEntrieswhen they join the mesh - gateway certificates are distributed from
istiod, rather than in the gateway pods directly - integration with external CAs through the Kubernetes CSR API
EnvoyFilterdescriptors are improved by allowing new keywords, likeREPLACE- Mixer is now completely removed
To learn more about the new Istio release, read the official announcement, or our own blog post about Istio 1.8.
Wrap-up 🔗︎
The 1.5 release is another step towards our vision for Backyards (now Cisco Service Mesh Manager) to become the go-to solution for SREs and operation teams to get meaningful observability information about services, to track service health, and to debug production issues, based on the solid foundation of the Istio service mesh.
Check out Backyards in action on your own clusters!
Want to know more? Get in touch with us, or delve into the details of the latest release.
Or just take a look at some of the Istio features that Backyards automates and simplifies for you, and which we’ve already blogged about.


