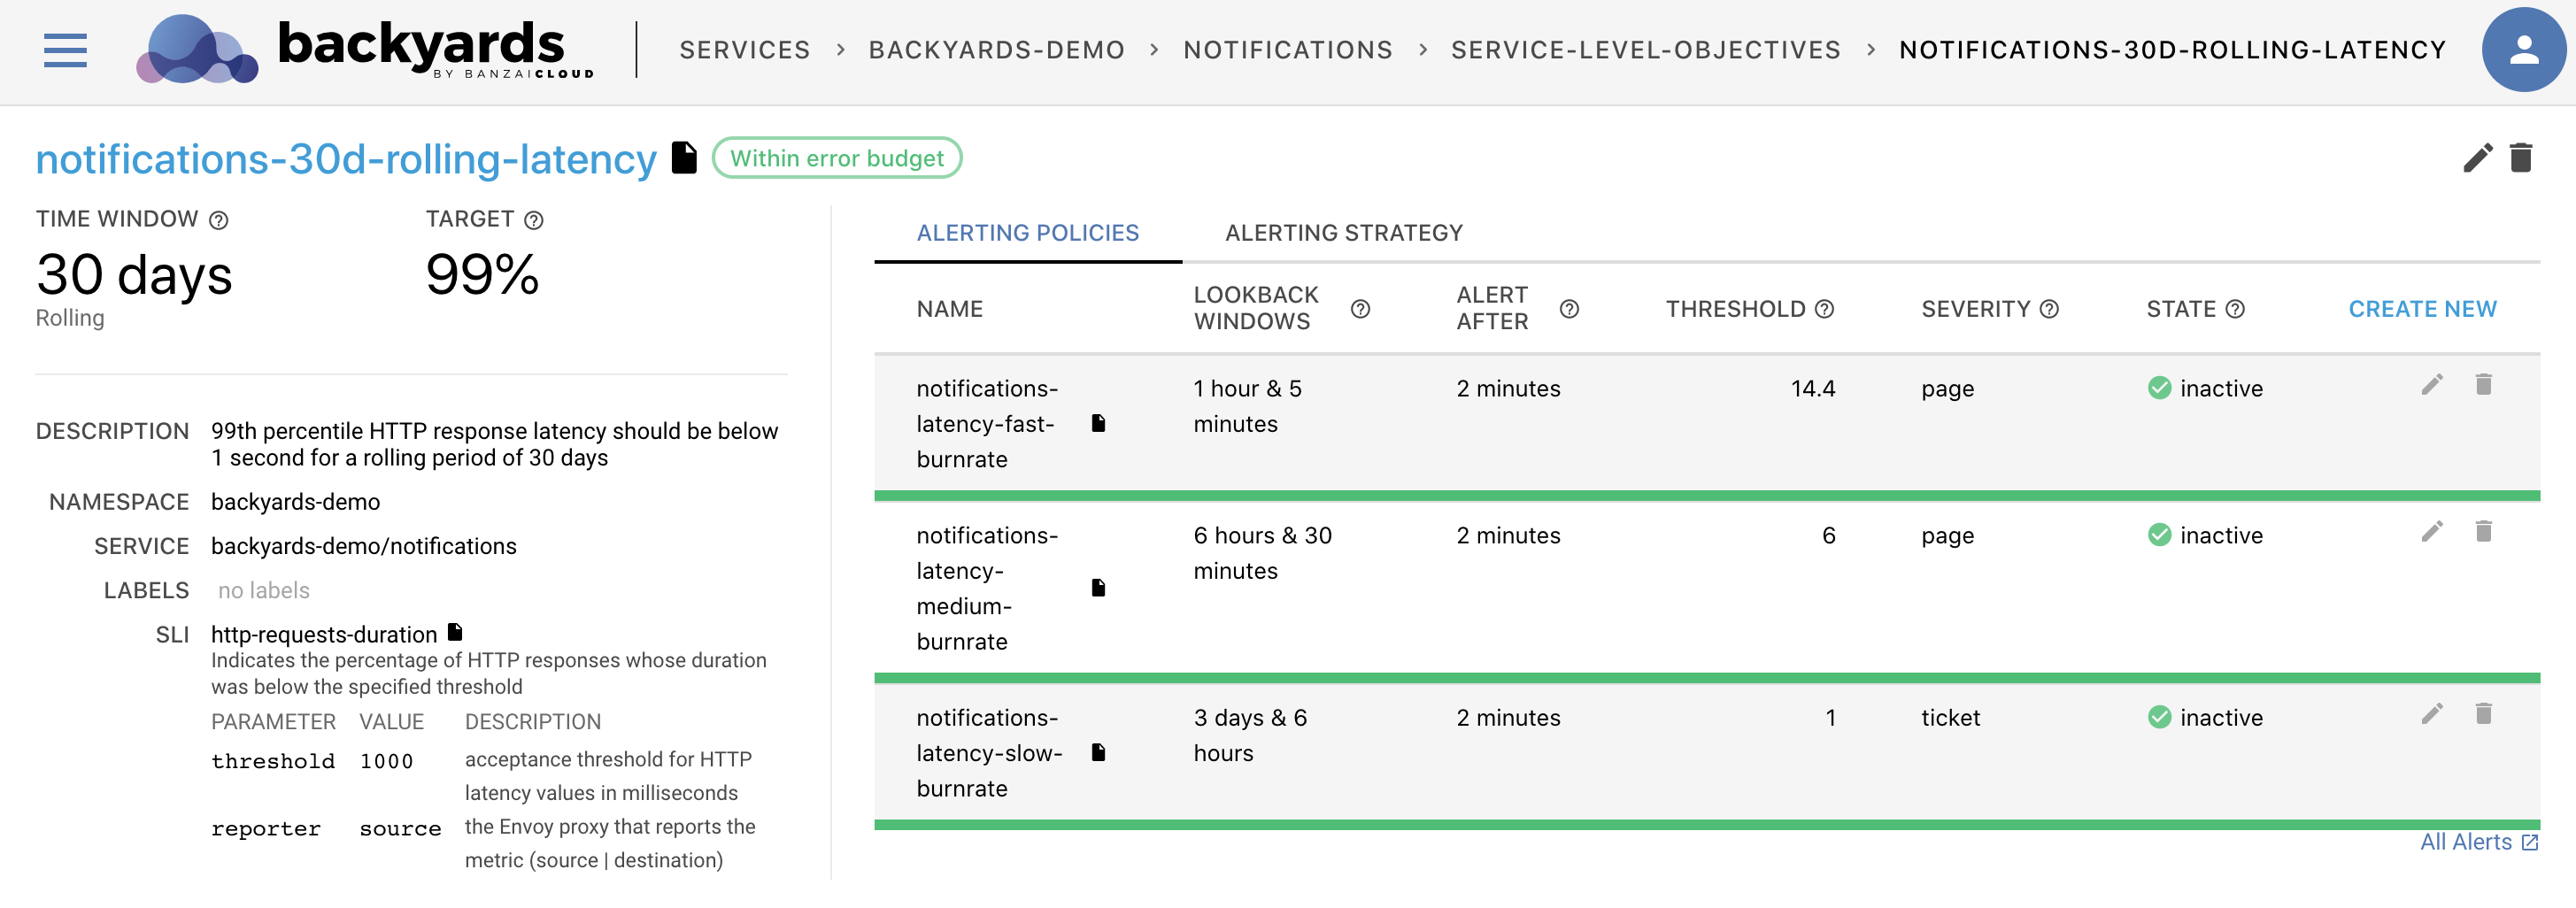
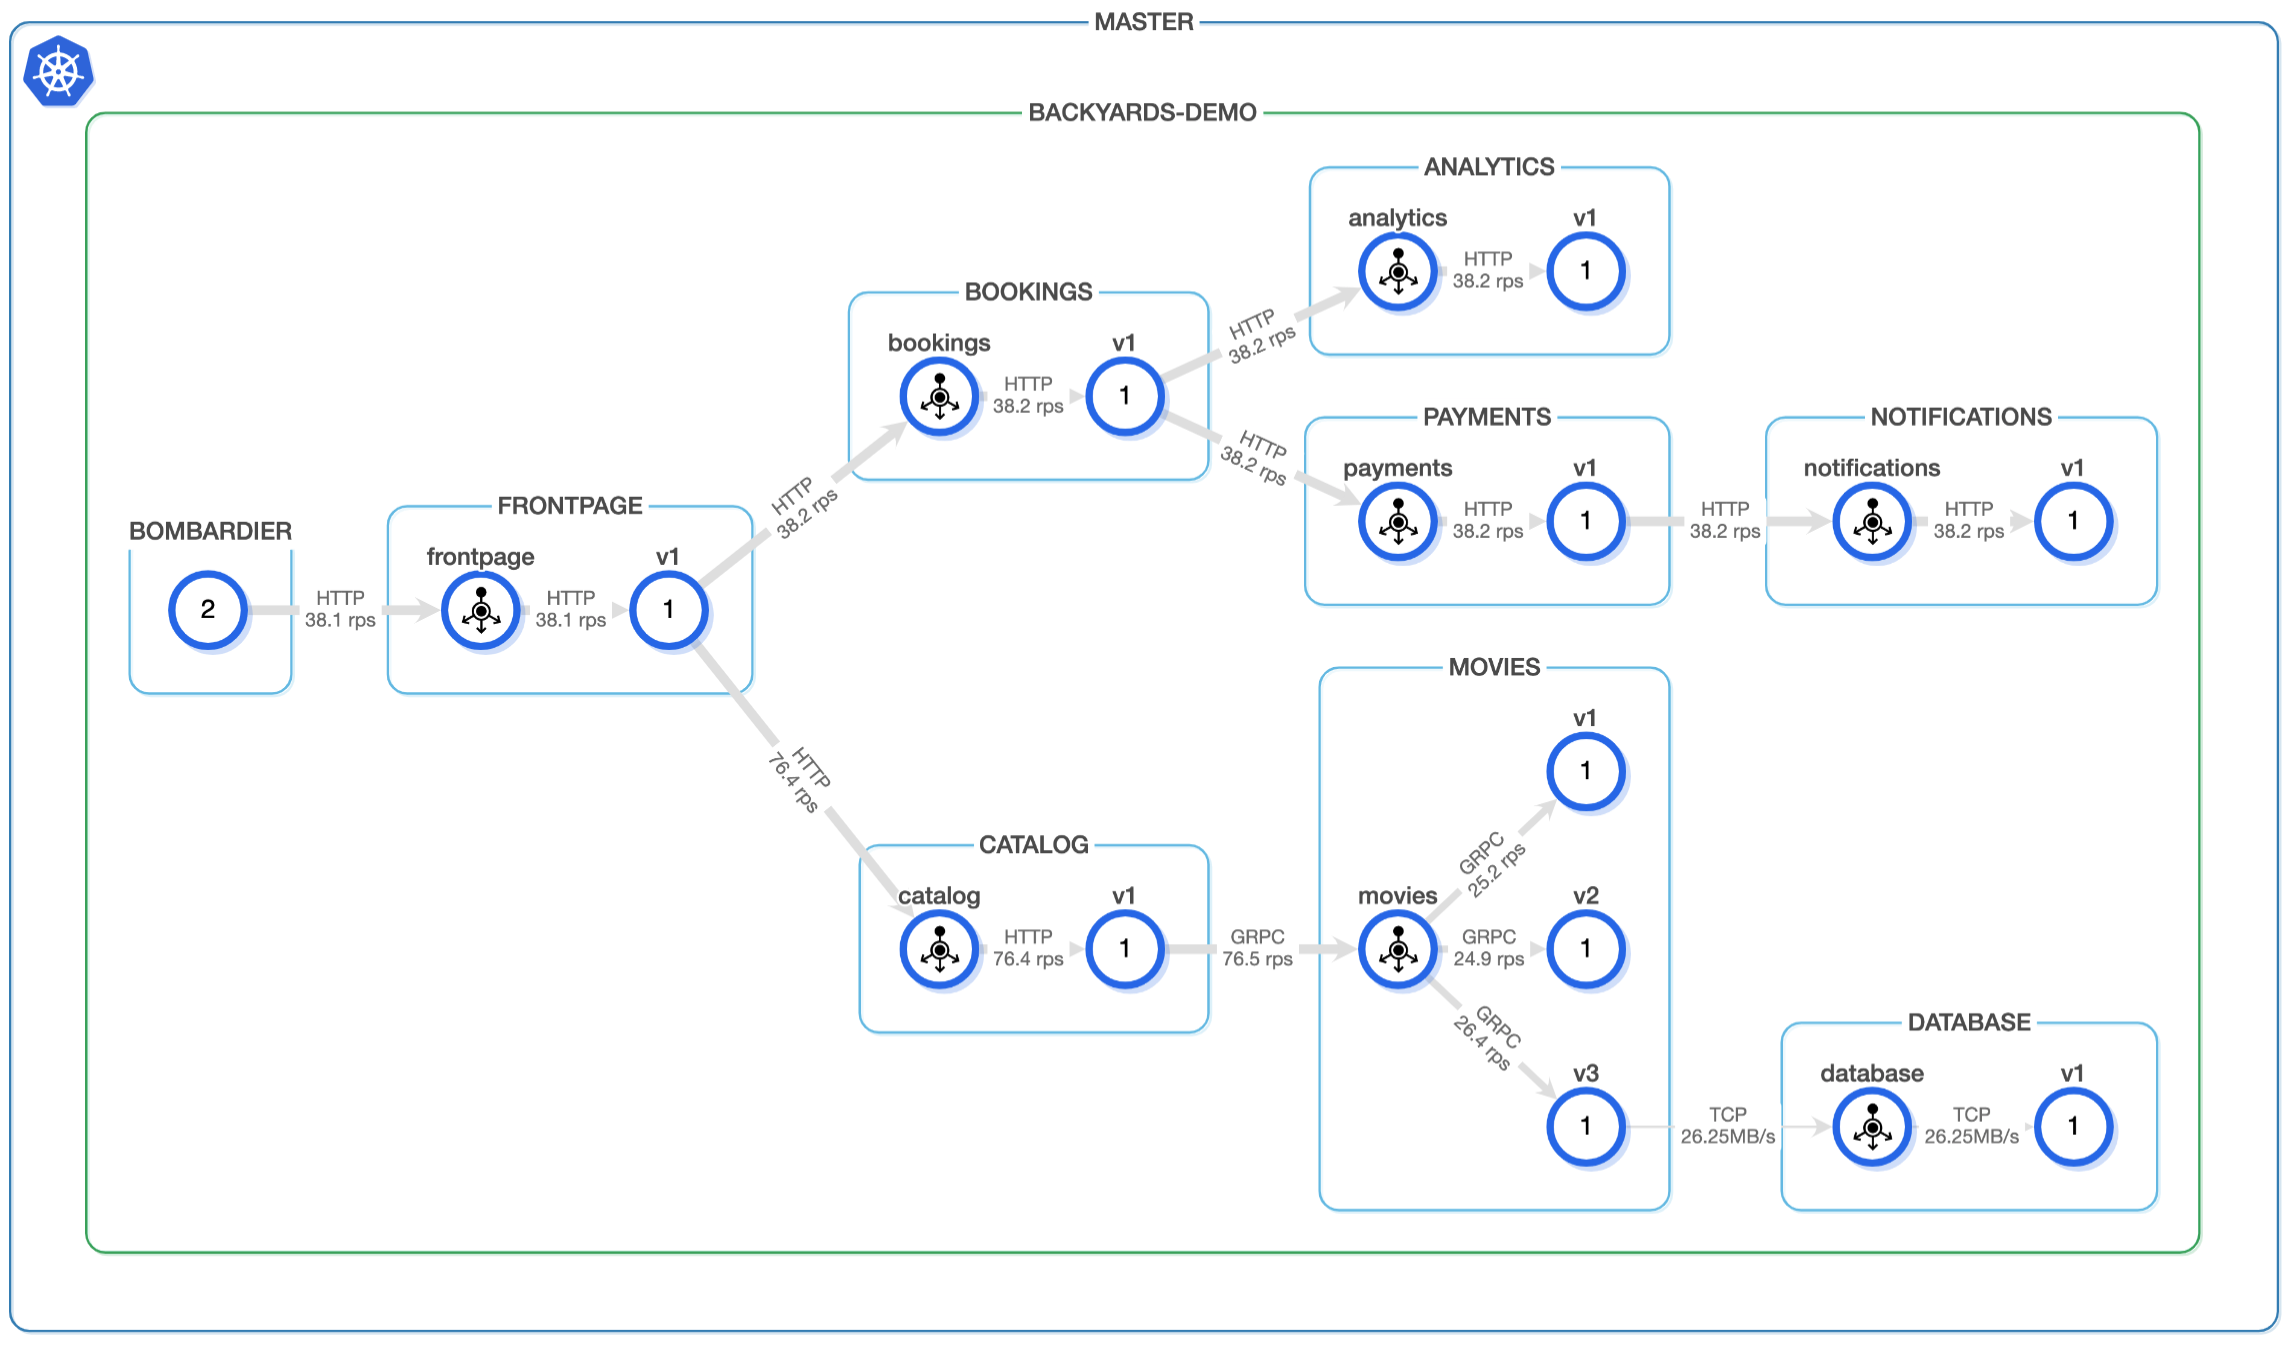
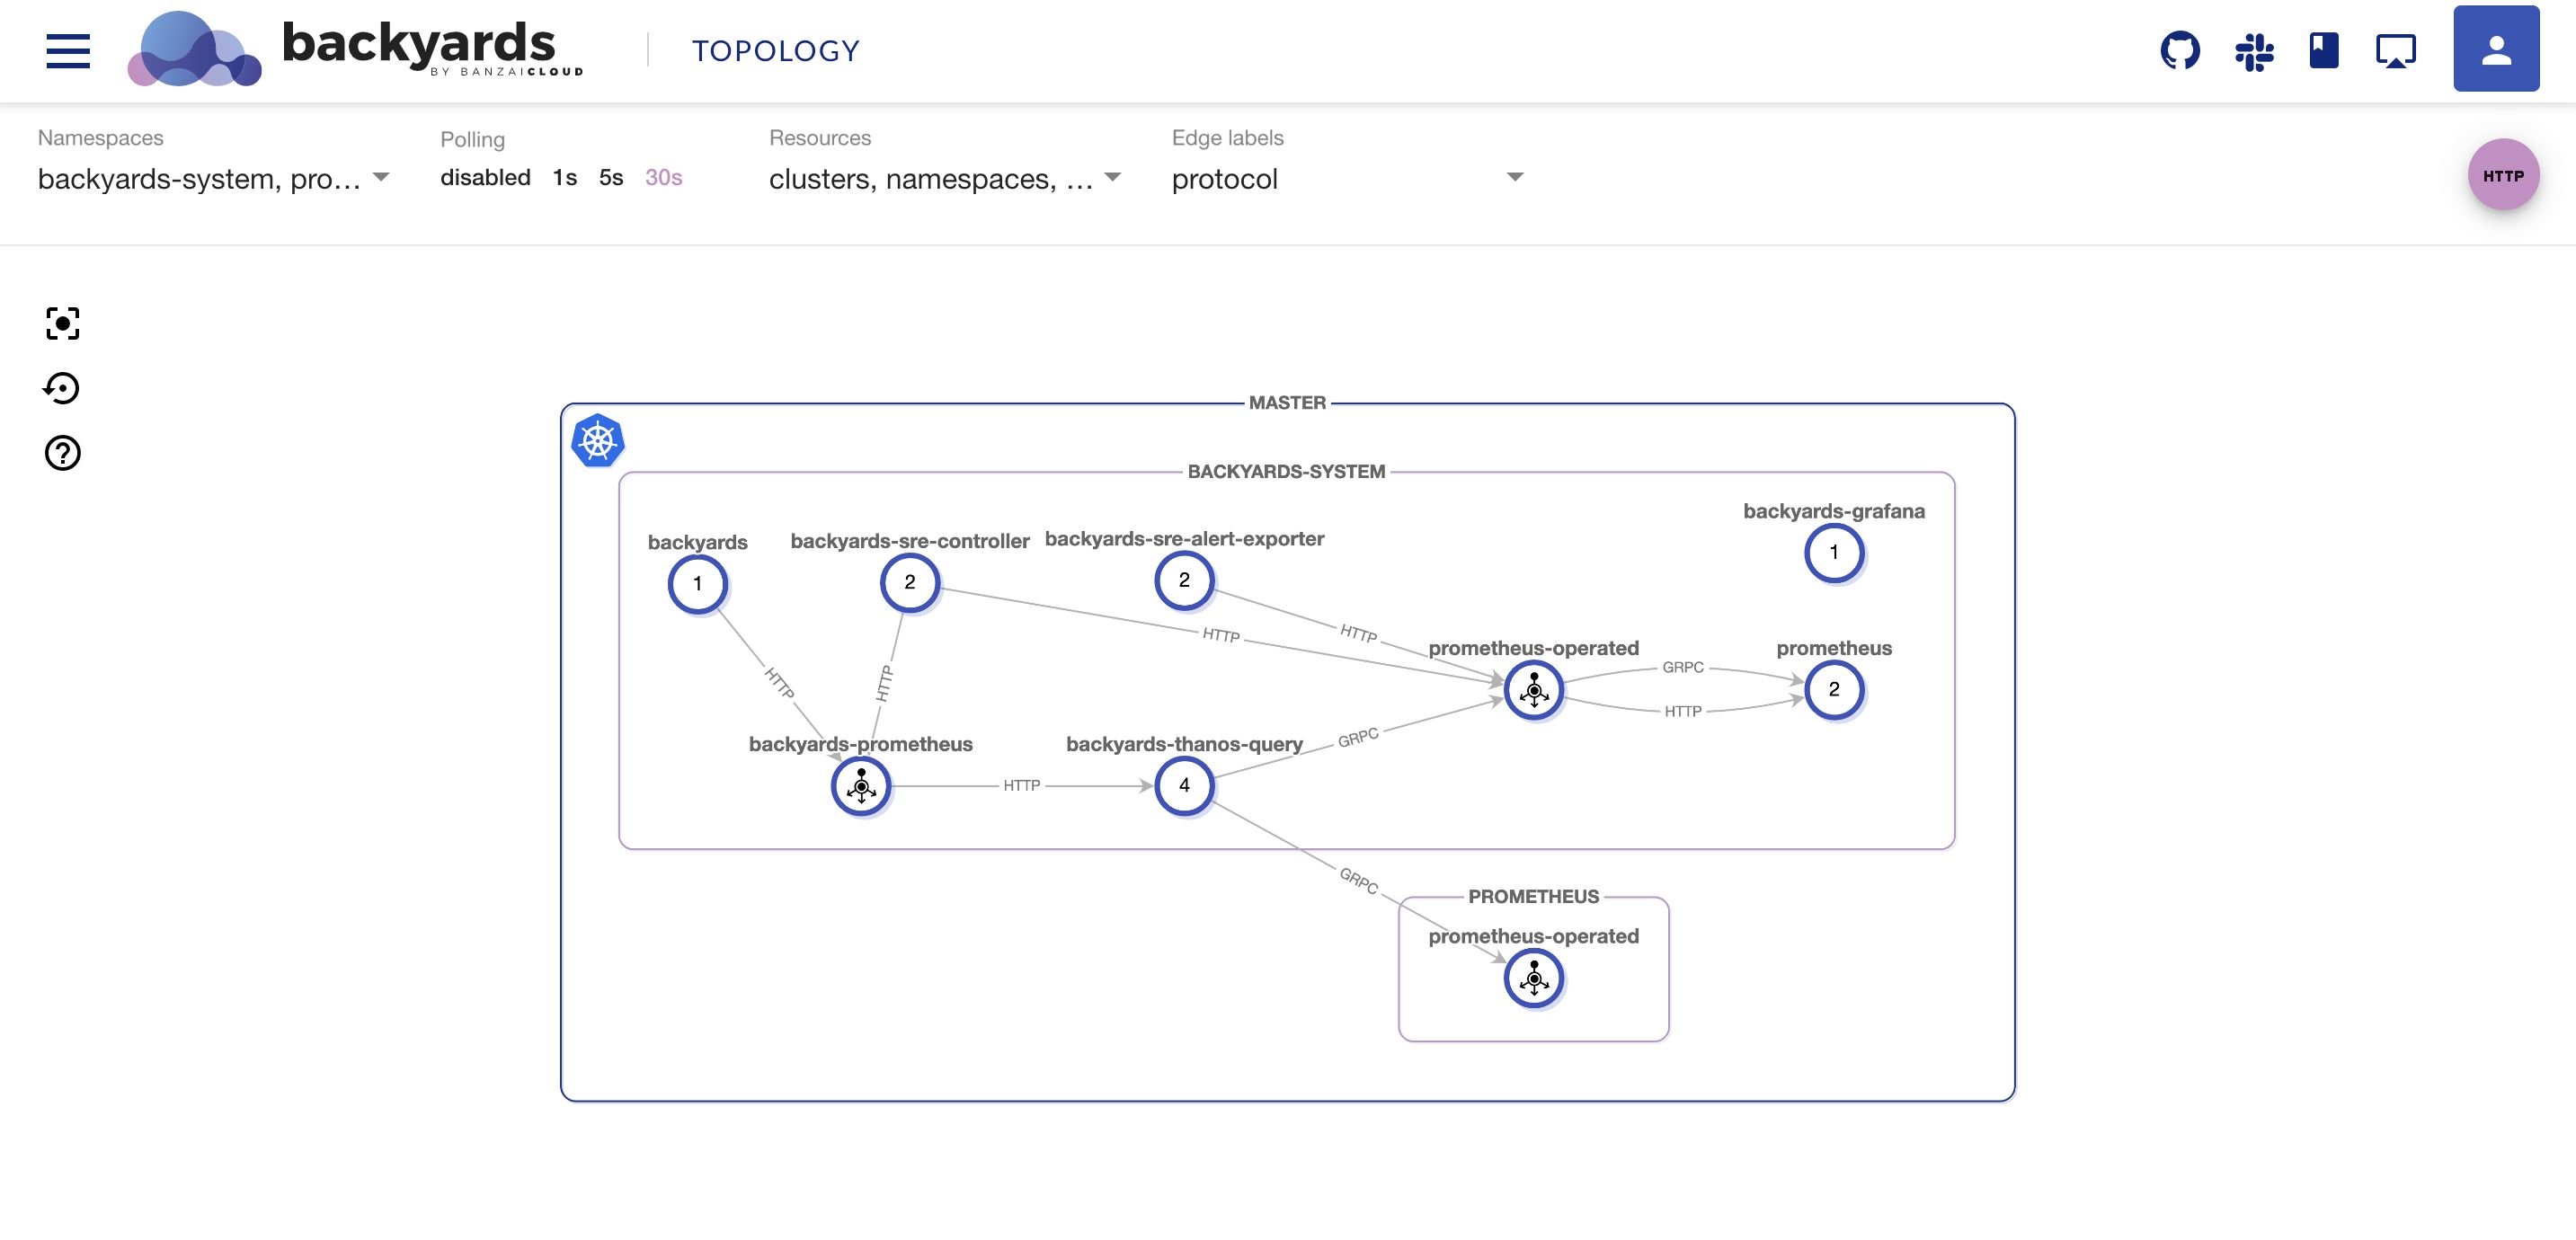
We previously covered the basics of burn rates in our last blog post about enforcing SLOs and in our Tracking and enforcing SLOs webinar. Even if the basic concept is clear (if a burn rate is greater than 1, the SLO is in danger), it can be difficult to develop a strategy for alerts based on burn rate values.
Of course, when implemented properly, burn rate-based alerting ensures that Service Level Objectives (SLOs) are enforced and met. However, when comparing them to traditional, threshold-based alert models (such as an alert going off whenever 90% of the requests in the last 2 minutes have taken longer than 200ms) the problem is self-evident:
A burn rate is a relatively abstract term, which might make the properties of a system that uses burn rate-based alerting confusing and unintuitive.
In the threshold-based model, the engineer responsible for setting up the alert had a clear grasp of what to expect after an alert fired and, more importantly, when to expect an alert to fire.
On the other hand, who can say when, with an SLO of 99.9% over a 30 day rolling window that requires a response latency of 200ms, a multi burn rate alert with a threshold of 14.4 over a 1-hour lookback window, with a 5-minute long control window, will fire?
If you are already familiar with SLO-based alerting, it should be a given that these alerts will be quite sensitive as they will fire within minutes. When operating complex systems, however, these kinds of uncertainties are not acceptable: a deep understanding of a system’s characteristics (including its alerting strategy) will improve the Mean Time To Recovery from incidents (or outages) that occur during everyday operations.
In this blog post, we’re going to demonstrate how the properties of burn rate-based alerts can be better understood and how Backyards (now Cisco Service Mesh Manager), our enterprise-grade service-mesh platform, can help you on your journey to implement such an alerting strategy.
Anatomy of an outage 🔗︎
Before getting into the calculations involved for burn rate-based alerts, let’s first take a look at how an incident is handled. This will help us understand what metrics we should be looking for when designing an alerting strategy based on SLOs.
Whenever an issue arises, there is also a process around solving that issue. For the sake of this discussion, the term “process” will be used in the vaguest possible sense, it can be:
- Customers calling the CEO of the company (alerting system), then him calling somebody from the operations team to fix the issue
- Relying on a monitoring system, then fixing the alert through some unspecified means
- Having an SLO-based system for alerts, which visualizes and enforces end user’s needs by making sure that the systems operate between the limits of SLOs.
When considering all of these “processes”, regardless of implementation, the first question that comes to mind is how fast can the system be recovered. This will be the first metric for which we’ll want to optimize our alerting strategy. This is called Mean Time To Recovery (MTTR). This is the amount of time needed to fix the underlying issue, beginning from the point at which the issue first arises.
Based on these example processes, let’s see what factors make up MTTR:
- First, the issue happens on a system. This is when the clock starts ticking.
- Somebody who can fix the issue is then notified. In the case of automated monitoring, this is often the delay between the issue occurring and the first alert firing to the on-call personnel. We will call this metric time to first alert.
- Either explicitly or implicitly, the issue is prioritized, and a determination is made about whether it should be solved right now, or later. We will call this incident priority.
- Then the issue gets fixed on the systems. This is the time needed to do the actual work of solving the issue.
- Even if a system looks fine, automated monitoring systems will not resolve the alert instantly, since they monitor systems for further defects before considering an issue resolved. This is called the alert resolves after.
When trying to decrease the MTTR of a system, the first and most obvious approach is to decrease the time to first alert. In order to determine what needs to be decreased, first, we need to know our baseline.
Calculating alerting time 🔗︎
As we previously explored in our last blog post about enforcing SLOs, multi burn rate alerts have more useful properties than other alerts. Such alerts can be defined in PromQL using the following rule:
- alert: SLOBurnRateTooHigh
  expr:   catalog:istio_requests_total:error_rate1h >= 14.4 * 0.001
        and
          catalog:istio_requests_total:error_rate5m >= 14.4 * 0.001
To simplify the calculations involved, we will only be examining one of the conditions. To find when the alert is triggered we need to understand when catalog:istio_requests_total:error_rate5m >= 14.4 * 0.001 becomes true.
In this formula, 14.4 is the Burn Rate Threshold set for the alert (BurnRate), while 0.001 is the error budget of the SLO the alert is based on. The error budget is calculated by subtracting the SLO goal (SLOGoal) from 100%. This yields the following equation:
catalog:istio_requests_total:error_rate5m = BurnRate * (100 - SLOGoal)
The catalog:istio_requests_total:error_rate5m is calculated by evaluating our Service Level Indicator over the course of five minutes. To get the value of time to first alert, let us assume that the system was previously in good working order (current error rate = 0), then it started to misbehave by constantly exhibiting a current error rate of ER.
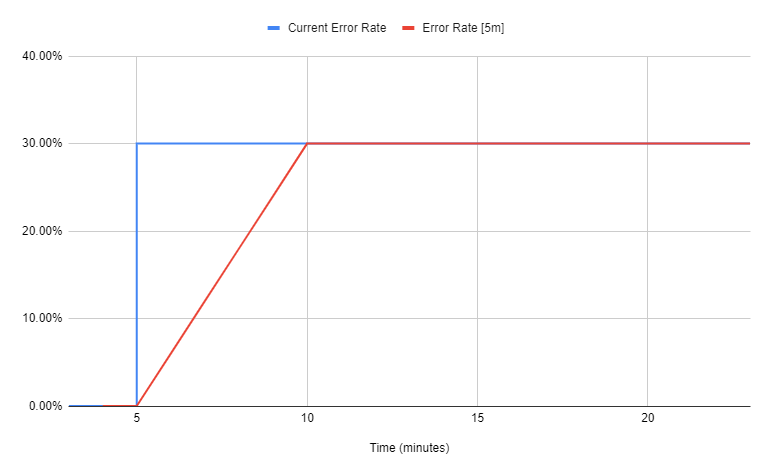
This graph shows how the error rate over a 5-minute window (WindowSize) changed when the system’s current error rate climbed to 30% at 5 minutes:
As the number of faulty data points within the window increases, the error rate converges with the current error rate. This means that the formula above can be rewritten in this form:
CurrentErrorRate * (t/WindowSize) = BurnRate * (100 - SLOGoal)
Where t is the time to first alert. When arranging the equation, we are presented with this formula:
t = BurnRate * (100 - SLOGoal) * WindowSize / CurrentErrorRate
Linear equations have the uncanny tendency to always have exactly one solution. If you’ll consider the previous graph of the error rate, you’ll see that after five minutes the “error rate over five minutes” value increases. As a result, if t is greater than WindowSize, then the alert will never fire, so we only want solutions between 0 and WindowSize.
Of course, this is just one of two conditions that need to be met when calculating the time to first alert for a multi burn rate alert. To find the final value, we’ll have to use the maximum of both windows’ time to first alert.
Failure Scenarios 🔗︎
Fine-tuning a system’s alerting strategy based on these formulas would be quite time-consuming. To simplify the process, we will be relying on Backyards’ SLO features - specifically, its built-in calculator - to show how different alerts behave.
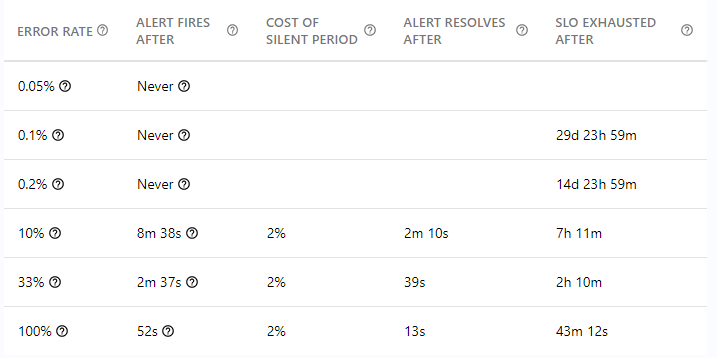
In the previous calculation, we took a shortcut by assigning an arbitrary percentage to the current error rate. This helped simplify our calculations; on the other hand, this percentage will have to be specified when trying to calculate time to first alert. To get around this issue, Backyards (now Cisco Service Mesh Manager) presents the user with different failure scenarios represented by different current error rate values:
Starting at the bottom and working our way up, our first scenario (100% error rate) simulates the alert’s behavior during a total system outage. Given that these issues result in a high burn rate, and thus the SLO’s error budget being rapidly exhausted (last column), we recommend setting a sensitive (fast) burn rate alert to address this scenario. As in the case of the 99.9% SLO target, these issues should be fixed within 43 minutes, we recommend using a high (page level) incident priority to handle such cases.
The next scenario is about having a Kubernetes deployment spanning over three different failure domains (availability zones). Here, a 33% error rate indicates alerting times when one availability zone fails completely. When implementing an alerting strategy for this, it is recommended that you consider the frequency and duration of such errors, and the actual work needed to remove the availability zone from the running cluster.
To understand the 10% scenario it should be noted that most system outages are due to code errors that are not discovered during testing. For microservice architecture, assuming that a single service provides multiple endpoints with different code paths, 10% is a good estimate for the impact of such a failure.
The 0,1% and 0,2% scenarios show how alerting behaves when the system is slowly burning its error budget. These scenarios deplete the available error budget slowly, so it is generally recommended to treat these as lower priority incidents (ticket severity in Backyards (now Cisco Service Mesh Manager)).
Finally, the 0,005% scenario shows how the system behaves when the error budget is being burnt more slowly than what is allowed by the SLO. This scenario can be used to check that no alerts are being sent when the error budget is being burnt in an acceptable manner (no alerting should occur on these, by default).
If the current SLO period’s error budget is close to depleted, or there is a planned maintenance window that would consume a fraction of the error budget, the alerts can be changed to create low severity tickets that indicate if something needs to be fixed, and which secure the maintenance window’s error budget.
Fine-tuning a fast burn rate alert 🔗︎
Fast burn rate alerts are designed in such a way that they fire when the system’s error budget is being consumed (burned) fast.
If you have an SLO with a 99.9% goal over a 30 day rolling window, then a good burn rate alert can be set using the following parameters:
- Burn Rate: 14.4
- Primary lookback window: 1 hour
- Control Lookback window: 15 m
- Alert delaying is disabled
The characteristics of such an alert can be summarized thusly:
This alert (when taking into account the 99.9% SLO target) seems strict enough, but, based on the underlying system’s characteristics, we might want to make a few tweaks. First of all, the alert resolves after is just 13 seconds in the event of a total outage. It’s worth increasing the control lookback window of this alert, in case it is triggered multiple times during an outage. Since the time to first alert corresponds to the maximum alert times of the primary and control lookback windows, this will not change the alert fires after metric associated with the alert.
In case the alert has proved to be too sensitive (fires too frequently), alert delaying can be set to one to two minutes, in order to suppress some of the alert noise. On the other hand, such issues often indicate that micro outages are occurring in the system, and should be investigated. Also, setting the alerting delay to 2 minutes would mean that the alerts are arriving later, therefore increasing the MTTL. The cost of the silent period (amount of error budget burnt by the time to the first alert) would also increase from 2% to 6.63% of the system’s total error budget over the current SLO period.
Verifying the alerting strategy 🔗︎
As we already mentioned in our last blog post about enforcing SLOs, when using burn rate-based alerting, multiple alerts should be defined to enforce our SLOs.
In a Prometheus-based monitoring system, if multiple alerts are firing for the same service, it can be configured to trigger only the first alert of a given service. Backyards (now Cisco Service Mesh Manager) recommends setting up an alert manager this way. This means that, if the defining alerts react on the same issues as the fast burn-rate alerts, but are slower to react, the fast burn rate alert will take precedence.
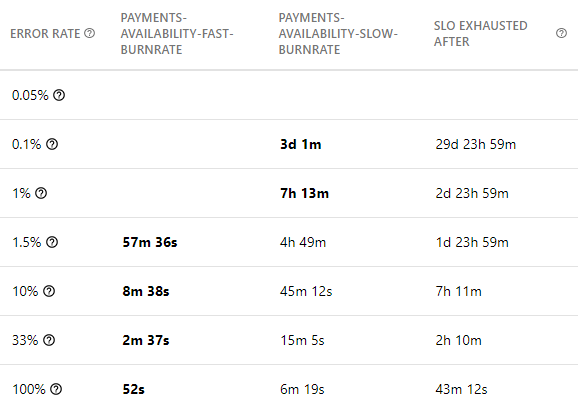
With that in mind, you can see how (in the previous example) a fast burn rate alert will never act on sufficiently sporadic issues (error rate ~< 5%). To circumvent this problem, we recommend the implementation of one or two additional alerts.
A slow burn rate alert should be created that is designed to trigger a ticket severity incident to analyze issues that are slowly burning the error budget. In such cases, it is perfectly acceptable to fix the issues involved the next day. A good starting point for defining a slow burn rate alert are as follows (assuming 30 days rolling SLO):
- Burn Rate: 1
- Primary lookback window: 3 days
- Control lookback window: 6 hours
The image below illustrates this by placing the error rates in each row, and showing slow and fast burn rates (the columns) and time to first alert values in the cells.
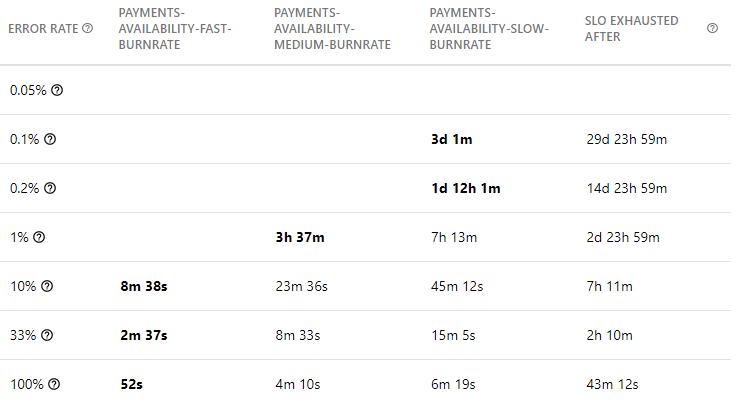
In the previous image, we can see how a 1% error rate would only trigger an alert after 7h 13m. If, based on experience, the increased MTTR caused by this time to first alert is not acceptable, a 3rd alerting policy (medium rate) should be created. A good starting point for defining a medium burn rate alert is as follows (assuming 30 days rolling SLO):
- Burn Rate: 6
- Primary lookback window: 6 hours
- Control lookback window: 30 minutes
Adding such an alert to the mix would result in this alerting strategy:
Visualizing the alerting strategy 🔗︎
Of course, Backyards (now Cisco Service Mesh Manager) also provides a graphical representation of this relationship. The following line-chart is available on the user interface, so as to provide a better understanding of the strategy of the alerts for each service:
The fast burn rate alert (represented by the bottom line) can only alert for outages with a burn rate of more than ~1.5%. The medium burn rate alert (middle line) complements it by providing a high priority alerts setup for error rates between 0.5% and 1.5%.
Finally, the slow burn rate alert (topmost line) makes sure that, if we are using up our error budget faster than our SLO allows, a ticket is created.
Conclusion 🔗︎
Burn rate-based alerting can be quite complex due to the many abstractions inherent in its framework. With the right tooling (such as Backyards (now Cisco Service Mesh Manager)) and with the continuous improvement of alerting practices, this framework can be tailored to your system’s and organization’s needs, in order to provide a reliable monitoring and measurement solution.
If you want to check out these features yourself (even run them on your own machine), feel free to explore our installation guide, which is available on Backyards’ documentation page. To learn how you can create your own Service Level Indicator templates and import external Prometheus metrics into Backyards, see our Defining application level SLOs using Backyards blog post.
About Backyards 🔗︎
Banzai Cloud’s Backyards (now Cisco Service Mesh Manager) is a multi and hybrid-cloud enabled service mesh platform for constructing modern applications. Built on Kubernetes, our Istio operator and the Banzai Cloud Pipeline platform gives you flexibility, portability, and consistency across on-premise datacenters and on five cloud environments. Use our simple, yet extremely powerful UI and CLI, and experience automated canary releases, traffic shifting, routing, secure service communication, in-depth observability and more, for yourself.


