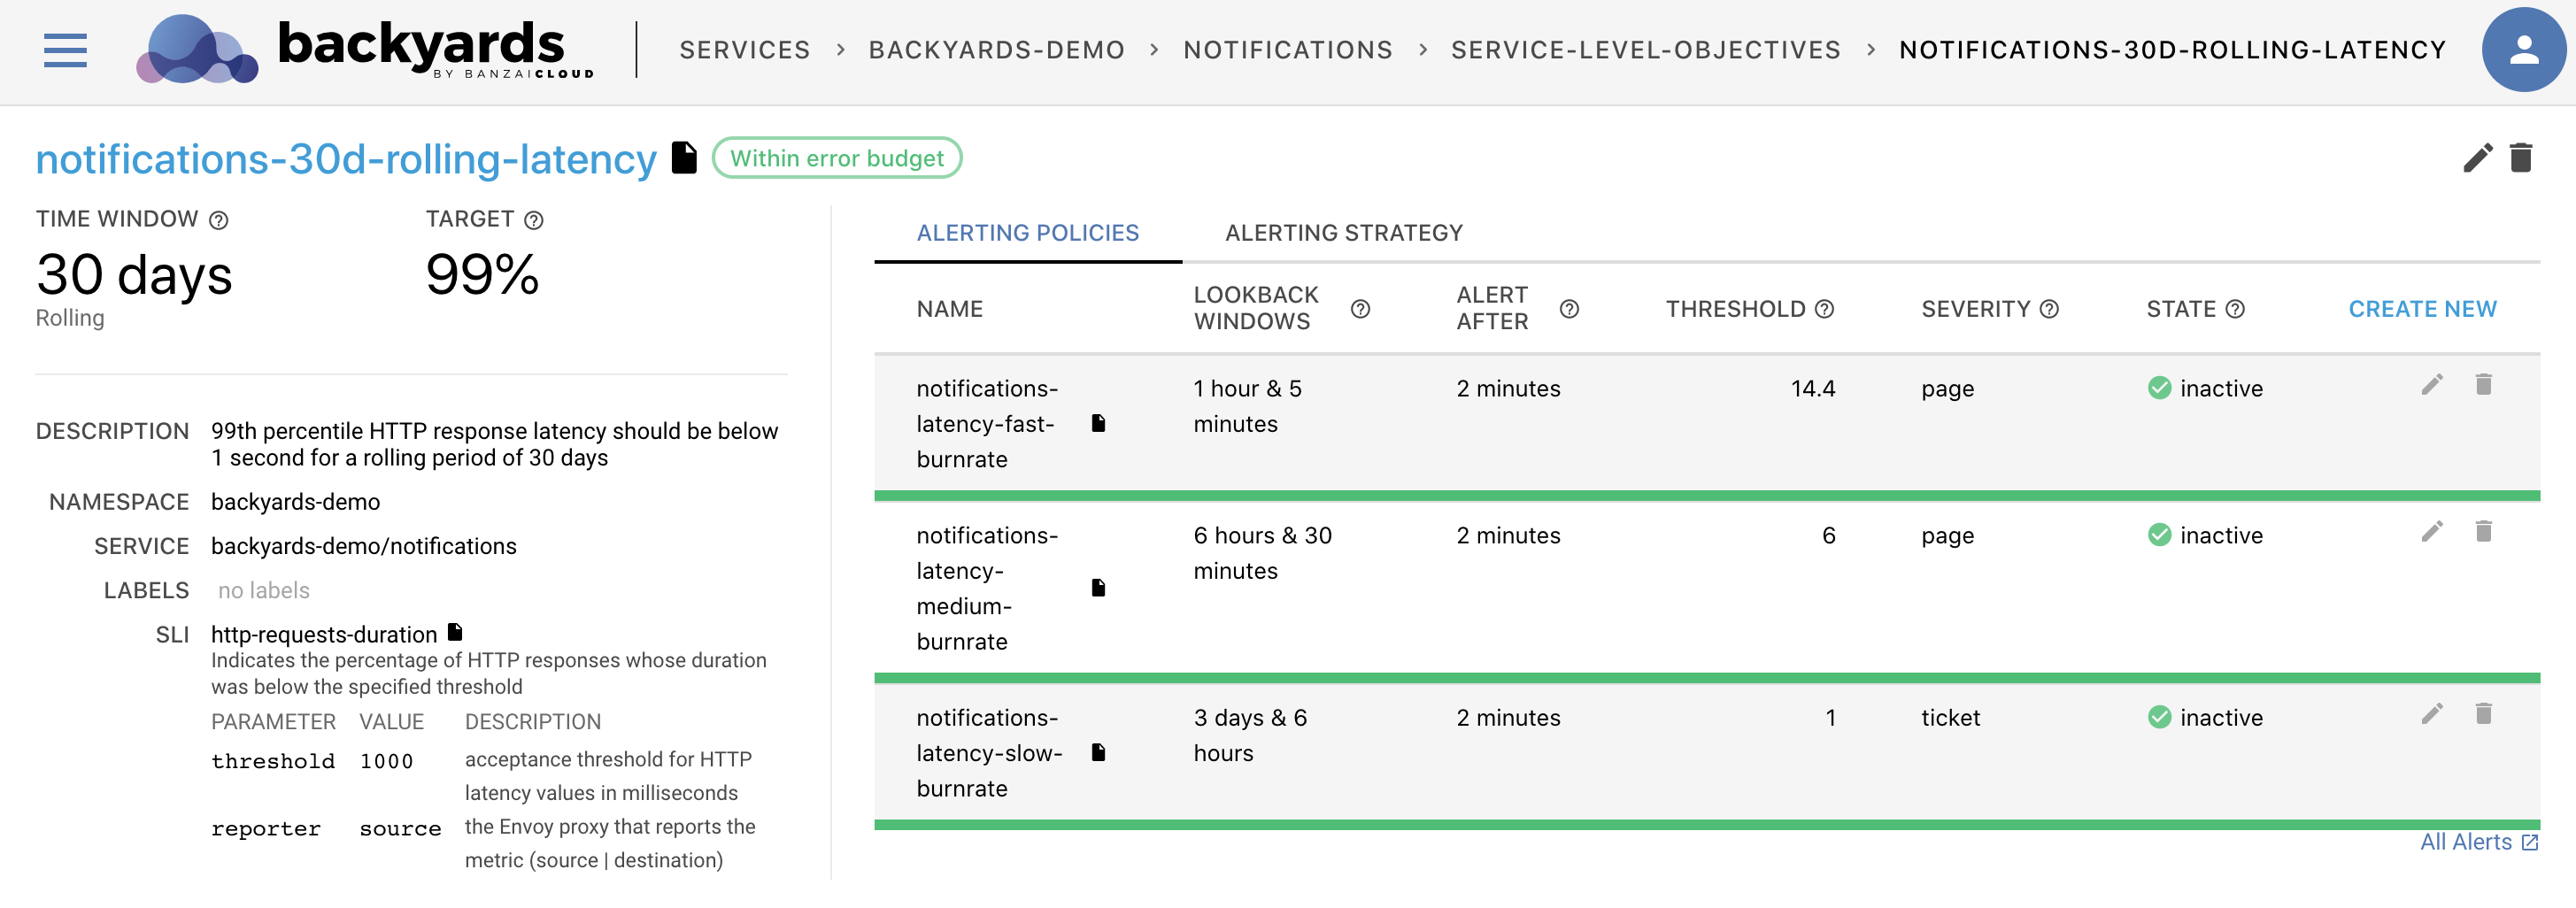
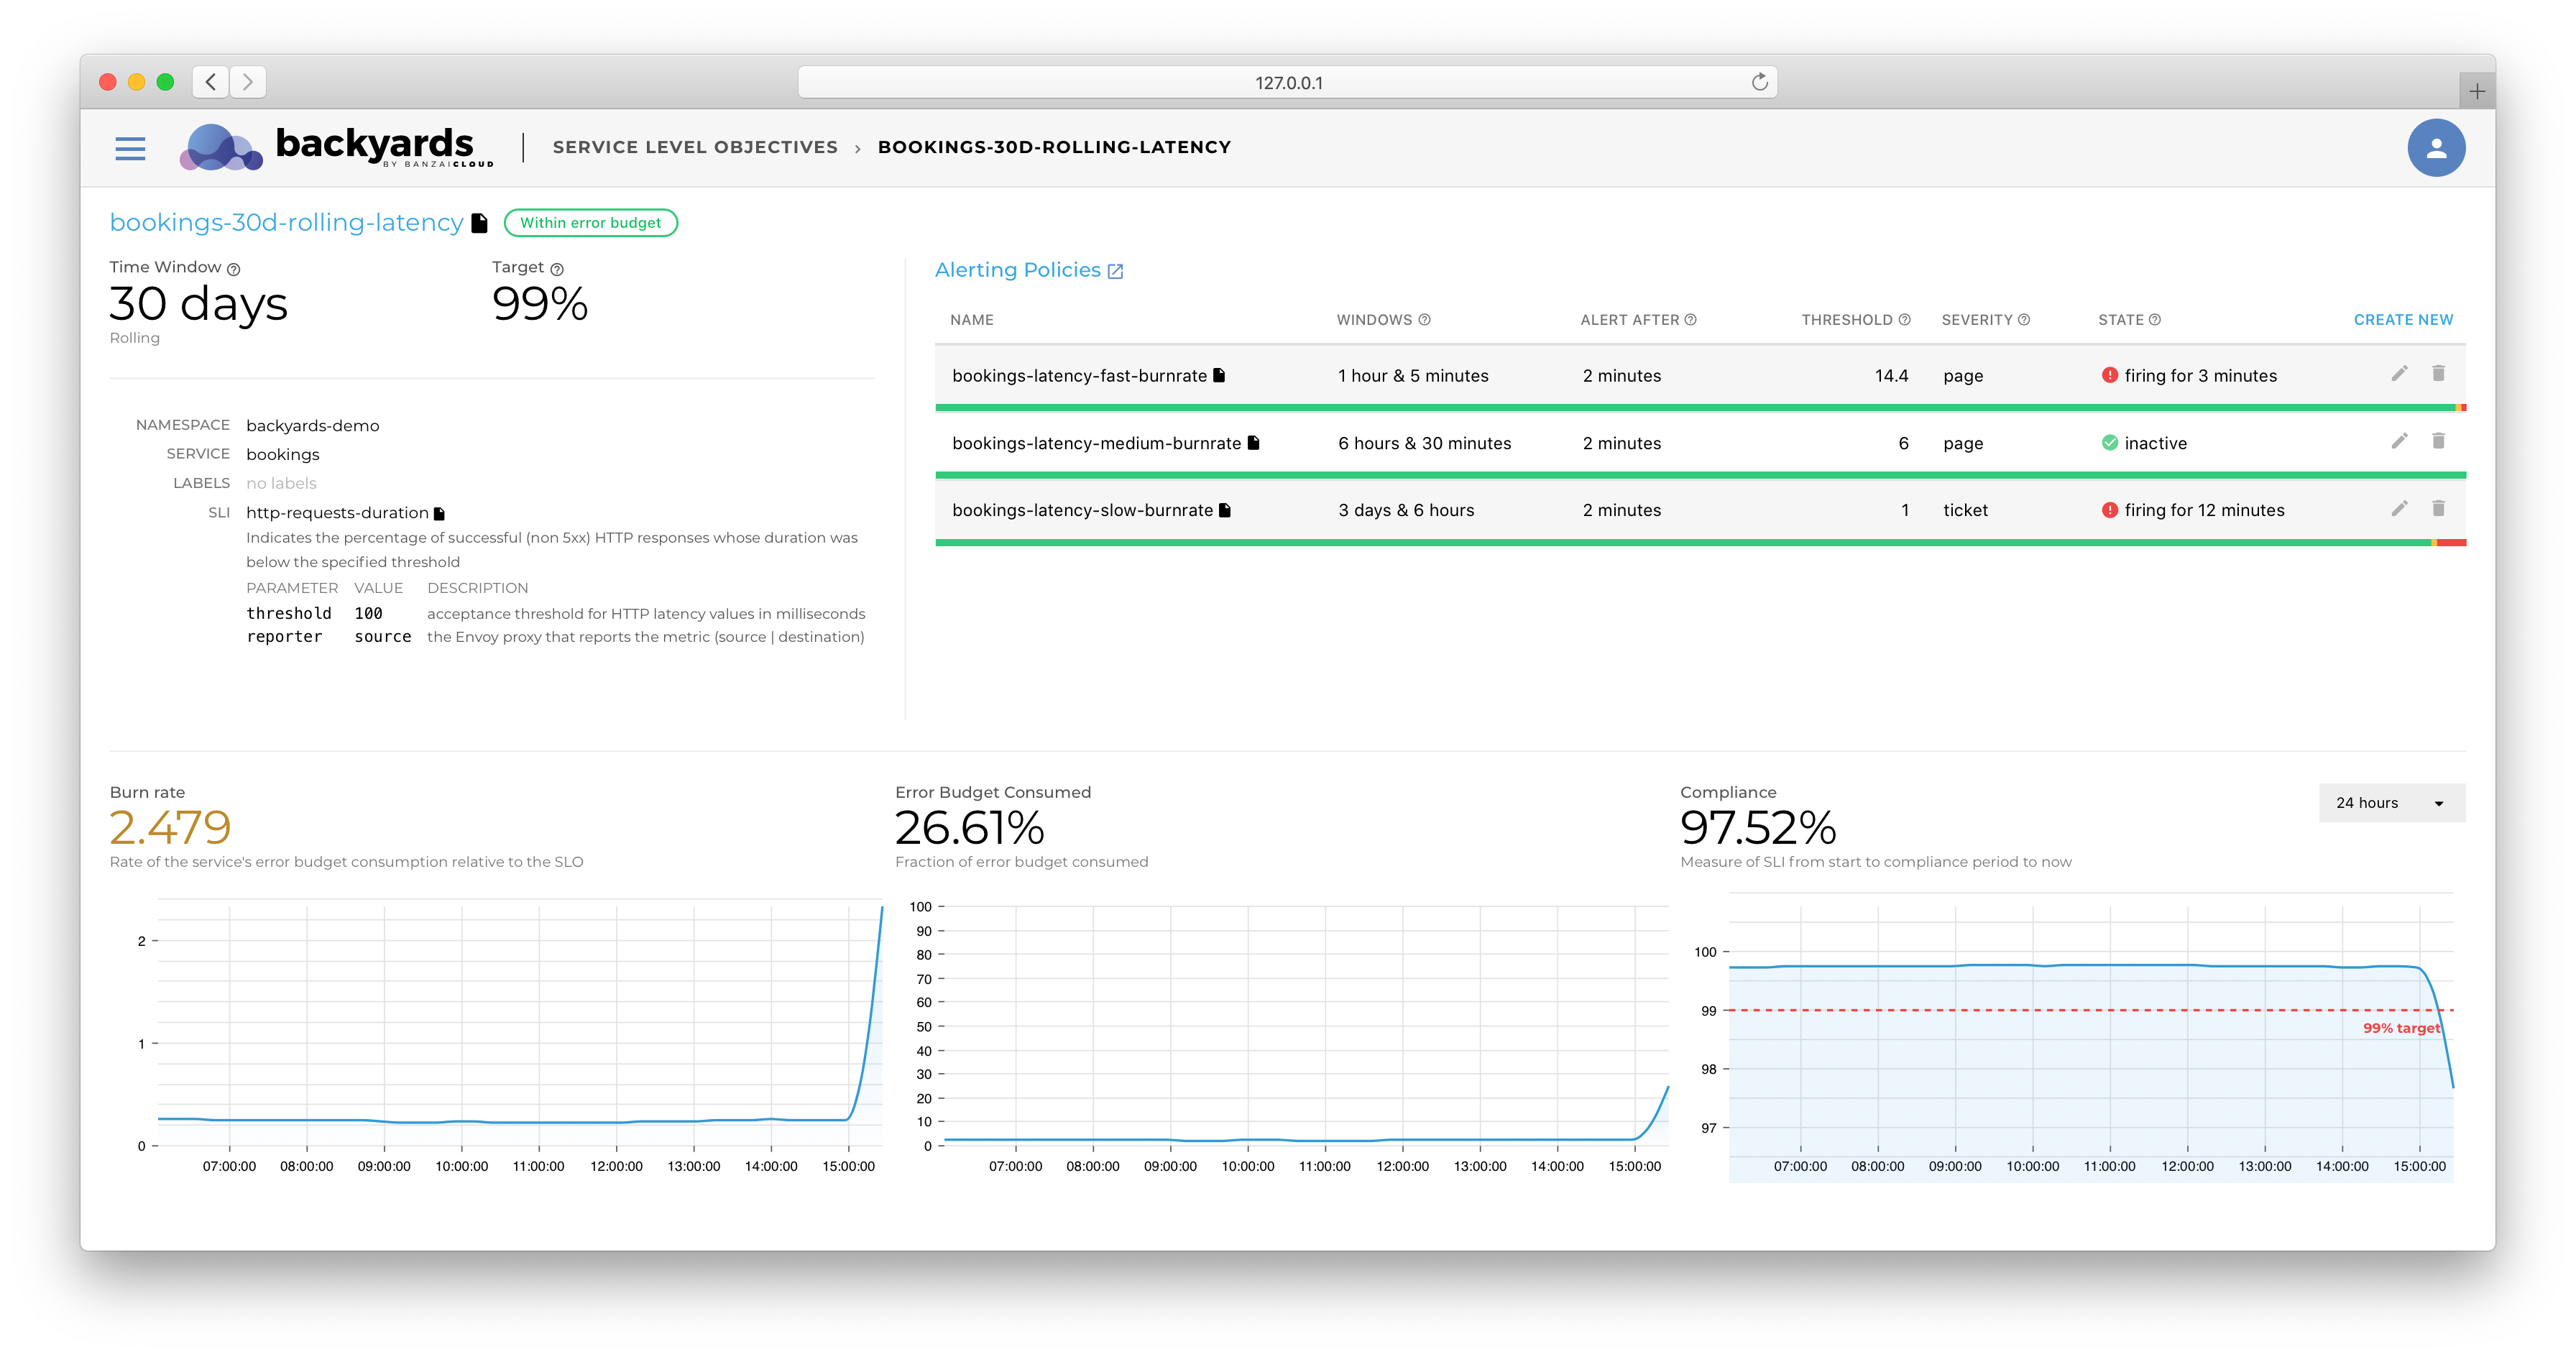
Backyards (now Cisco Service Mesh Manager) provides, out-of-the-box, Service Level Objective-based monitoring and alerting solutions for monitoring HTTP/GRPC-based microservice latencies and error rate characteristics. The decision to only provide these Service Level Indicators as part of the base installation was due to the fact that only Istio itself is able to provide the metrics they require. On the other hand, as we had briefly discussed in the Tracking and enforcing SLOs webinar, the SLO-based measurement of systems can not and should not be limited to these three measurements.
To address this, Backyards’ SLO implementation was created while keeping extensibility in mind. In this blog post, we will be covering how to leverage Backyards for SLO-based alerts, using only the pre-existing Prometheus instances and metrics provided by running the application.
Service Level Objectives 🔗︎
As detailed in our previous blog post, Tracking and Enforcing SLOs, an SLO is a service level objective: a target value or range of values for a service level that is measured by a Service Level Indicator (SLI). This definition means that defining your own SLO is mostly a matter of providing the right SLI for your workloads.
An SLI is, essentially, what you use to measure levels of service. For example, an SLI can be:
- the success rate of HTTP requests,
- the percentage of requests below a certain latency threshold,
- the amount of time a service is available, or
- any other metrics that somehow quantitatively describe the state of the service.
In Backyards, we formulate our SLI as the ratio of two numbers: the good events divided by the total events. This way the SLI value will be between 0 and 1 (or 0% and 100%), and it’s easily matched to the SLO value, which is typically defined as a target percentage over a given timeframe. The previous examples all follow this practice.
Service Level Indicator (Templates) 🔗︎
Whether modern microservice-based architectures tend to be quite diverse when it comes to programming languages, or developers tend to use frameworks and gravitate towards more proven, well-tested solutions, the number of different frameworks and languages tends not to increase heavily over time.
The majority of current programming languages and (backend) development frameworks provide their own implementation of a Prometheus metric exporter. Even if those implementations yield different metrics, due to the smaller variance in frameworks, multiple services will be likely to share the same metric structure.
To capitalize on this fact, and to maximize reusability in the monitoring stack, Backyards relies on a custom resource called ServiceLevelIndicatorTemplate.
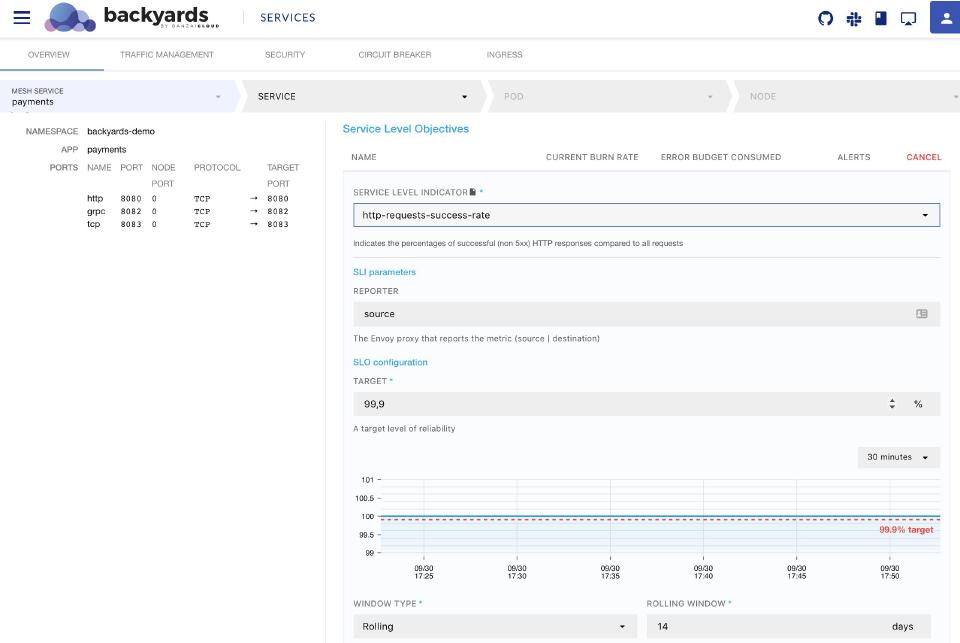
Let’s take a look at the predefined http-requests-success-rate Service Level Indicator in Backyards. On the Dashboard it can be found the following SLO form:
In the background, this user interface is built from this Custom Resource:
apiVersion: sre.banzaicloud.io/v1alpha1
kind: ServiceLevelIndicatorTemplate
metadata:
  name: http-requests-success-rate
  namespace: backyards-system
spec:
  goodEvents: |
    sum(rate(
      istio_requests_total{reporter="{{ .Params.reporter }}", destination_service_namespace="{{ .Service.Namespace }}", destination_service_name="{{ .Service.Name }}",response_code!~"5[0-9]{2}|0"}[{{ .SLO.Period }}]
    ))
  totalEvents: |
    sum(rate(
      istio_requests_total{reporter="{{ .Params.reporter }}", destination_service_namespace="{{ .Service.Namespace }}", destination_service_name="{{ .Service.Name }}"}[{{ .SLO.Period }}]
    ))
  kind: availability
  description: |
    Indicates the percentages of successful (non 5xx) HTTP responses compared to all requests
  parameters:
  - default: source
    description: the Envoy proxy that reports the metric (source | destination)
    name: reporter
This example resource describes the PromQL query required to calculate the number of goodEvents and totalEvents using a Go templated string, allowing Backyards to reuse the SLI in different contexts (such as calculating the SLO’s compliance value or calculating the predicted error rates for alerting purposes).
To enable code reuse, the Service Level Objective custom resources only references these templates, resulting in a more condensed description at the application side. For example, the Frontpage included in Backyards’ demo application defines this ServiceLevelObjective custom resource as:
apiVersion: sre.banzaicloud.io/v1alpha1
kind: ServiceLevelObjective
metadata:
  name: frontpage-30d-rolling-availability
  namespace: backyards-demo
spec:
  description: HTTP request success rate should be above 99.9% for a rolling period of 30 days
  selector:
    name: frontpage
    namespace: backyards-demo
  sli:
    parameters:
      reporter: destination
    templateRef:
      name: http-requests-success-rate
      namespace: backyards-system
  slo:
    goal: "99.9"
    rolling:
      length: 720h
As you can see, the .spec.slo defines the SLO’s window size and goal, allowing us to easily understand the SLO’s properties without going over extensive PromQL queries. The .spec.selector specifies which Kubernetes Service this SLO is referring to, while the .spec.sli contains the information needed to instantiate an SLI from the template itself.
To understand how the number of good events is calculated, first the spec.sli.templateRef needs to be examined: that value specifies which SLI Template to use.
The PromQL template for good events looks like this:
sum(rate(
      istio_requests_total{reporter="{{ .Params.reporter }}", destination_service_namespace="{{ .Service.Namespace }}", destination_service_name="{{ .Service.Name }}",response_code!~"5[0-9]{2}|0"}[{{ .SLO.Period }}]
    ))
The template parameters are calculated using the SLO custom resource. In the previous example, the values are evaluated the following way:
| Variable | Meaning | Value in the example |
|---|---|---|
.Service.Namespace |
Service’s namespace that this SLI measures | backyards-demo |
.Service.Name |
Service’s name that this SLI measures | frontpage |
.SLO.Period |
The time frame over which the SLI calculated | Variable based on usage |
.Params.reporter |
The value of the parameter coming from the ServiceLevelObjective Custom Resource | destination |
The parameters feature also allows for extending the UI in case the SLI needs additional configuration options (such as latency threshold, or, as in this example, the name of the reporter envoy proxy).
Example: A Test Application 🔗︎
To demonstrate how to define a custom Service Level Indicator Template, let us assume that we have a worker pool application for a payments system, which processes those background activities related to payment flow (such as sending welcome e-mails, confirming transactions in the background, or trying to renew the user’s license).
This application is written in Python, and uses Celery as the framework for processing jobs. We would like to implement an SLO that ensures that 99.9% of these background processing tasks have run successfully.
Celery comes with a module for providing Prometheus metrics, called celery-exporter. This exporter exposes the queue success statistics in the following format:
celery_tasks_total{name="my_app.tasks.calculate_something",namespace="celery",queue="celery",state="RECEIVED"} 0.0
celery_tasks_total{name="my_app.tasks.calculate_something",namespace="celery",queue="celery",state="PENDING"} 2.0
celery_tasks_total{name="my_app.tasks.calculate_something",namespace="celery",queue="celery",state="STARTED"} 0.0
celery_tasks_total{name="my_app.tasks.calculate_something",namespace="celery",queue="celery",state="RETRY"} 0.0
celery_tasks_total{name="my_app.tasks.calculate_something",namespace="celery",queue="celery",state="FAILURE"} 5.0
celery_tasks_total{name="my_app.tasks.calculate_something",namespace="celery",queue="celery",state="REVOKED"} 0.0
celery_tasks_total{name="my_app.tasks.calculate_something",namespace="celery",queue="celery",state="SUCCESS"} 13.0
These are the “raw” metrics exposed by the application. The first step in constructing the SLI Template is to understand how we can differentiate between the celery_tasks_total that belongs to this service and to other services that might be running.
Prometheus works such that, when fetching the metrics from a given service (scraping the service), it can enrich the metrics returned with added labels. Prometheus Operator takes this further by providing an opinionated list of labels to apply to those scraped metrics.
Let us say, that the application is a simple Kubernetes-based application with a basic deployment and a service in front of it:
apiVersion: v1
kind: Service
metadata:
  name: payments-worker
  namespace: payments
spec:
  selector:
    app: payments-worker
  ports:
    - protocol: TCP
      port: 8080
      name: metrics
      targetPort: 8080
First of all, the Prometheus Operator should be configured to scrape the service. This can be done by defining a new ServiceMonitor that instructs Prometheus to start scraping the Pods behind a given Service.
apiVersion: v1/monitoring.coreos.com
kind: ServiceMonitor
metadata:
  name: payments-worker
  namespace: payments
spec:
  endpoints:
  - port: metrics
    path: /metrics
  namespaceSelector:
    matchNames: [ "payments" ]
  selector:
    matchLabels:
      app: payments-worker
This ServiceMonitor Custom Resource ensures that the pods attached to the payments-worker Service (as the .spec.selector.matchLabels labels that match the ones on the Service itself) will get scraped. When this scraping configuration is processed by the Prometheus Operator, the previously mentioned metrics will be enriched with a few additional labels such as namespace, service and pod, that contain the namespace, service name and name of the pod that belong to a given metric line. As a result, the above metrics - when queried from the Prometheus side - will look like this:
celery_tasks_total{name="my_app.tasks.calculate_something",namespace="celery",queue="celery",state="SUCCESS",service="payments-worker", namespace="payments", "pod"="payments-worker-9x2wb"} 0.0
celery_tasks_total{name="my_app.tasks.calculate_something",namespace="celery",queue="celery",state="FAILURE",service="payments-worker", namespace="payments", "pod"="payments-worker-9x2wb"} 0.0
To define a new Service Level Indicator we would need to have two metrics: the number of total events and the number of good events. The following ServiceLevelIndicatorTemplate custom resources specifies this:
apiVersion: sre.banzaicloud.io/v1alpha1
kind: ServiceLevelIndicatorTemplate
metadata:
  name: celery-success-rate
  namespace: payments
spec:
  goodEvents: |
    sum(celery_tasks_total{service="{{ .Service.Name }}", namespace="{{ .Service.Namespace }}", state="SUCCESS"})
  totalEvents: |
    sum(celery_tasks_total{service="{{ .Service.Name }}", namespace="{{ .Service.Namespace }}", state=~"SUCCESS|FAILURE"})
  kind: availability
  description: |
    Indicates the percentages of successfully executed Celery jobs
  parameters: []
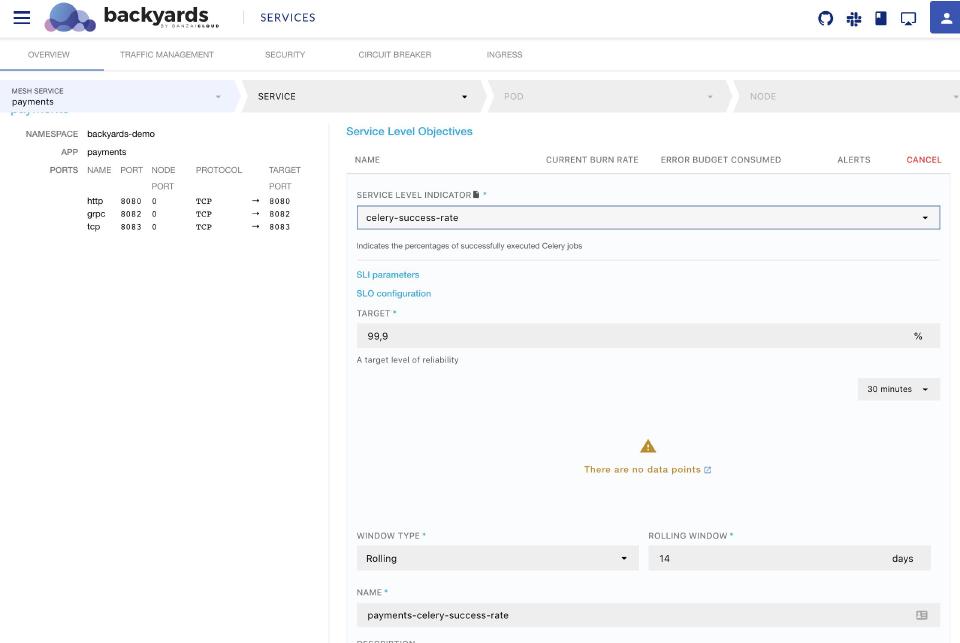
After applying this custom resource, the SLI template becomes available on the Backyards Dashboard:
Given that the metric is only available on Prometheus Operator of the cluster, we will need to ensure that Backyards has access to the metric. But before focusing on that, let’s take a quick detour: usually, there are multiple worker queue services that make up a complex service like this, possibly implemented using different frameworks.
Prometheus recording rules as an abstraction layer 🔗︎
The celery-success-rate SLI template in the previous example is only valid when using Celery. If there are multiple frameworks in use, it’s better to have a unified SLI Template that can be reused between multiple services.
In broad strokes, Prometheus provides a feature called recording rules, which allows for the definition of a set of queries whose results would be saved as a different metric available for later processing.
Based on the previous example of defining a recording rule that would yield the worker_successful_jobs-metric derived from the celery_tasks_total, we’re creating an abstraction on top of celery-exporter. This allows us to create an SLI Template that can be reused for worker engines other than Celery.
This can be accomplished by adding the following recording rule to the mix:
apiVersion: v1/monitoring.coreos.com
kind: PrometheusRule
metadata:
  name: celery-workers
  namespace: prometheus
spec:
 groups:
 - name: celery.rules
   rules:
   - expr: sum(celery_tasks_total{state="SUCCESS"}) by (pod, service, namespace)
     record: worker_successful_jobs
     labels:
       engine: "celery"
   - expr: sum(celery_tasks_total{state~="SUCCESS|FAILURE"}) by (pod, service, namespace)
     record: worker_total_jobs
     labels:
       engine: "celery"
This Prometheus rule results in the worker_total_jobs and worker_successful_jobs metrics, which contain all the Celery-based metrics up to the Pod level. Now we can rewrite the previously shown SLI Template as follows:
apiVersion: sre.banzaicloud.io/v1alpha1
kind: ServiceLevelIndicatorTemplate
metadata:
  name: worker-success-rate
  namespace: payments
spec:
  goodEvents: |
    sum(worker_successful_jobs{service="{{ Service.Name }}", namespace="{{ Service.Namespace }}"})
  totalEvents: |
    sum(worker_total_jobs{service="{{ Service.Name }}", namespace="{{ Service.Namespace }}"})
  kind: availability
  description: |
    Indicates the percentages of successfully executed Celery jobs
  parameters: []
If you’re introducing another worker framework into the system, all of the existing SLI Templates could be reused for those services just by implementing a similar recording rule set. This opens up further possibilities such as unified dashboards for all of the worker services inside a cluster.
Making the data available to Backyards 🔗︎
Backyards comes with its own Prometheus and Thanos deployments (when deployed in Highly Available mode), and the Service Level Objective related functionalities anticipate data that is being made available via our Prometheus deployment.
It might be tempting to rely on Backyards’ Prometheus for storing application-level metrics, but we consider it a best practice to have separate Prometheus instances for storing application-level metrics in production environments. The reason for this is twofold: first of all, it helps isolate domain failures. It is generally accepted that the monitoring system should be the most available part of any infrastructure. And, if the application metrics are overloading Prometheus, the Istio-based alerts will still function, continuing to send alerts while the faulty Prometheus instance is being fixed.
The second reason is tied to Prometheus’ scaling properties: it should be either scaled via sharding (more Prometheus instances scraping different parts of your system), or vertically, by increasing the storage, CPU, and memory resources Prometheus has at its disposal. Vertical scaling might seem tempting given that, when using modern cloud providers, you are the beneficiary of almost infinite elasticity in terms of computing and storage resources. With this approach, however, the issue becomes Prometheus’ startup time: when restarting, it needs to load some segments of its database and also needs to read the Write Ahead Log (which stores two hours of data for better write performance). On ingest-heavy Prometheus instances, this can translate to reading multiple gigabytes of data. To make things worse, Prometheus is not able to scrape or ingest any data during this process, leaving the Kubernetes cluster with only one working Prometheus instance in a Highly Available deployment.
Using Thanos to share metrics between Prometheus instances 🔗︎
In order to implement a sharding setup, we first recommend that you understand Backyards’ monitoring architecture (when deployed in Highly Available mode).
Usually, a Highly Available Prometheus setup’s first implementation is the two Prometheus instances that scrape the same services, each maintaining its own Time Series Database. When alerting, both Prometheus instances (if possible) will fire the alerts towards an Alert Manager and that will deduplicate the alerts before sending them upstream.
The issue (and a bonus from a reliability point of view) with this approach is that those two Prometheus instances do not share a common state. Let’s see what happens if one Prometheus was briefly down (for a few minutes), while the other Prometheus was handling alerting duties. On the surface, everything will work as expected, but that is merely a result of such setups using alerts that look back on the last few minutes to decide system behavior. For example, look at this alert definition:
apiVersion: monitoring.coreos.com/v1
kind: PrometheusRule
metadata:
  name: example
  namespace: backyards-demo
spec:
  groups:
  - name: example_latency_alert
    rules:
    - alert: example-alert
      expr: histogram_quantile(0.9, rate(demo_api_request_duration_seconds_bucket{job="demo"}[5m])) > 0.05
As you can see, the alerting rule depends on the last 5 minutes of data (rate(demo_api_request_duration_seconds_bucket{job="demo"}[5m]). Whenever that amount of time passes and both Prometheus instances have the data available, the alert will return to behaving the same way on both Prometheus instances.
When it comes to SLO-based alerting it is not uncommon to use lookback windows spanning over multiple hours. And for SLO-based decision making, we may need to calculate Service Level Indicators over months in a stable and reliable way. This means that, for the Backyards monitoring architecture, we’ll be relying on Thanos Query to deduplicate and synchronize the state of our Prometheus instances, ensuring this kind of consistent behavior.
As you can see on this architectural diagram, Backyards works in a way such that it always uses the Thanos Query for metric stabilization, and ensures that no data points are missing.
Example: Using data from an external Prometheus 🔗︎
As stated before, the user interface has clearly shown us that Backyards does not receive the data we already exported from the service.
Because Backyards uses Thanos Query to normalize data, in this blog post we will be also utilizing its capability to query multiple Prometheus instances: we will be adding a “stock” Prometheus Operator-managed Prometheus instance as a store for Backyards’ Thanos Query. The benefit of doing this, is that we will not need to store the relevant data in two places, Thanos Query will simply query the data from the correct Prometheus instance.
For the sake of this blog post, we will be showing the process using a fresh installation, and using the kube-prometheus-stack Helm chart. If your system is already running an installation of that chart, the only thing you need to do is set the prometheus.prometheusSpec.thanos.listenLocal=false value for the Helm release. Disabling this setting will allow the Thanos Query of Backyards to access the Thanos Sidecar component on your Prometheus deployment for the query traffic.
To install a new Prometheus stack for experimentation please execute these commands:
kubectl create ns prometheus  # Let's create a namespace for the new Prometheus deployment
kubectl config set-context $(kubectl config current-context) --namespace prometheus # switch to the freshly created namespace
helm repo add prometheus-community https://prometheus-community.github.io/helm-charts
helm install prometheus-stack prometheus-community/kube-prometheus-stack --set 'prometheus.prometheusSpec.thanos.listenLocal=false' # install Prometheus operator with the default settings
For this blog post (as the Prometheus namespace does not have the istio.io/rev label) the Prometheus instance will not be inside the mesh, thus this setup will only work if you are not enforcing MTLS on your cluster.
To verify that this freshly deployed Prometheus instance is working, let’s just quickly check if an alert manager metric is available:
$ k port-forward prometheus-prometheus-stack-kube-prom-prometheus-0 9090 &; PF_PID=$!
$ curl "http://127.0.0.1:9090/api/v1/query?query=alertmanager_alerts" | jq .
{
  "status": "success",
  "data": {
    "resultType": "vector",
    "result": [
      {
        "metric": {
          "__name__": "alertmanager_alerts",
          "endpoint": "web",
          "instance": "10.20.6.186:9093",
          "job": "prometheus-stack-kube-prom-alertmanager",
          "namespace": "prometheus",
          "pod": "alertmanager-prometheus-stack-kube-prom-alertmanager-0",
          "service": "prometheus-stack-kube-prom-alertmanager",
          "state": "suppressed"
        },
        "value": [
          1601391763.841,
          "0"
        ]
      }
    ]
  }
}
$ kill $PF_PID
As you can see, the job prometheus-stack-kube-prom-alertmanager has already provided one data point for the alertmanager being installed in the prometheus namespace.
The final step is to ensure that Backyards is able to utilize this Prometheus instance as a data source by changing Backyards’ controlplane configuration resource:
$ cat > controlPlanePatch.yaml <<EOF
spec:
  backyards:
    prometheus:
      thanos:
        query:
         additionalStores:
         - prometheus-prometheus-stack-kube-prom-prometheus-0.prometheus-operated.prometheus.svc.cluster.local:10901
EOF
$ kubectl patch controlplane backyards -p "$(cat controlPlanePatch.yaml)" --type=merge
After the patch has been applied, the backyards CLI should be invoked to update the altered Kubernetes resources:
$ backyards operator reconcile
After the reconciliation is done you should be able to query the same metric from backyards using this command (assuming your backyards dashboard command is running):
$ curl "http://127.0.0.1:50500/prometheus/api/v1/query?query=alertmanager_alerts" | jq .
{
  "status": "success",
  "data": {
    "resultType": "vector",
    "result": [
      {
        "metric": {
          "__name__": "alertmanager_alerts",
          "endpoint": "web",
          "instance": "10.20.6.186:9093",
          "job": "prometheus-stack-kube-prom-alertmanager",
          "namespace": "prometheus",
          "pod": "alertmanager-prometheus-stack-kube-prom-alertmanager-0",
          "service": "prometheus-stack-kube-prom-alertmanager",
          "state": "suppressed"
        },
        "value": [
          1601391763.841,
          "0"
        ]
      }
    ]
  }
}
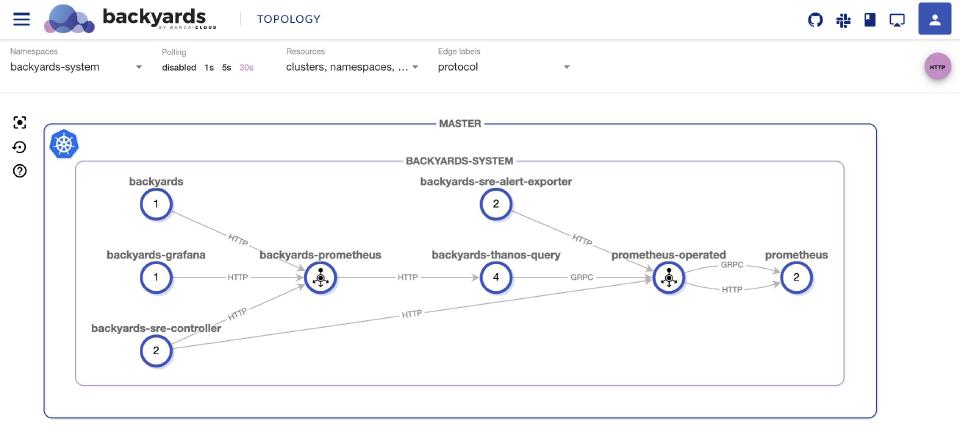
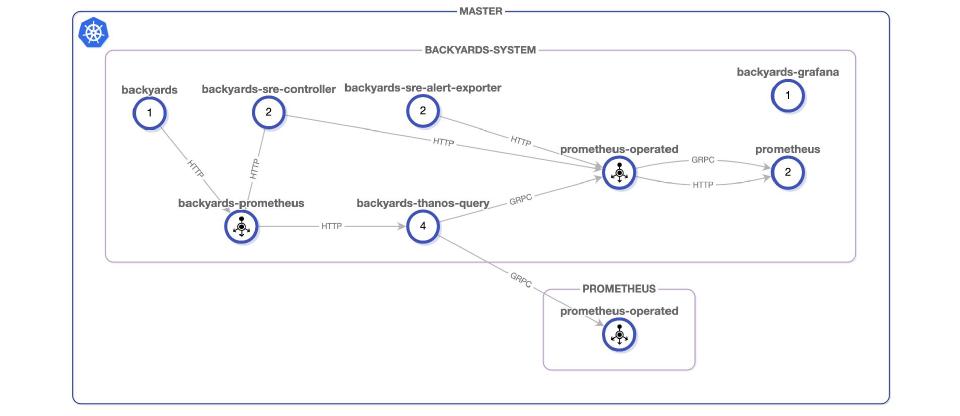
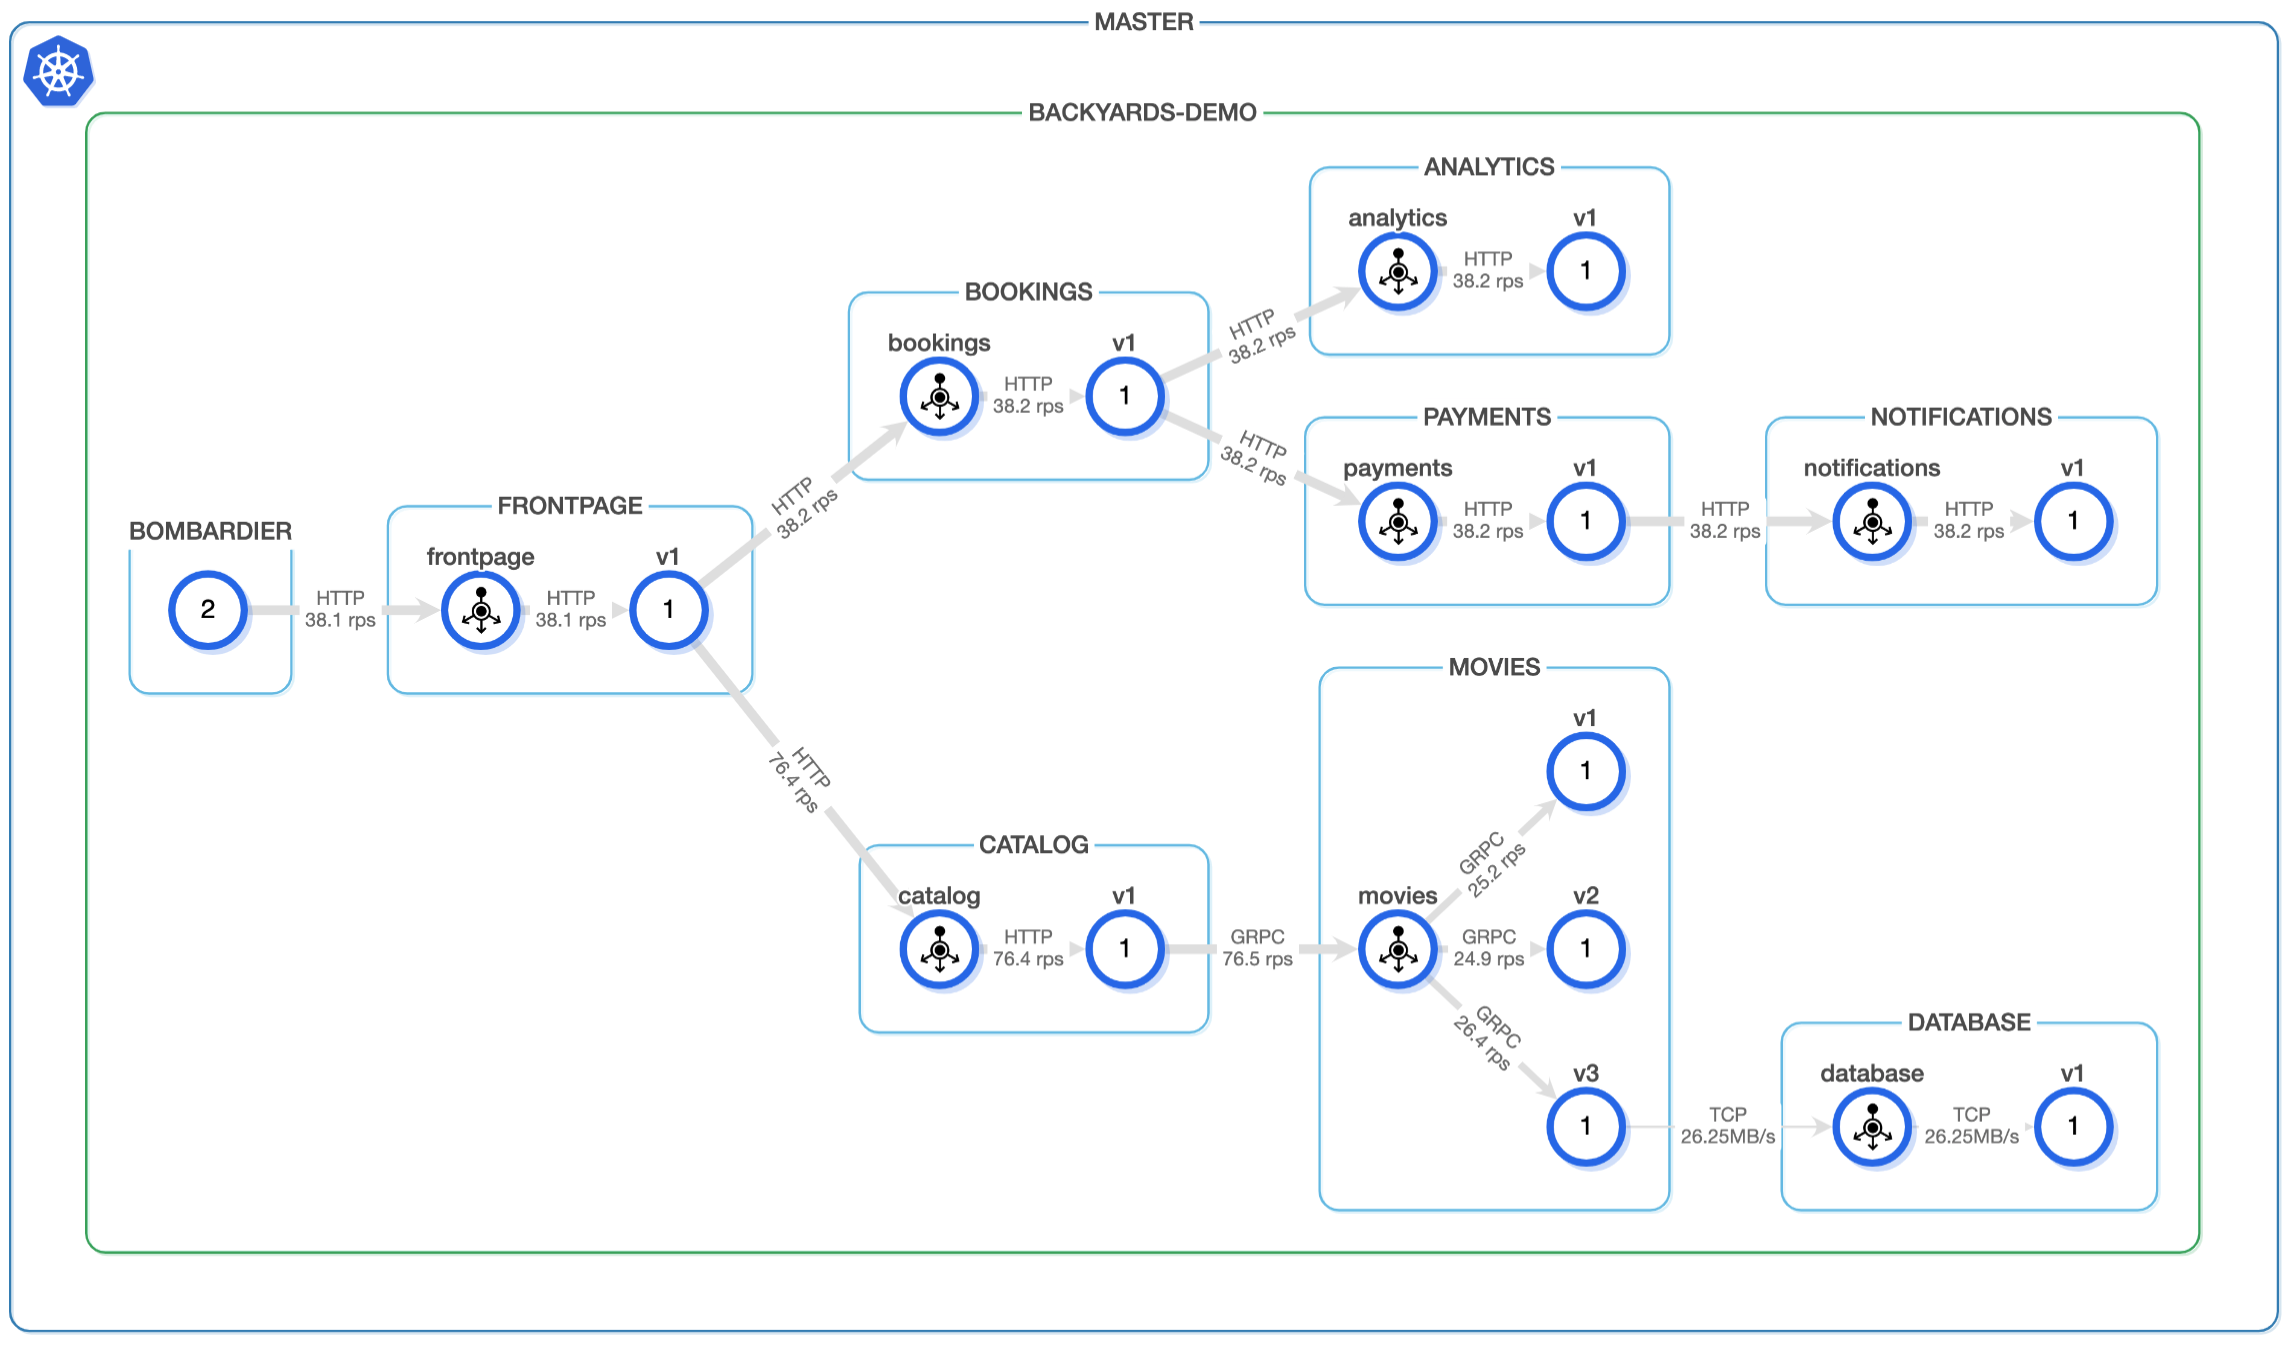
You can also verify that the connectivity is working by examining the topology view in Backyards’ dashboard:
Conclusion 🔗︎
As shown above, the Service Level Objective feature of Backyards not only provides out-of-the-box support for Istio-based alerts, but, when implemented properly, can serve as the backbone of any SLO-based monitoring effort, and does this in such a way as to enforce best practices on Prometheus itself.
For easier adaption, it can easily interface with your existing monitoring solution, and provides a flexible framework for defining custom Service Level Indicators tailored to your application.
About Backyards 🔗︎
Banzai Cloud’s Backyards (now Cisco Service Mesh Manager) is a multi and hybrid-cloud enabled service mesh platform for constructing modern applications. Built on Kubernetes, our Istio operator and the Banzai Cloud Pipeline platform gives you flexibility, portability, and consistency across on-premise datacenters and on five cloud environments. Use our simple, yet extremely powerful UI and CLI, and experience automated canary releases, traffic shifting, routing, secure service communication, in-depth observability and more, for yourself.


