


One of the Istio service mesh’s most popular and robust features is its advanced observability. Because all service-to-service communication is routed through Envoy proxies, and Istio’s control plane is able to gather logs and metrics from these proxies, the service mesh can provide us with deep insights about the state of the network and the behavior of services. This provides operators with unique ways of troubleshooting, managing, and optimizing their services, without imposing any additional burdens on application developers.
Operators thus gain a deep understanding of how monitored services interact in both inbound and outbound directions. These metrics provide a diverse array of information, including overall volume of traffic, error rates and the response times for requests.
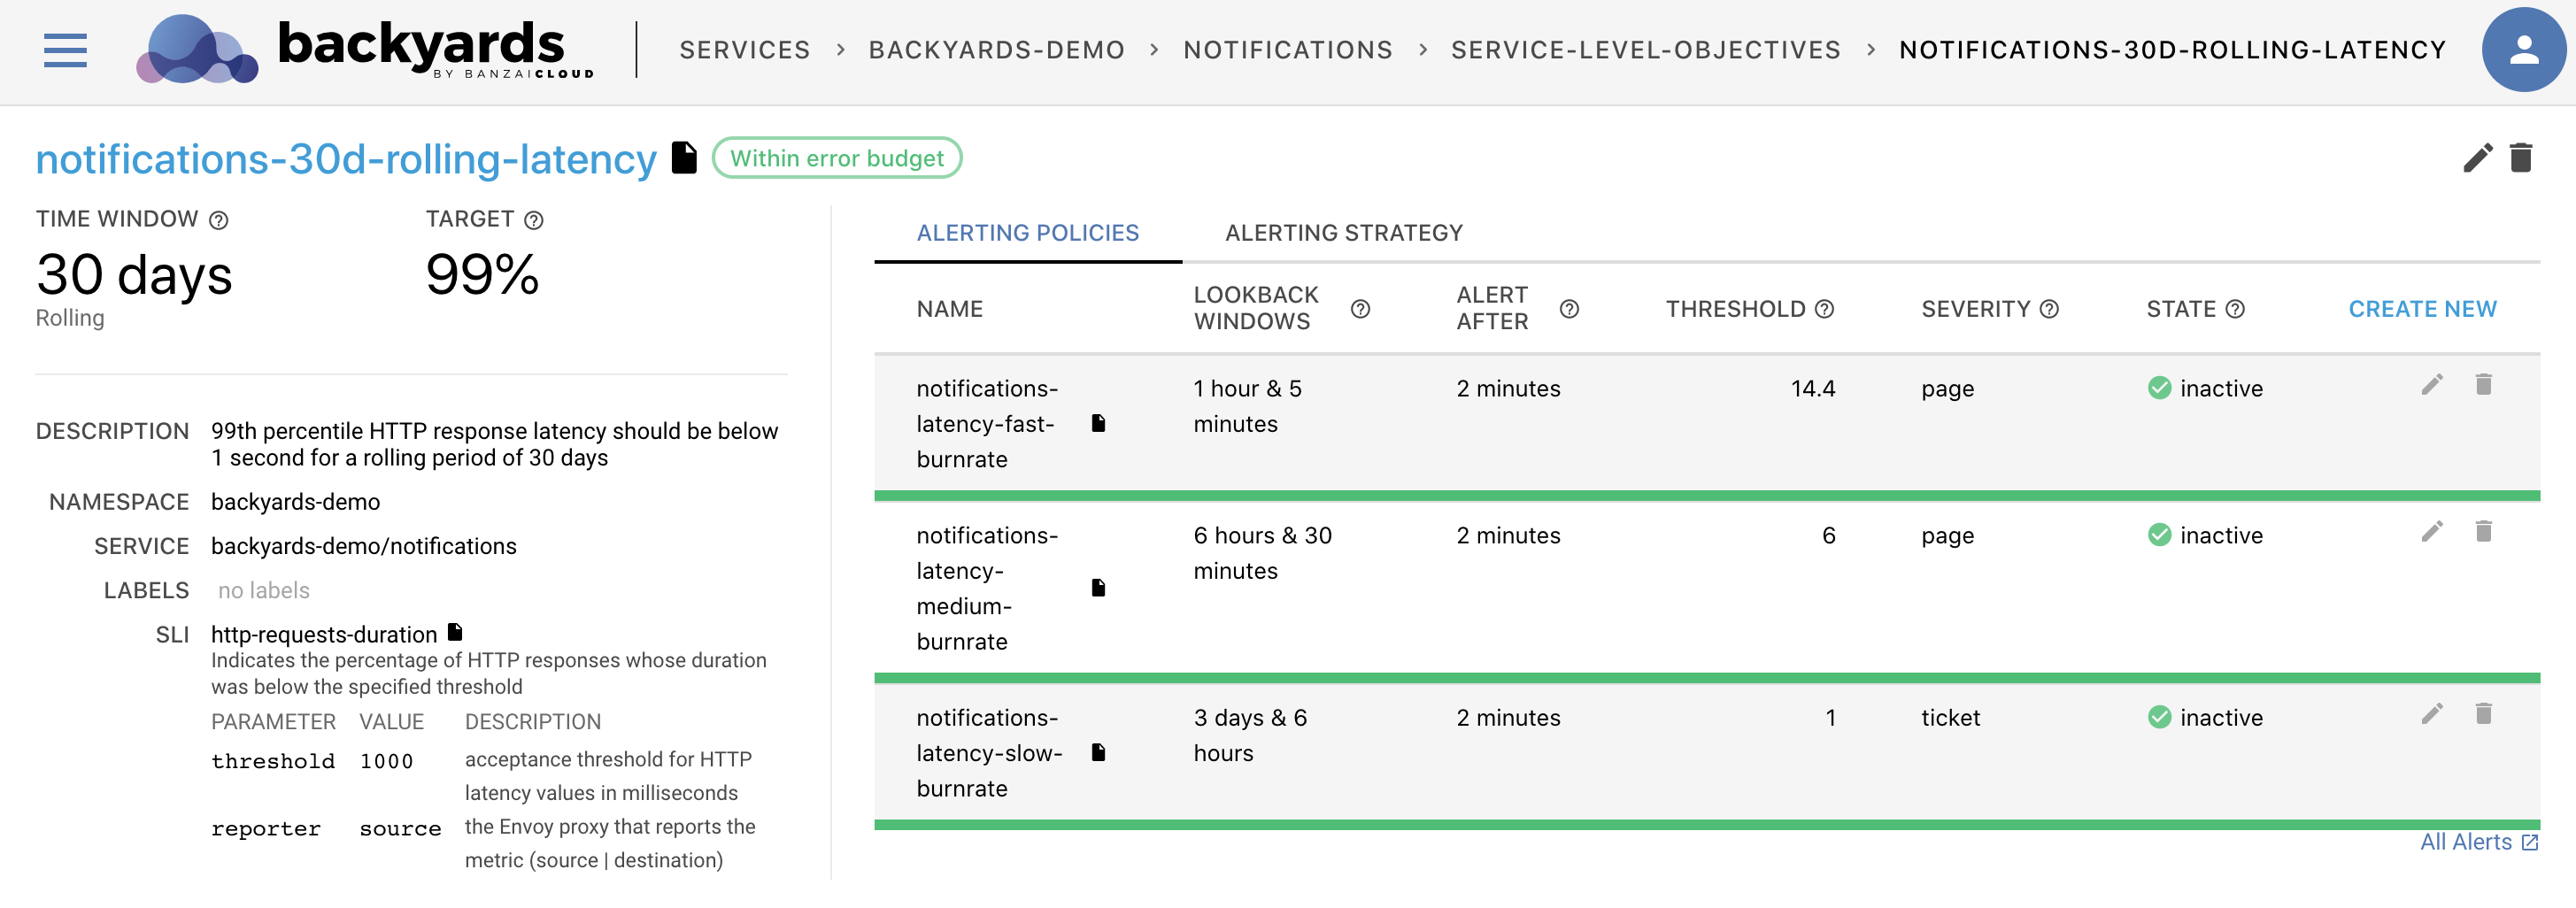
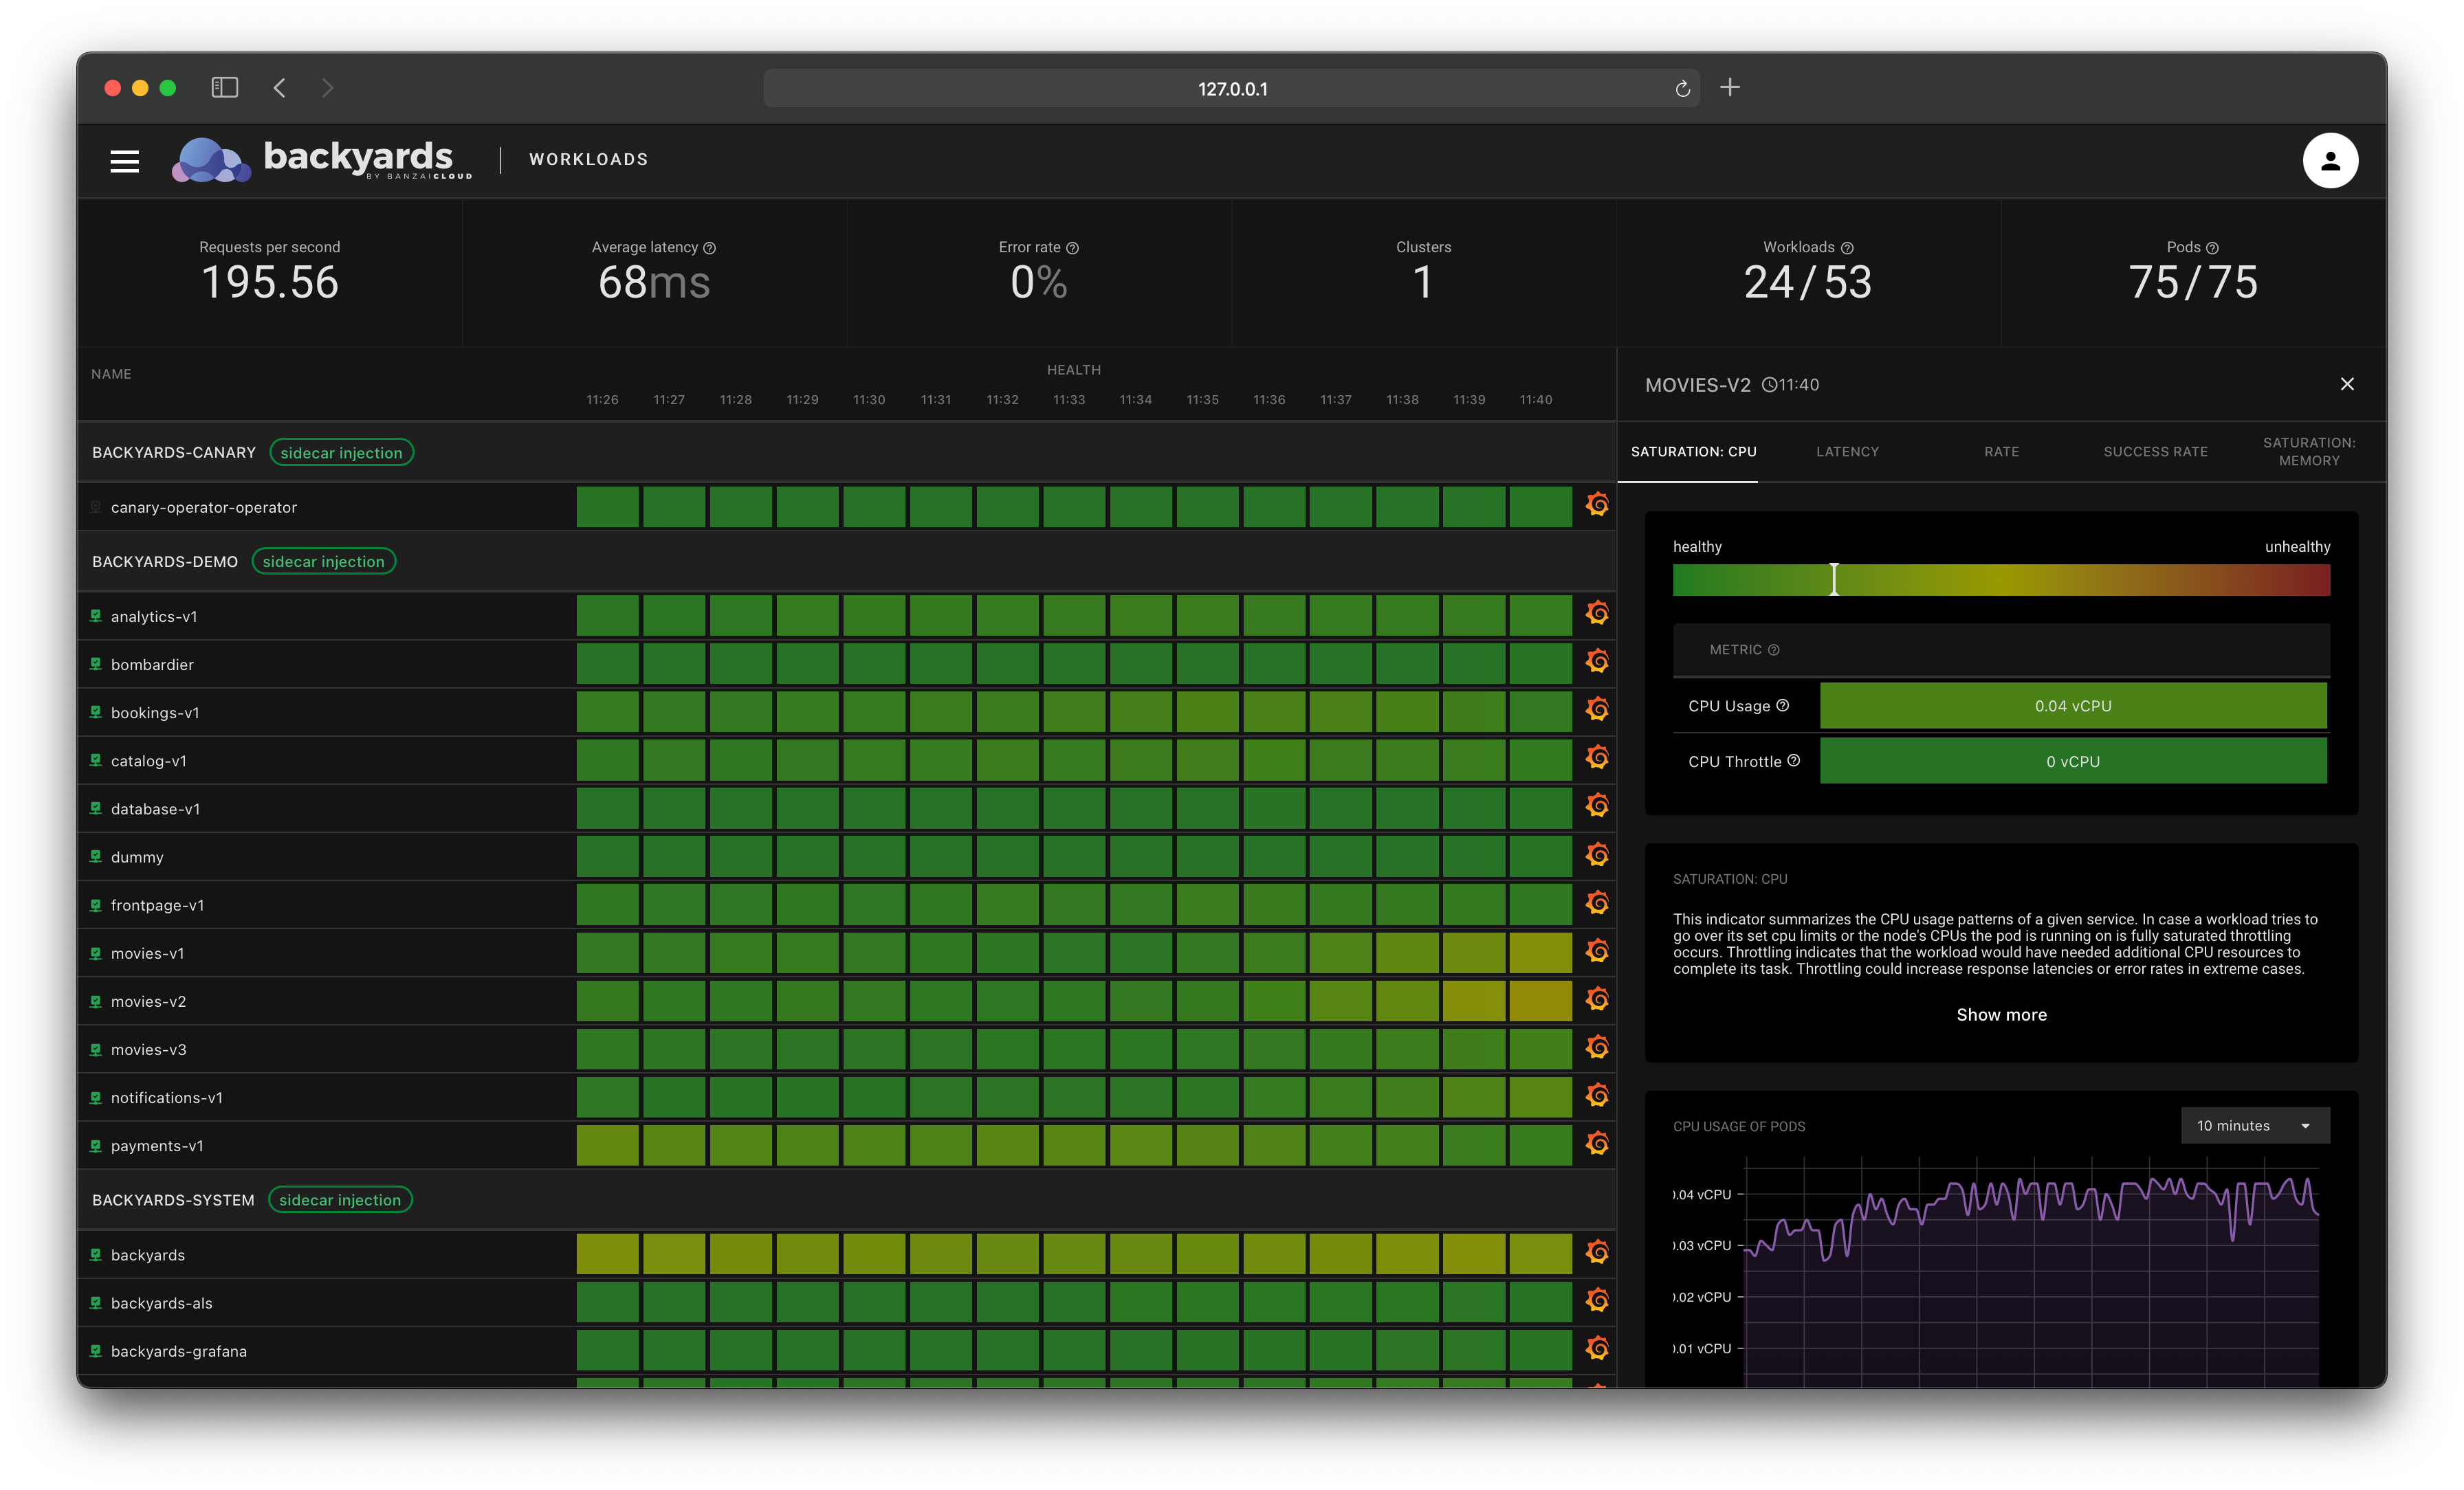
We see the service mesh as a key component of every modern Cloud Native stack. To make this a reality, we are on a mission to make Istio simple to use and manage for everyone. We have built a product called Backyards (now Cisco Service Mesh Manager), the Banzai Cloud operationalized and automated service mesh, which makes setting up and operating an Istio-based mesh a cinch. Backyards provides unmatched out of the box observability and an extensive set of tooling such as:
Quick recap of Istio telemetry metrics 🔗︎
Proxy-level metrics 🔗︎
Proxy-level metrics are standard metrics provided by the Envoy proxy itself about all pass-through traffic, as well as detailed statistics about the administrative functions of the proxy, including configuration and health information.
Envoy-generated metrics exist at the granularity level of Envoy resources (such as listeners and clusters).
Example proxy-level Metrics 🔗︎
# TYPE envoy_cluster_internal_upstream_rq_200 counter
envoy_cluster_internal_upstream_rq_200{cluster_name="xds-grpc"} 2

# TYPE envoy_cluster_upstream_rq_200 counter
envoy_cluster_upstream_rq_200{cluster_name="xds-grpc"} 2

# TYPE envoy_cluster_upstream_rq_completed counter
envoy_cluster_upstream_rq_completed{cluster_name="xds-grpc"} 3

# TYPE envoy_cluster_internal_upstream_rq_503 counter
envoy_cluster_internal_upstream_rq_503{cluster_name="xds-grpc"} 1

# TYPE envoy_cluster_upstream_cx_rx_bytes_total counter
envoy_cluster_upstream_cx_rx_bytes_total{cluster_name="xds-grpc"} 2056154

# TYPE envoy_server_memory_allocated gauge
envoy_server_memory_allocated{} 15853480
Service-level metrics 🔗︎
In addition to the proxy-level metrics, Istio provides a set of service-oriented metrics for monitoring service communications. These metrics cover the four basic service monitoring needs: latency, traffic, errors, and saturation.
Istio ships with a default set of dashboards for monitoring service behaviors based on these metrics.
Example service-level metric 🔗︎
# TYPE istio_requests_total counter
istio_requests_total{
    connection_security_policy="mutual_tls",
    destination_app="analytics",
    destination_principal="cluster.local/ns/backyards-demo/sa/default",
    destination_service="analytics.backyards-demo.svc.cluster.local",
    destination_service_name="analytics",
    destination_service_namespace="backyards-demo",
    destination_version="v1",
    destination_workload="analytics-v1",
    destination_workload_namespace="backyards-demo",
    permissive_response_code="none",
    permissive_response_policyid="none",
    reporter="destination",
    request_protocol="http",
    response_code="200",
    response_flags="-",
    source_app="bookings",
    source_principal="cluster.local/ns/backyards-demo/sa/default",
    source_version="v1",
    source_workload="bookings-v1",
    source_workload_namespace="backyards-demo"
} 1855
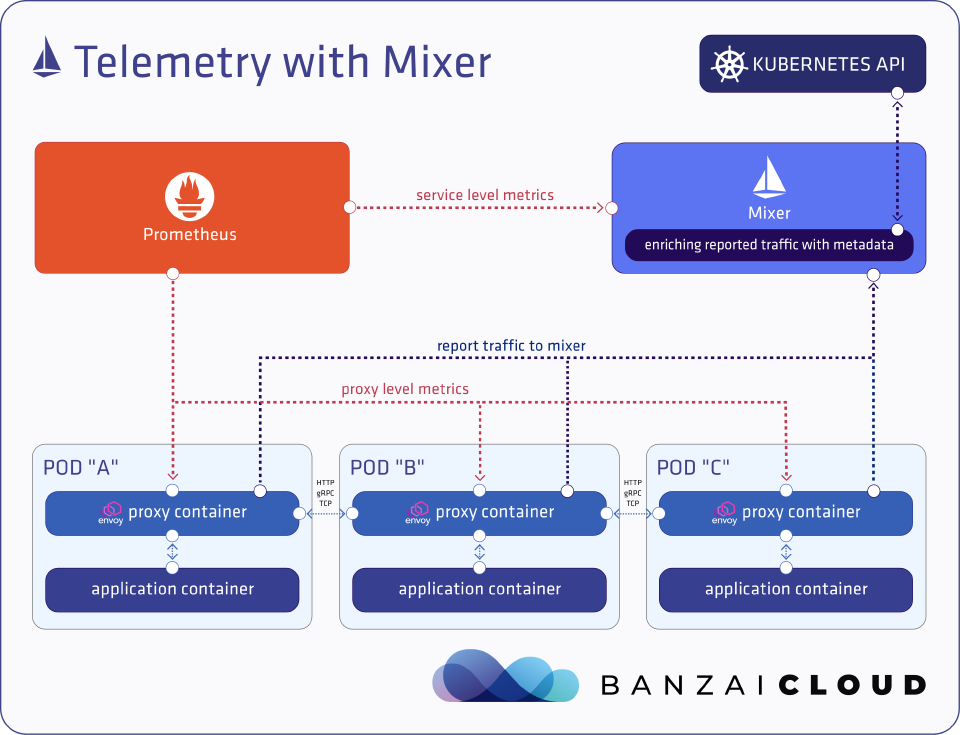
Istio telemetry with Mixer 🔗︎
Up until Istio 1.4, Istio’s service-level metrics were provided by a central component called Mixer.

If you’re a history buff, you might enjoy taking a look at our detailed blog post, Istio telemetry with Mixer.
The Envoy sidecars call Mixer after each request to report telemetry, and Mixer provides a Prometheus metrics endpoint to expose collected metrics, thus making them available for scraping. The proxies send data about the source and destination side of the request, most importantly the unique ID of the source and destination workloads (essentially a unique Pod ID in a K8s environment) to Mixer in each report, and it is the responsibility of Mixer to get additional metadata from K8s and expose the metrics on a specific endpoint for Prometheus to scrape.
Although the Envoy sidecars buffer the outgoing telemetry requests, that architecture generated significant resource consumptions in larger environments. An active connection was necessary between every proxy and Mixer. That obviously caused higher CPU and memory consumption in the proxies, and subsequently caused higher latencies as well.
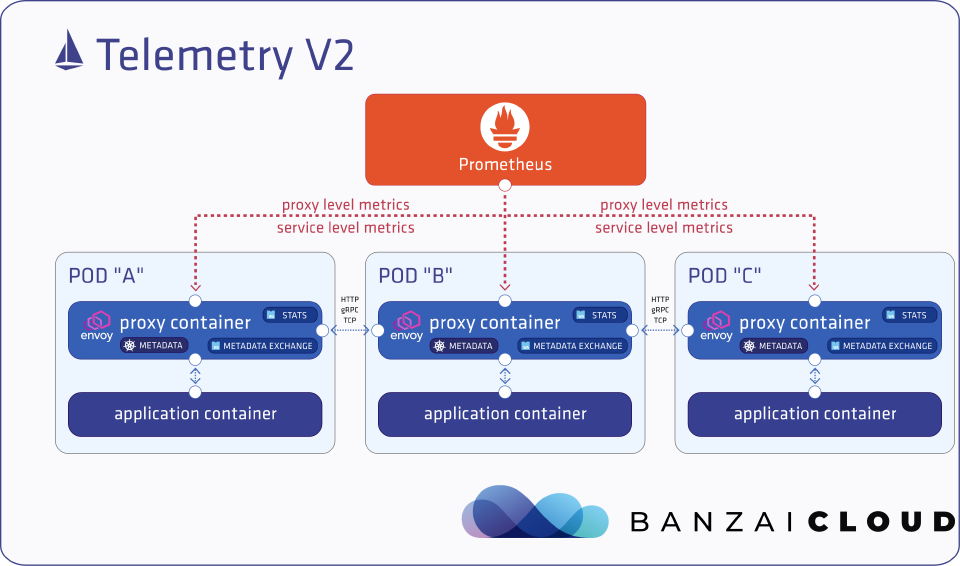
Istio telemetry V2 🔗︎
In an effort to reduce the resource consumption of the proxies and – just as importantly – lower the added latencies, the telemetry feature was rearchitected from the ground up. It was pivoted away from active toward passive metrics collection with a much smaller CPU footprint.
Older Envoy releases were not easily extended, and adding an extension to Envoy required a monolithic build process, and extensions to be written in C++. The binary needed to be deployed, needed rolling updates, etc, and the overall process was hard to manage. Nevertheless, the Mixer-based implementation was still supported via a custom built Envoy which had all the necessary features baked in.
Because Istio Telemetry V2 lacks a central component (Mixer) with access to K8s metadata, the proxies themselves require the metadata necessary to provide rich metrics. Additionally, features provided by Mixer had to be added to the Envoy proxies to replace the Mixer-based telemetry. Istio Telemetry V2 uses two custom Envoy plugins to achieve just that.

According to the Istio documentation, the new telemetry system cuts latency in half - 90th percentile latency has been reduced from 7ms to 3.3 ms. Not only that, but the elimination of Mixer has reduced total CPU consumption by 50% to 0.55 vCPUs per 1,000 requests per second.
WASM to the rescue 🔗︎
WebAssembly (often shortened to WASM) is an open standard that defines a portable binary-code format for executable programs, and a corresponding textual assembly language, as well as interfaces that facilitate interactions between programs and their host environment.
The main goal of WebAssembly is to enable high-performance applications on web pages, but the format is also designed to be executed and integrated in other environments. It provides a lean stack-based virtual machine that allows web applications to run at near-native speed by utilizing a fast-loading binary format which can also be converted into a text format for debugging. And, while WebAssembly started life as a client-side technology, there are a number of advantages to using it on the server side.
The Istio community has been leading the implementation of a WebAssembly (WASM) runtime for Envoy. The implementation uses a WebAssembly runtime built on Google’s high performance V8 engine.
With WebAssembly plugins for Envoy, developers can write their custom code, compile it to WebAssembly plugins, and configure Envoy to execute it. These plugins can hold arbitrary logic (it’s simple code!), so they’re useful for all kinds of message integrations and mutations.
In another post we’ll write more about Envoy WASM plugins in general, and how we use this new extensibility option in Supertubes to provide mTLS based RBAC for Kafka with Istio.
In-proxy service-level metrics in Telemetry V2 are provided by two custom plugins, metadata-exchange and stats.
By default, in Istio 1.5, Telemetry V2 is enabled as compiled in Istio proxy filters, mainly for performance reasons. The same filters are also compiled to WebAssembly (WASM) modules and shipped with Istio proxy. Performance will be continuously improved in forthcoming releases.
Metadata exchange plugin 🔗︎
The first problem that had to be solved was how to make client/server metadata about the two sides of a connection available in the proxies.
For HTTP-based traffic this is accomplished via custom HTTP headers (envoy.wasm.metadata_exchange.upstream, envoy.wasm.metadata_exchange.downstream) in the request/response that contains the metadata attributes of the other side.
For generic TCP traffic the metadata exchange uses ALPN-based tunneling and a prefix based protocol. A new protocol istio-peer-exchange is defined, which is advertised and prioritized by the client and the server sidecars in the mesh. ALPN negotiation resolves the protocol to istio-peer-exchange for connections between Istio enabled proxies, but not between an Istio enabled proxy and any client.
Stats plugin 🔗︎
The stats plugin records incoming and outgoing traffic metrics into the Envoy statistics subsystem and makes them available for Prometheus to scrape.
The following are the standard service level metrics exported by default.
For HTTP, HTTP/2, and GRPC traffic the proxy generates the following metrics
| Name | Description |
|---|---|
| istio_requests_total | This is a COUNTER incremented for every request handled by an Istio proxy. |
| istio_request_duration_milliseconds | This is a DISTRIBUTION which measures the duration of requests. |
| istio_request_bytes | This is a DISTRIBUTION which measures HTTP request body sizes. |
| istio_response_bytes | This is a DISTRIBUTION which measures HTTP response body sizes. |
For TCP traffic the proxy generates the following metrics
| Name | Description |
|---|---|
| istio_tcp_sent_bytes_total | This is a COUNTER which measures the size of total bytes sent during response in case of a TCP connection. |
| istio_tcp_received_bytes_total | This is a COUNTER which measures the size of total bytes received during request in case of a TCP connection. |
| istio_tcp_connections_opened_total | This is a COUNTER incremented for every opened connection. |
| istio_tcp_connections_closed_total | This is a COUNTER incremented for every closed connection. |
The following are the default labels on service level metrics.
reporter: conditional((context.reporter.kind | "inbound") == "outbound", "source", "destination")
source_workload: source.workload.name | "unknown"
source_workload_namespace: source.workload.namespace | "unknown"
source_principal: source.principal | "unknown"
source_app: source.labels["app"] | "unknown"
source_version: source.labels["version"] | "unknown"
destination_workload: destination.workload.name | "unknown"
destination_workload_namespace: destination.workload.namespace | "unknown"
destination_principal: destination.principal | "unknown"
destination_app: destination.labels["app"] | "unknown"
destination_version: destination.labels["version"] | "unknown"
destination_service: destination.service.host | "unknown"
destination_service_name: destination.service.name | "unknown"
destination_service_namespace: destination.service.namespace | "unknown"
request_protocol: api.protocol | context.protocol | "unknown"
response_code: response.code | 200
connection_security_policy: conditional((context.reporter.kind | "inbound") == "outbound", "unknown", conditional(connection.mtls | false, "mutual_tls", "none"))
response_flags: context.proxy_error_code | "-"
source_canonical_service
source_canonical_revision
destination_canonical_service
destination_canonical_revision
You can find more info about the labels in Istio docs
The stats plugin in Istio 1.5 not only includes standard metrics, but experimental support for modifying them. Be aware that the API to configure the metrics will be changed in Istio 1.6, due to the new extensions API design.
Feature gaps between Mixer-based telemetry and Telemetry V2 🔗︎
Although Mixer has been deprecated with the 1.5 release; it is a highly configurable component and provides a lot of features. There are significant feature gaps between the telemetry provided by Mixer and what V2 provides today.
- Out of mesh telemetry is not fully supported: some metrics are missing (the traffic source or destination is not injected by the sidecar).
- Egress gateway telemetry is not supported.
- TCP telemetry is only supported with mTLS.
- Black Hole telemetry for TCP and HTTP protocols is not supported.
- Histogram buckets are significantly different from the ones based on Mixer.
- Custom metrics support is experimental and limited.
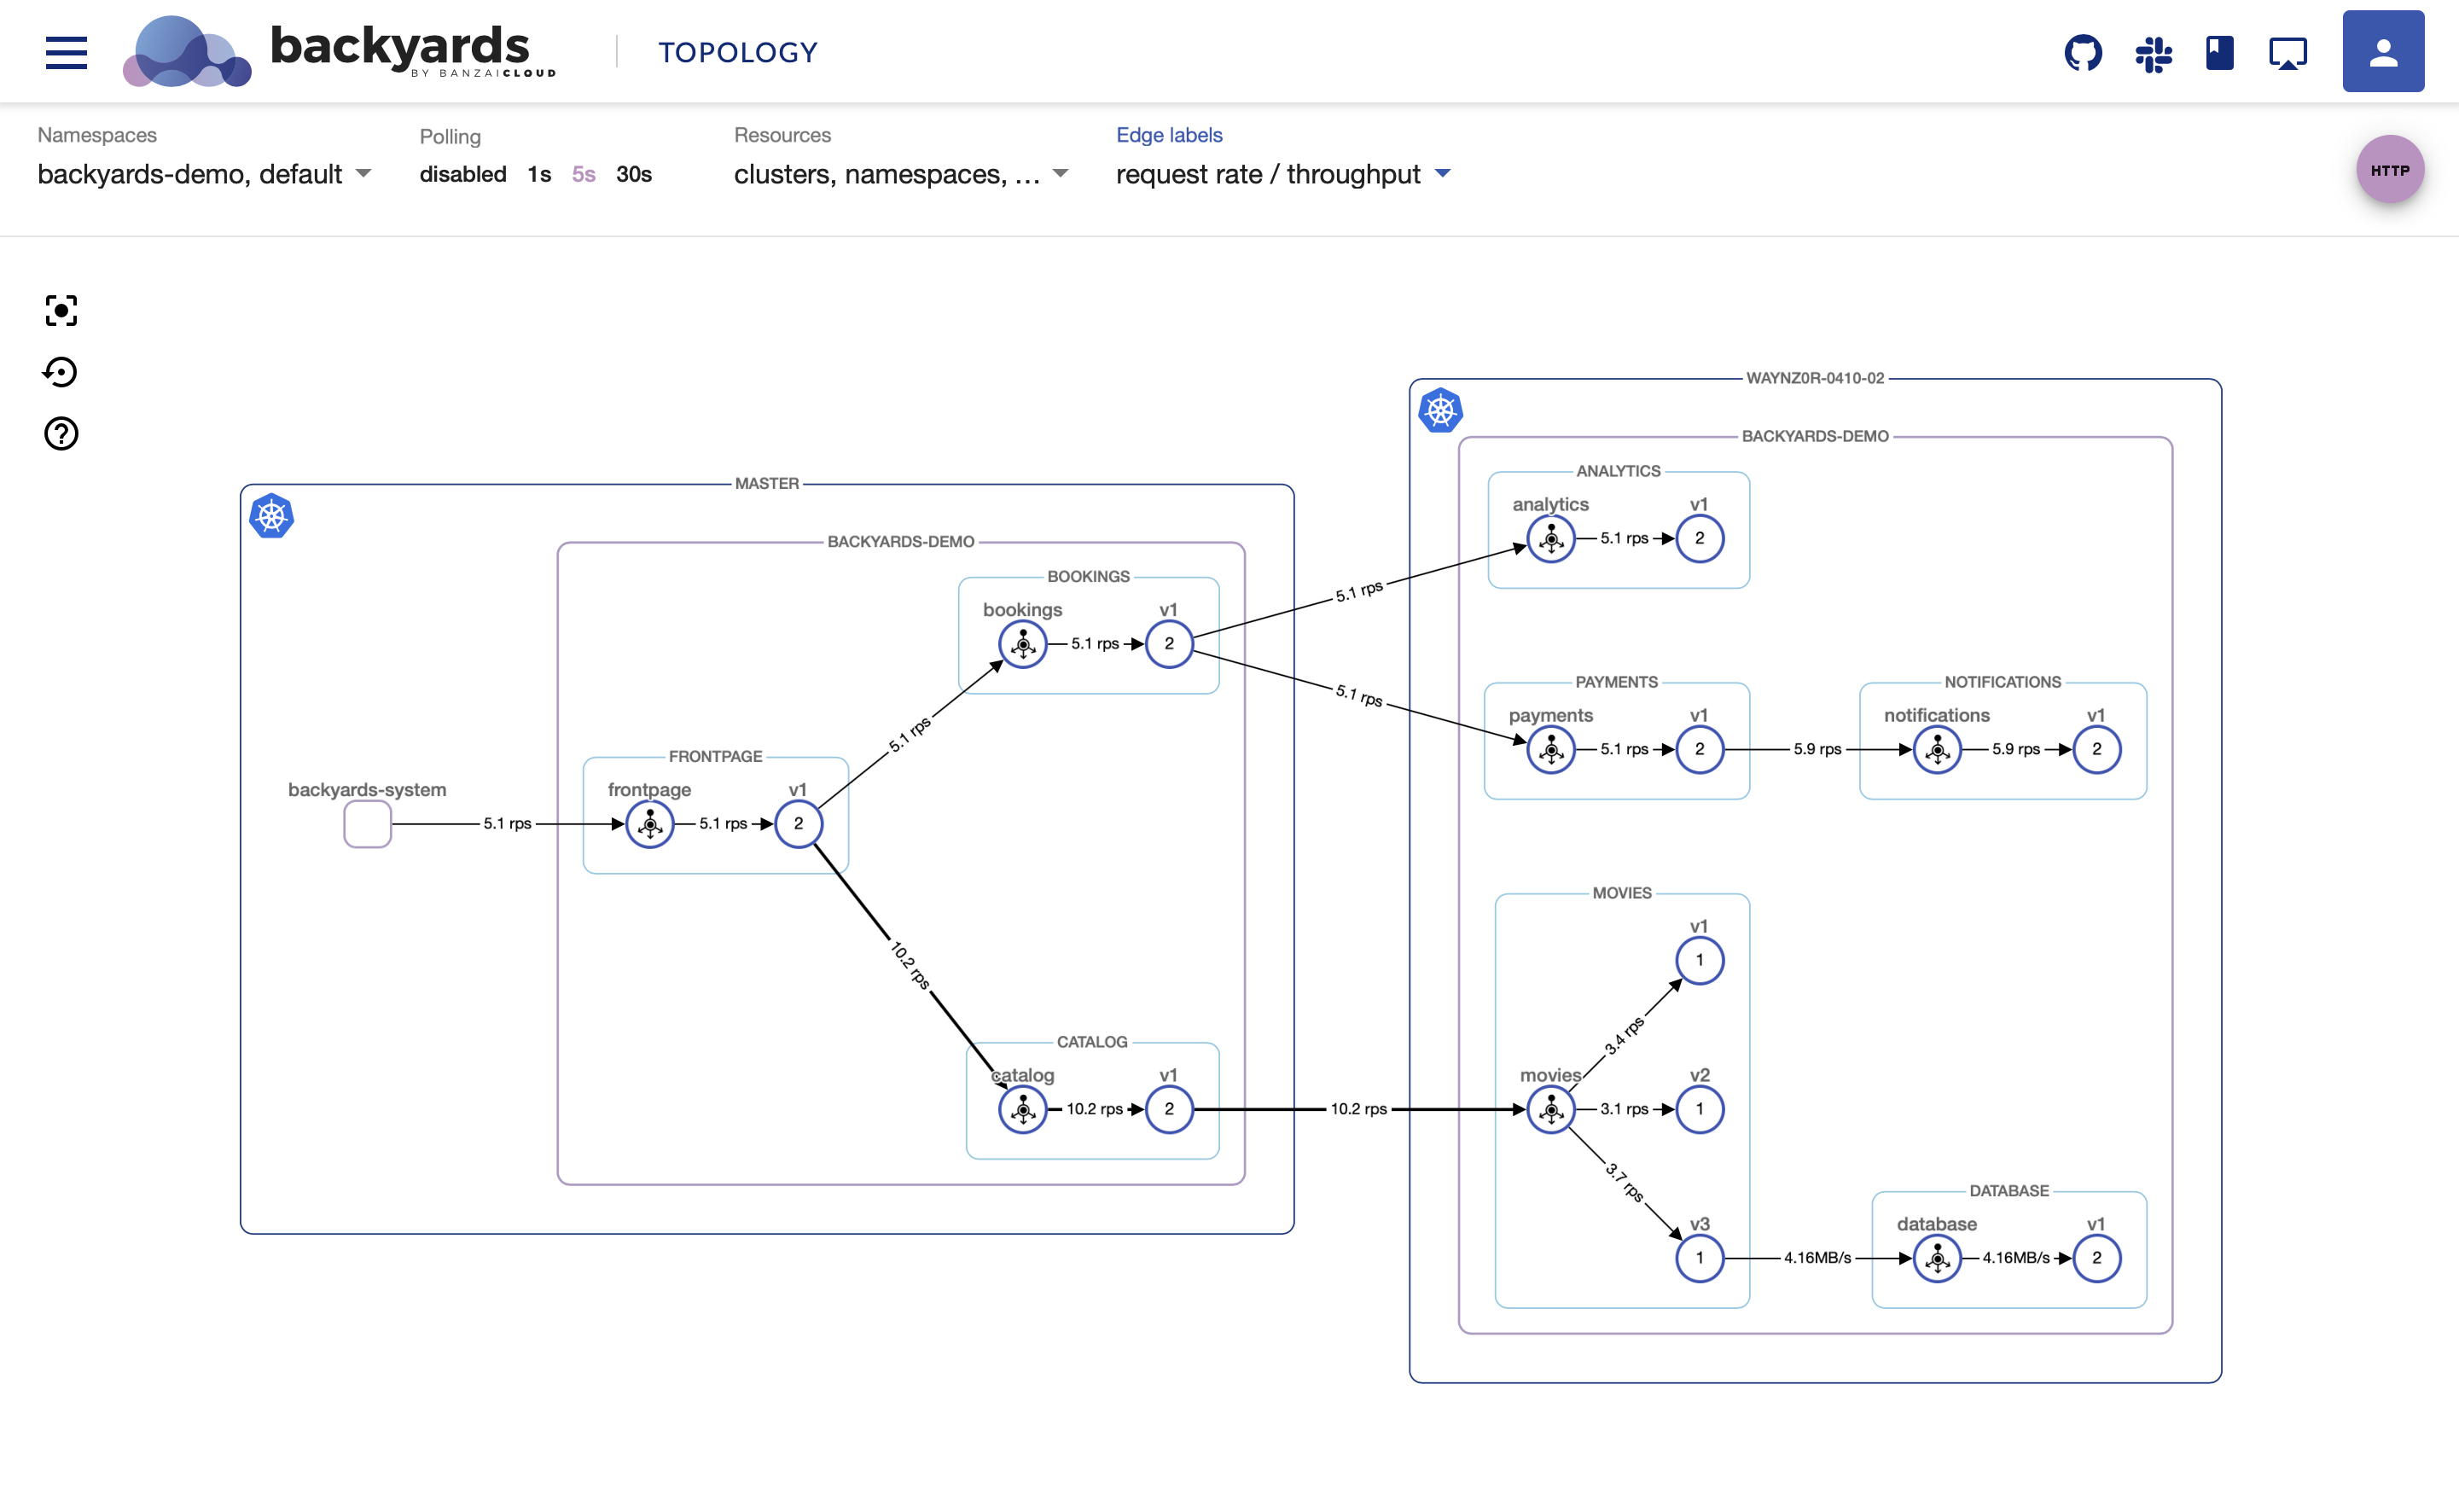
Telemetry V2 in a multi-cluster environment with Backyards 🔗︎
Backyards (now Cisco Service Mesh Manager) is Banzai Cloud’s automated and operationalized service mesh product built on Istio. It comes with Istio 1.5 and supports Telemetry V2 in a multi-cluster environment as well.
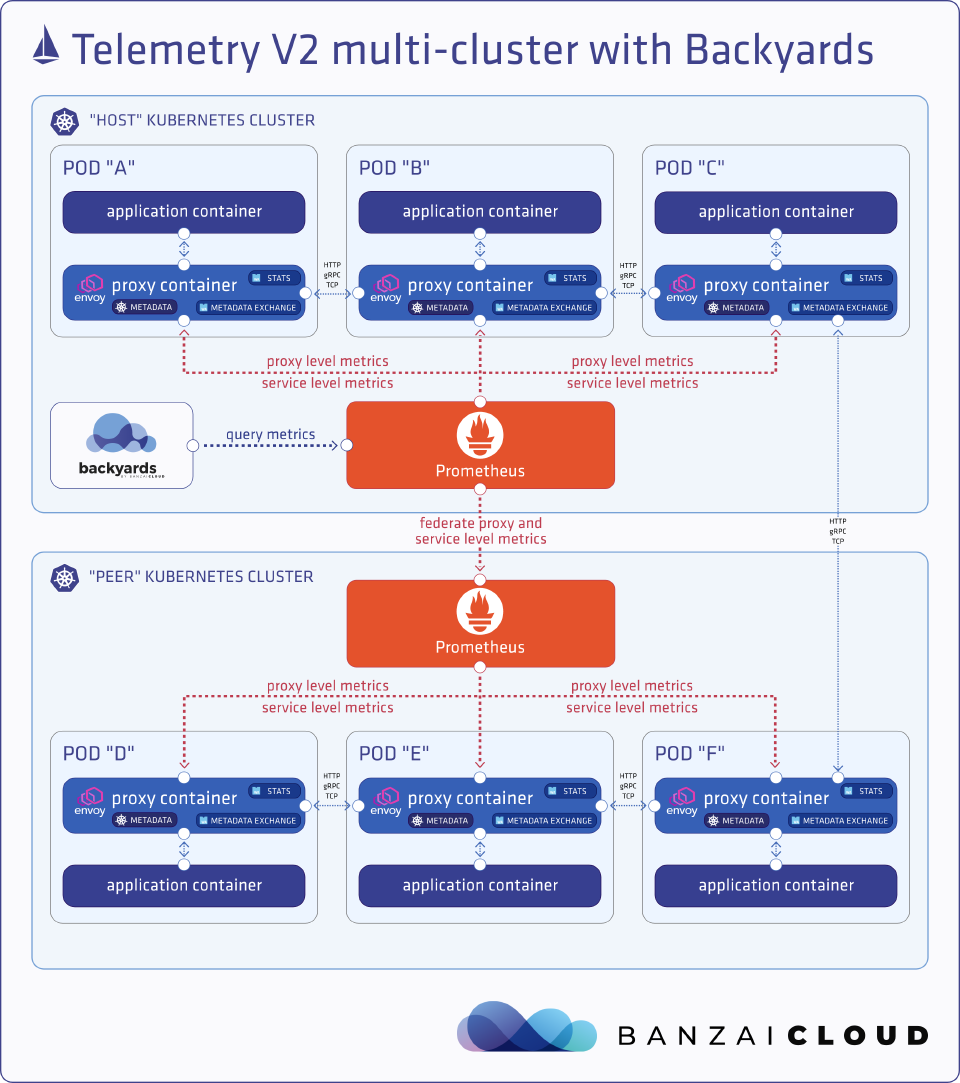

Some of the observability features of Backyards (now Cisco Service Mesh Manager) are largely based on the telemetry information provided by Istio.
Telemetry V2 completely changed how single mesh multi cluster setups work. Without a central telemetry component, it’s now up to the end user to federate all the metrics into a single location. Luckily, Backyards (now Cisco Service Mesh Manager) solves that by automatically setting up Prometheus federation between clusters in the same mesh. It’s also important to note that Telemetry V2 completely lacks cluster information, so normally you wouldn’t be able to differentiate metrics across clusters. Similarly, Backyards (now Cisco Service Mesh Manager) has gotten around this with Envoy extensions.
Mixer-based telemetry also lacks cluster information, which is why Backyards (now Cisco Service Mesh Manager) always had its own Istio distribution. As mentioned earlier, there aren’t really any ways of extending the metrics Telemetry V2 provides, but with Backyards (now Cisco Service Mesh Manager) we can pre-configure proxies to hold cluster information in their node metadata, which is then propagated to metrics.
The following metrics are generated for traffic between the catalog service on cluster host and the movies service on cluster peer. Notice the source_cluster_id and destination_cluster_id labels.
istio_requests_total{
    connection_security_policy="mutual_tls",
    destination_app="movies",
    destination_canonical_revision="v2",
    destination_canonical_service="movies",
    destination_cluster_id="peer",
    destination_principal="spiffe://cluster.local/ns/backyards-demo/sa/default",
    destination_service="movies.backyards-demo.svc.cluster.local",
    destination_service_name="movies",
    destination_service_namespace="backyards-demo",
    destination_version="v2",
    destination_workload="movies-v2",
    destination_workload_namespace="backyards-demo",
    grpc_response_status="0",
    instance="10.20.1.222:15090",
    job="envoy-stats",
    namespace="backyards-demo",
    pod_name="movies-v2-85bdf95c7d-89klz",
    pod_template_hash="85bdf95c7d",
    reporter="destination",
    request_protocol="grpc",
    response_code="200",
    response_flags="-",
    security_istio_io_tlsMode="istio",
    service_istio_io_canonical_name="movies",
    service_istio_io_canonical_revision="v2",
    source_app="catalog",
    source_canonical_revision="v1",
    source_canonical_service="catalog",
    source_cluster_id="host",
    source_principal="spiffe://cluster.local/ns/backyards-demo/sa/default",
    source_version="v1",
    source_workload="catalog-v1",
    source_workload_namespace="backyards-demo",
    version="v2"
} 279
Those additions are essential for Backyards to be able to provide multi-cluster service graphs like this:


Check out how easy is to set up a multi-cluster service mesh with Backyards or read more about the latest Backyards release here.
Check out Backyards in action on your own clusters!
Want to know more? Get in touch with us, or delve into the details of the latest release.
Or just take a look at some of the Istio features that Backyards automates and simplifies for you, and which we’ve already blogged about.
Check out Backyards’ observability in action: