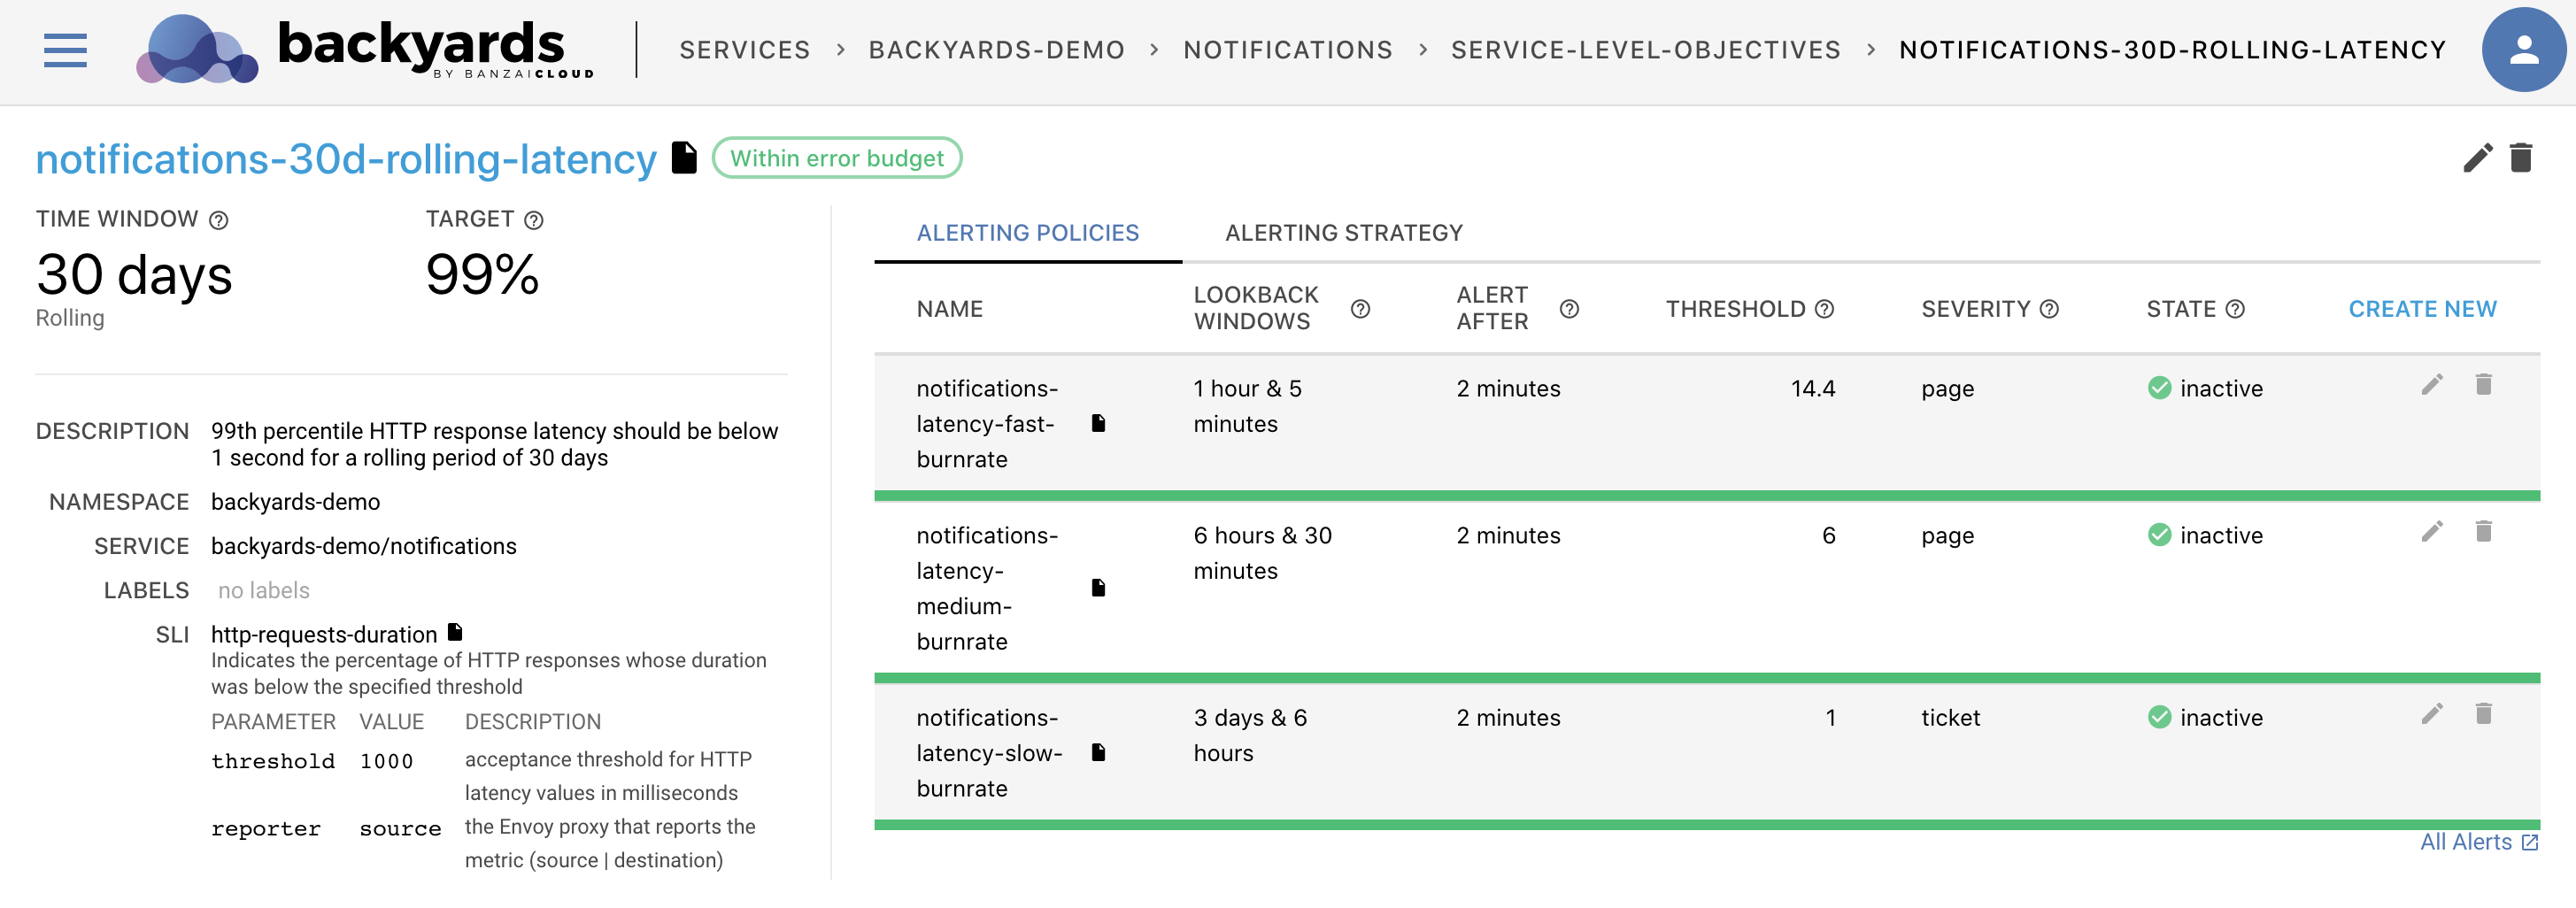
We’ve already covered the details of SLO-based alerting for Request Latency (Duration) and Request Error Rate in our previous blog posts. However, if we take a look at Google’s Site Reliability Engineering book, we’ll see that it mentions four golden signals to be used as the basis of any system’s alerting strategy:
- Latency (or Duration): The time it takes to service a request.
- Errors: The rate of requests that fail, either explicitly (e.g., HTTP 500s), implicitly (for example, an HTTP 200 success response, but coupled with the wrong content).
- Traffic (or Rate): A measure of how much demand is being placed on your system, measured in a high-level system-specific metric. For a web service, this measurement is usually HTTP requests per second.
- Saturation: How “full” your service is. A measure of your system fraction, emphasizing the resources that are most constrained (e.g., in a memory-constrained system, show memory; in an I/O-constrained system, show I/O)
In this blog post, we’re going to discuss how to implement traffic (or Rate) monitoring. For simplicity’s sake, we’ll be relying on Backyards, our enterprise-grade Istio distribution, as it provides a pre-integrated Prometheus-based monitoring solution for the Istio service mesh it deploys.
It also allows you to try out the examples we’ll be using, on your computer or cluster. To do so, please check out Backyards’ Quick Start Guide or the blog post on Getting started with Istio using Backyards.
Environment 🔗︎
To set up alerts based on request rate metrics, we need to first measure how our systems behave. Given that a properly configured Istio-based service mesh can provide the required metrics, we will be assuming that such an environment is present.
In case your production environment does not utilize service mesh, please feel free to check out our blog post on Defining Application Level SLOs using Backyards. This post details the best practices for exporting these metrics from the application level by relying on Prometheus recording rules to abstract implementation details.
In the examples below, we’ll be relying on a Prometheus metric called istio_requests_total. This metric is provided by Istio (more precisely the Envoy proxy) and is a counter containing the total number of requests a given istio-proxy container has handled.
For the sake of this post, the most important labels on the metric are destination_service_name, which contains the name of the service the request was made to, and destination_service_namespace, which contains the name of the namespace the target service resides in.
Finally, there is the reporter label. Its value can be either source or destination, depending on whether the measurement was taken at the caller or on the callee-side of the Proxy. In this guide, we’ll be using the source-side for examples, as it contains, not just the time it took for the microservice to process the request, but also the network transfer and connection overhead. In this way, source-side measurements give us a better representation of the behavior the user encounters (as it includes network latency, etc.).
Warning: not all services have
source-side metrics. If something is called from outside of the service mesh, then it will only have destination-side reporting, meaning that the monitoring will need to rely on thedestination-side metric.
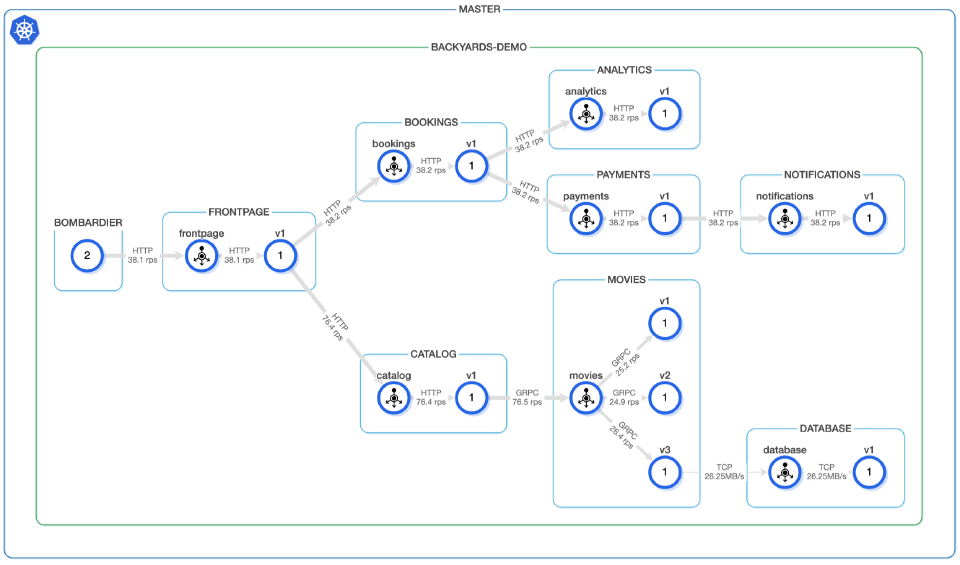
In our examples, we will be using the Backyards’ demo application to showcase individual alerts. It has the following architecture:
The example alert definitions will be created on the movies service, whose namespace is backyards-demo. If you wish to reuse these examples, please replace those constants with the appropriate service names.
Service Level Objectives versus Request Rate 🔗︎
The first question that naturally arises is, “Is it enough to measure incoming traffic on the ingress side?” And it would be, if our goal was to make sure that our external connectivity is working as expected, and that there are no diverging patterns in the incoming traffic.
As can be seen in the diagram above, the movies service is in the middle of the call chain for our demo application. Yet, we are basing these examples on that service.
The cause of this decision is that each service in our demo application has its own Service Level Objective and set of related alerts. For example, when considering the following Service Level Objective (SLO), which is set on the movies service:
The
moviesservice should answer a request within 250 ms in 99.9% of cases over a 30 day rolling period.
The issue is that this SLO works perfectly only as long as the service has steady traffic. In the event the service does not get any traffic, SLOs will report that the system is working as expected, but still, the system’s availability might become compromised.
This leads us to the first failure case that should be solved for, when implementing alerts for any system:
There should be a way to detect the total loss of traffic as other alerting rules assume that traffic is steady.
Alerting on traffic loss 🔗︎
The most obvious solution to address this issue would be to have an alert that fires when there is no traffic over an extended period of time on a given service.
There are better implementations for request rate monitoring, but, as more sophisticated algorithms are discussed, they often start requiring specific behaviors of the traffic itself. If the service has a traffic pattern such that, for minutes, it does not get any traffic (and that is considered normal), or if the service is a new one without prior knowledge of traffic patterns, this implementation provides a safety net by ensuring that the latency and error rate alerts are still functional.
The following Prometheus query will trigger an alert if the requests per second of the movies service is 0 over a 5 minute period. Of course, the period needs to be adjusted for each and every service, based on traffic characteristics.
sum(rate(istio_requests_total{
    reporter="source",
    destination_service_name="movies",
    destination_service_namespace="backyards-demo"
}[5m])) == 0
Alerting on traffic loss due to missing pods 🔗︎
Given that these alerts are geared towards new services, it’s worth mentioning that there is another case when the incoming rate becomes 0, which is when there are no pods running this specific workload (or there are issues with inter-pod communication).
Such situations can arise due to quite a lot of causes, such as:
- All of the Pods are OOMKilled
- There are not enough resources in the cluster to spawn a new pod
- Mass disruption of worker nodes (e.g. spot price changes)
- A network issue prevents the Istio sidecar from serving traffic
- The deployment strategy is faulty and there are times when there are no active pods
This list, which is by no means exhaustive, contains only those issues I could enumerate quickly. Technically, it’s possible to create alerts for each such issue, but it’s way easier to alert on the symptom that we’re seeing
The pods are not exposing their usage statistics.
Given that this issue can mean anything from a single misconfiguration to a cluster-wide outage, it’s worth alerting on.
Handling missing data points in Prometheus-based alerting 🔗︎
When we take into consideration the possibility of no pods serving this workload, it would also mean that the Envoy proxy (istio-proxy sidecar) is not running. Prometheus would obtain the istio_requests_total metric from that sidecar, meaning that the metric will not be available.
To understand why this is a special case, let’s first try to understand the meaning of the previous expression. The istio_requests_total{...}[5m] will yield a range vector, that contains the last 5 minutes of measured values for all the pods Prometheus was scraping data from:
| labels | value | row contents |
|---|---|---|
| {pod="a”, reporter="source”, …} | [3.5, 3.3, …] | All point in time measurements for the last minute on number of requests served by pod a |
| {pod="b”, reporter="source”, …} | [2.5, 2.2, …] | All point in time measurements for the last minute on number of requests served by pod b |
The rate function takes this range vector and executes the rate calculation algorithm on each of the rows in the input vector.
The rate(istio_requests_total{}[5m]) expression will yield an instant vector, that will contain a set of labels and the value associated with those labels in each of its rows:
| labels | value | row contents |
|---|---|---|
| {pod="a”, reporter="source”, …} | 3.5 | The RPS value for pod a |
| {pod="b”, reporter="source”, …} | 2.5 | The RPS value for pod b |
The sum function, summarizes the value of all the raw data and returns a vector without labels and with the summarized value as value:
| labels | value | row contents |
|---|---|---|
| {} | 3 | The RPS value for the service |
With this in mind, let’s check out what the condition == 0 does in this definition:
sum(rate(istio_requests_total{
    reporter="source",
    destination_service_name="movies",
    destination_service_namespace="backyards-demo"
}[5m])) == 0
If you have a passing familiarity with any programming language, you might assume that this means the end result will be a boolean (either true or false value). In reality, however, Prometheus comparison operators are vector operations, meaning that:
Between an instant vector (in this case the
sum(rate())expression) and a scalar, these operators are applied to the value of every data sample in the vector. The vector elements between which the comparison result is false, get dropped from the resultant vector.
Alerts are defined in such a way that an alert will fire if the expression responsible for the alert evaluates as a non-empty instant vector. In the previous example, if there is a 0 value returned by the sum(rate(istio_requests_total)) expression, the == 0 operator will retrain the 0 value and an alert will fire.
Similarly, if there is only a non-zero value, the == 0 condition will remove it from the vector, resulting in an empty vector, thus no alerting will occur.
Let’s return to the case we mentioned before: if there is no data available as part of the istio_requests_total metric for a given service, the previous expression will not fire, as calling rate or sum over an empty vector yields empty vectors. Prometheus would interpret this situation as everything being completely fine.
To work around this issue - in addition to the previous expression - there needs to be one more that ensures the values exist in Prometheus:
absent(
    sum(rate(
        istio_requests_total{
            reporter="source",
            destination_service_name="movies",
            destination_service_namespace="backyards-demo"
        })
    )
)
absent works in such a way that, if its argument is an empty vector, it will yield a vector containing a value of 1, while, if the vector is not empty, it will yield an empty vector.
Alerting using “static” lower thresholds 🔗︎
Of course, if a service is in daily use, it’s not enough to monitor just for total traffic loss. For example, the amount of traffic served for a Software as a Service solution may be proportional to the amount of income the company makes. In such situations, an instant 50% percent loss of traffic, when unnoticed, can have disastrous results.
In the event there is always traffic on a given service, we should be able to come up with a better threshold than 0. By taking a look at the traffic patterns of the last few weeks, taking the minimum requests per second, then lowering it a bit (for example 80% of that minimum) should give us a fairly good threshold for alerting purposes.
threshold = 0.8 * minRPSOverTwoWeeks
In this case the expression used for alerting changes to this:
sum(rate(istio_requests_total{
    reporter="source",
    destination_service_name="movies",
    destination_service_namespace="backyards-demo"
}[5m])) < 13.1
Besides the threshold we’ve already defined (13.1 in this example), the expression relies on a 5m lookback window. This lookback window can be increased or decreased to fine-tune the sensibility of this alert. A longer window means that an outage will need to be longer before the alert triggers.
The biggest downside of this approach is that the threshold and the window size need to be regularly adjusted to the given service as its load characteristics change.
Alerting using automatic threshold settings 🔗︎
As the setup we just mentioned would require manual adjustments, let’s try to automate it. To create a Prometheus query that automatically adjusts the threshold, first we would need to create a recording rule, that exposes the last 5 minutes of request rates as a new metric:
apiVersion: monitoring.backyards.banzaicloud.io/v1
kind: PrometheusRule
metadata:
  labels:
    backyards.banzaicloud.io/monitor: "true"
  name: health-statistics
  namespace: backyards-system
spec:
  groups:
  - name: service-source-request-rate
    rules:
    - expr: |
        avg
           sum
           by (destination_service_name, destination_service_namespace)
           (rate(istio_requests_total{reporter="source"}[5m]))
      record: rate:service_request_rate
This metric will contain lines such as:
| labels | value | row contents |
|---|---|---|
| {destination_service_name="movies”, destination_service_name="backyards-demo” } | 3.5 | The RPS value of the movies service in the last 5 minutes measured source-side. |
| {destination_service_name="bookings”, destination_service_name="backyards-demo” } | 5 | The RPS value of the bookings service in the last 5 minutes measured source-side. |
Using this metric, we can calculate the minimum traffic the service received last week (and exclude the last hour of traffic from the calculation):
min_over_time(
    rate:service_request_rate{
        destination_service_name="movies",
        destination_service_namespace="movies"}[1w:5m] offset 1h)
By simply replacing the threshold definition with this from the previous example, we are presented with this alerting expression:
 sum(rate(
     istio_requests_total{
        reporter="source",
        destination_service_name="movies",
        destination_service_namespace="backyards-demo"
    }[5m])) < 0.8 * min_over_time(
                        rate:service_request_rate{
                            destination_service_name="movies",
                            destination_service_namespace="movies"}[1w:5m] offset 1h)
What it does is calculate the last five minutes’ request rate and compares it to the last week’s minimum value. If the value is less than 80% of the weekly minimum, then it triggers an alert.
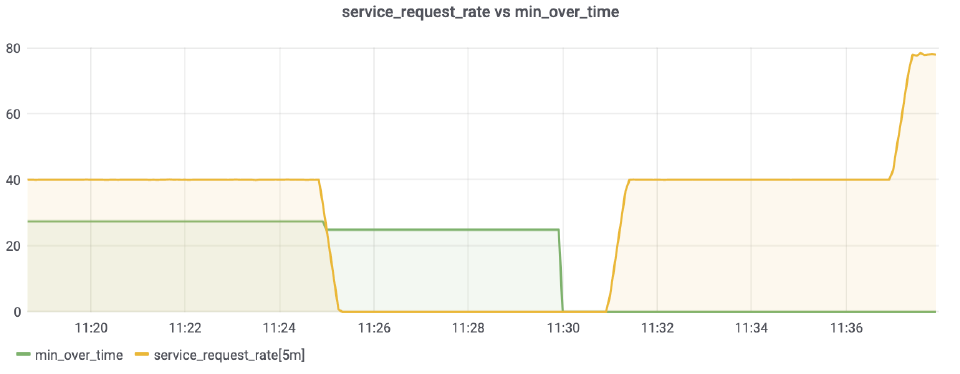
Here we’re using a 1 hour offset, so that we’re not including the current minimum in the control samples, but let’s take a look at what happens with the threshold after a full traffic outage:
As is visible on this graph, this approach has a severe drawback: as soon as enough time has passed to include the new minimum value into the lookback window (1 hour offset), it will decrease the threshold (green line). This means that, in the event of full traffic loss lasting a week, new traffic loss will not be detected.
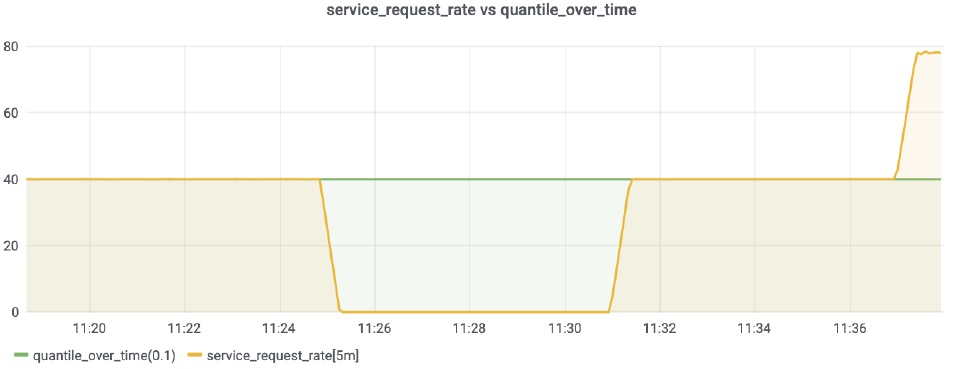
To get around this, it’s possible to rely on a different function for finding the lower threshold. For example, when using the quantile_over_time function instead of the min_over_time the minimum starts to behave like this (green line shows the minimum observed by the function):
The green line shows how this threshold function behaves:
quantile_over_time(0.1,
    rate:service_request_rate{
        destination_service_name="movies",
        destination_service_namespace="movies"}[1w:5m] offset 1h)
quantile_over_time will return a threshold that is only bigger than 10% of the samples seen. This way, if the system doesn’t spend more than 10% of its uptime in a trafficless condition, we are presented with a non-zero threshold.
The drawback is that this increases the minimum threshold (as it excludes 10% of the smallest data points), thus the 80% modifier on the threshold might need to be adjusted.
Why alert in high traffic conditions? 🔗︎
Before moving on to a better approach to finding these minimums, let’s briefly talk about the necessity of high traffic alerts. Based on the previous assumption that traffic drives profit in (some) SaaS companies, one might assume that it’s good to have more traffic.
There are two general cases when high traffic is not helpful. The first is if the system is subject to a DoS or DDoS attack (either as the result of malicious intent or from a buggy client or frontend code), which means the additional cost required to serve the traffic is a waste. Having an alert set up in this scenario means that such issues will not just be noticed by lucky chance, or when systems are overloaded, but in a timely fashion.
The other case follows from the fact that even modern Kubernetes services scale fast only up to a certain point. The deployment might reach its maximum Horizontal Pod Autoscaler capacity, and the cluster might not be able to allocate more nodes. In such cases proactive detection of such issues prevents outages, or decreases the mean time to recovery (MTTR).
Of course, it’s up to the owners of a system if they want to issue a Pager in such situations, or a simple warning to Slack, or if a ticket in the ticketing system is sufficient (as it may be completely fine to check out such an issue during working hours).
Alerting using metric statistics 🔗︎
As we discussed in our webinar, static threshold-based alerts tend to have thresholds that are not strict enough to detect small deviations that might require the SRE’s attention. Also, as you have seen, calculating an absolute minimum or maximum threshold is quite tricky.
The best option would be to create some kind of alerting rule, which dynamically adjusts itself to the traffic patterns it sees. Before going completely crazy with Machine Learning models, let’s first try an approach based on Statistical Analysis.
If we assume that the request rate of a given service forms a normal distribution, we can test the current values against this distribution. (Of course in reality the request rate will not be a perfect normal distribution, however, with well-set thresholds it will provide a good approximation.)
A normal distribution is characterized by two parameters. The first is the mean of its values. The second parameter is called standard deviation which is a measurement of the tendency individual values have to deviate from the mean.
In practical terms, standard deviation is a measure of how far the measured values are from the mean of a time series. In this sense, they can be viewed as a measure of how sporadic the traffic is that the service receives. This means that, when using normal distributions to alert on traffic patterns, the calculation will also factor in the burstiness of the incoming traffic, which was not the case when using static thresholds.
The reason normal distributions are great for calculating these thresholds is that they have a property such that 99.7% of measurements (if they are from the normal distribution in question) will be between 3*StdandardDeviation - Mean and Mean + 3*StandardDeviation.
Since Prometheus provides stddev and avg functions for any time series, we can easily create an alerting rule, which will trigger an alert if the traffic has increased by more than 40% compared to yesterday’s data:
rate:service_request_rate{...} >
    1.4 * (
        3*stddev_over_time(rate:service_request_rate{...}[1d:5m] offset 1h) + avg_over_time(rate:service_request_rate{...}[1d:5m] offset 1h))
Note: we’re still adding the 1-hour offset, so that the values we’re checking are not interfering with the distribution we’re measuring against.
As the actual measurements are not guaranteed to form a normal distribution, the actual distribution will be just an approximation, and can even provide a negative lower threshold in extreme cases, so it’s crucial that this kind of alerting is done in addition to a threshold-based alerting solution.
Also, it’s worth mentioning that based on the service’s traffic periodicity, an additional weekly rule might make sense.
Advanced models 🔗︎
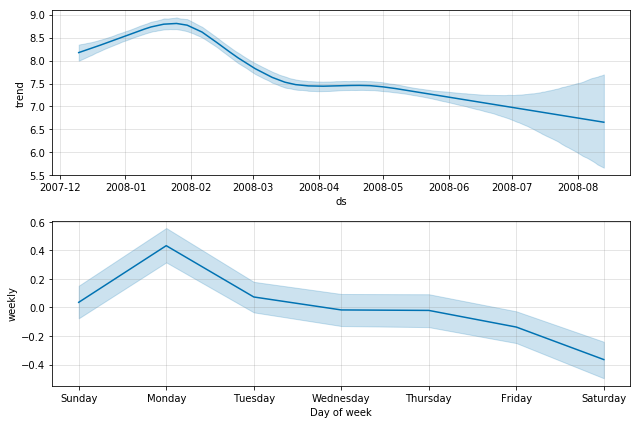
It is possible to use algorithms to forecast the trends of the traffic rate. A great example of such a forecasting library is the Prophet library by Facebook.
The library does not involve machine learning, rather, it uses multiple statistical models to estimate effects of daily, weekly and yearly periodicity on the data series.
Even if it seems tempting to rely on such solutions for alerting, the main issue is reaction time. Training the model and acquiring the forecast for a single service’s rate behavior takes a minute on a single CPU core, and, as time goes on, the predictions start to become more and more uncertain.
When you take into consideration that, thanks to Prometheus, Backyards resolves such metrics in 5 seconds, it might seem like 1 minute just to train one service is too much.
Also, such systems require historical data to learn from, meaning that without a few days’ worth of data, alerts will be unreliable. The data should also be free of any irregularities (such as outages), so that they are not treated as normal behavior.
In this way, such systems should only be used as an extension of the previously outlined methods, and only when those alerting strategies are working as expected.
Conclusion 🔗︎
As detailed in this blog, a properly implemented request rate monitoring solution is essential to guaranteeing the correctness of latency and of error rate-based SLOs. Such a system should consist of multiple alerts, layered on top of each other to address different cases.
A minimalistic approach would include an alert on each of the traffic loss cases we discussed, paired with stricter threshold-based alerting solutions (static threshold, dynamic threshold, statistics-based threshold).
Complex solutions such as forecasting, or (at least, initially) statistics-based thresholds, are better for use in detecting outlying traffic patterns, instead of day to day alerting practices.
About Backyards 🔗︎
Banzai Cloud’s Backyards (now Cisco Service Mesh Manager) is a multi and hybrid-cloud enabled service mesh platform for constructing modern applications. Built on Kubernetes, our Istio operator and the Banzai Cloud Pipeline platform gives you flexibility, portability, and consistency across on-premise datacenters and on five cloud environments. Use our simple, yet extremely powerful UI and CLI, and experience automated canary releases, traffic shifting, routing, secure service communication, in-depth observability and more, for yourself.


