When implementing a microservice-based architecture on top of Kubernetes it is always hard to find an ideal alerting strategy, specifically one that ensures reliability during day 2 operations.
Modern Kubernetes-based deployments - when built from purely open source components - use Prometheus and the ecosystem built around it for monitoring. The unparalleled scalability of Prometheus allows you to measure (and store) most of the data reported by both workloads and cluster components. When performing incident analysis, the ability to retroactively check almost any property on the system allows for deep insight into any underlying issues.
When it comes to alerting, the amount of data available makes it hard to choose what to alert on, exactly. If too many alerts are set, they may be redundant, which will lead to an overly verbose alerting system and result in important information being lost in a sea of non-actionable alerts.
In this post, we are going to cover the basic aspects of implementing an on-call rotation, that ensures the availability of the service while trying to minimize the cost of such a setup. The primary focus will be on microservices that serve request-based protocols, and how rate, error and duration-based (RED-based) alerts can be used to implement an alerting strategy.
Due to the complexity of this subject, and to keep this post from ballooning out of control, we will be building on what we discussed in our previous posts on Service Level Objectives and our webinar on Tracking and Enforcing SLOs using backyards.
Why implement on-call rotation? 🔗︎
On-call rotation is a setup in which engineers respond to service outages (even after hours) promptly (within minutes) by receiving an alert to their mobile devices. These timely alerts allow them to solve issues as fast as possible, practically as they arise.
In our request rate monitoring blog post, we briefly discussed how, when using a Software as a Service (SaaS) solution, traffic is (or should be) proportional to the income of a company.
When we combine these elements, the primary purpose of an on-call rotation becomes ensuring that the user experience does not change outside of business hours. Utilizing this approach also means that issues that do not affect the overall user experience can, and should, wait to be fixed until the next working day.
This also means that alerts whose only purpose is to warn engineers of possible causes of outages (such as out of memory conditions) that can lead to a system outage, but that the system will most likely recover from, are not alerts that fall within the scope of those handled by an on-call rotation. Of course, those issues do need to be solved, or at least a proper workaround must be implemented, but, as long as the end user’s experience is unchanged, they can wait until the next day.
To understand why we recommend focusing on end-user experience when implementing an alerting strategy, let’s take a look at the cost of implementing an on-call system.
Cost of implementing an on-call rotation 🔗︎
Being on-call and receiving an alert in the middle of the night has a hidden cost associated with it, both at the personal (the engineer’s) and the organizational level. Having received an alert during the night, the engineer will become less productive the next day. In a best-case scenario, they somehow patch the issue in 10 minutes and on the next day they’re able to focus on fixing the actual issue that signaled the alert, in order to prevent it from happening again (instead of working on an agreed upon task for that day). In a worst-case scenario, resolving the issue takes a longer time and, as a result, the engineer is not able to work the next day.
These rotations are often weekly, meaning that an engineer is solely responsible for reacting to alerts for one week. In a weekly rotation, however, regular alerts (like every night) can - and will - lead to alert fatigue. This means that meaningful alerts run a greater risk of being ignored (or completely disabled) and not acted upon. By making sure that only business-critical issues generate alerts, the burden placed on the engineer on call can be significantly diminished.
To make matters worse, over an extended period a workload like this can lead to burnout. At the organizational level, this results in:
- losing great engineers, or
- an engineering team constantly underperforming, or
- both
For these reasons, it is in the mutual best interest of organizations and engineers to ensure that whenever an alert fires, it is sent to an off-hours pager.
That alert must be important enough to act on.
As a reflection of this view, in this blog post, an alert that result in a page to an engineer will be simply called an Alert. Other alerts that do not trigger a page (like a Slack notification), will be called a Warning. I usually think of Warnings as “debug” alerts, since they are, foremost, a useful way to draw attention to an issue just starting to manifest in the system but it is completely fine to act on them at a later point in time.
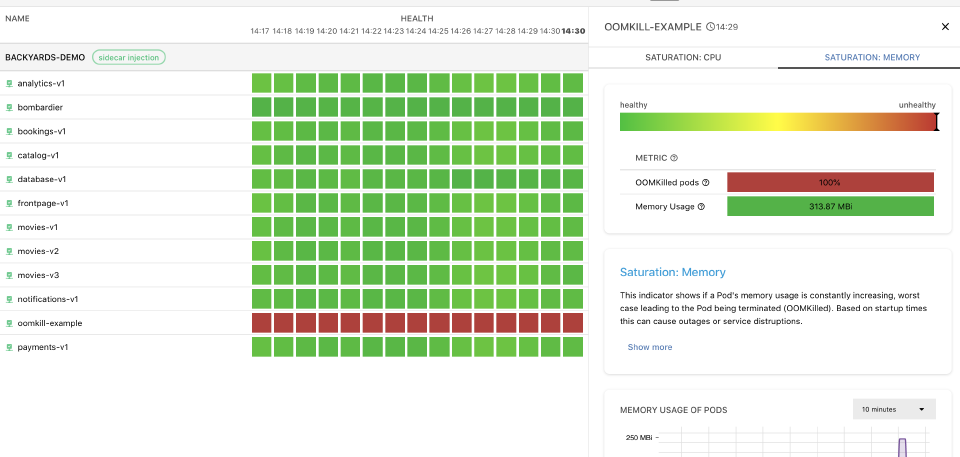
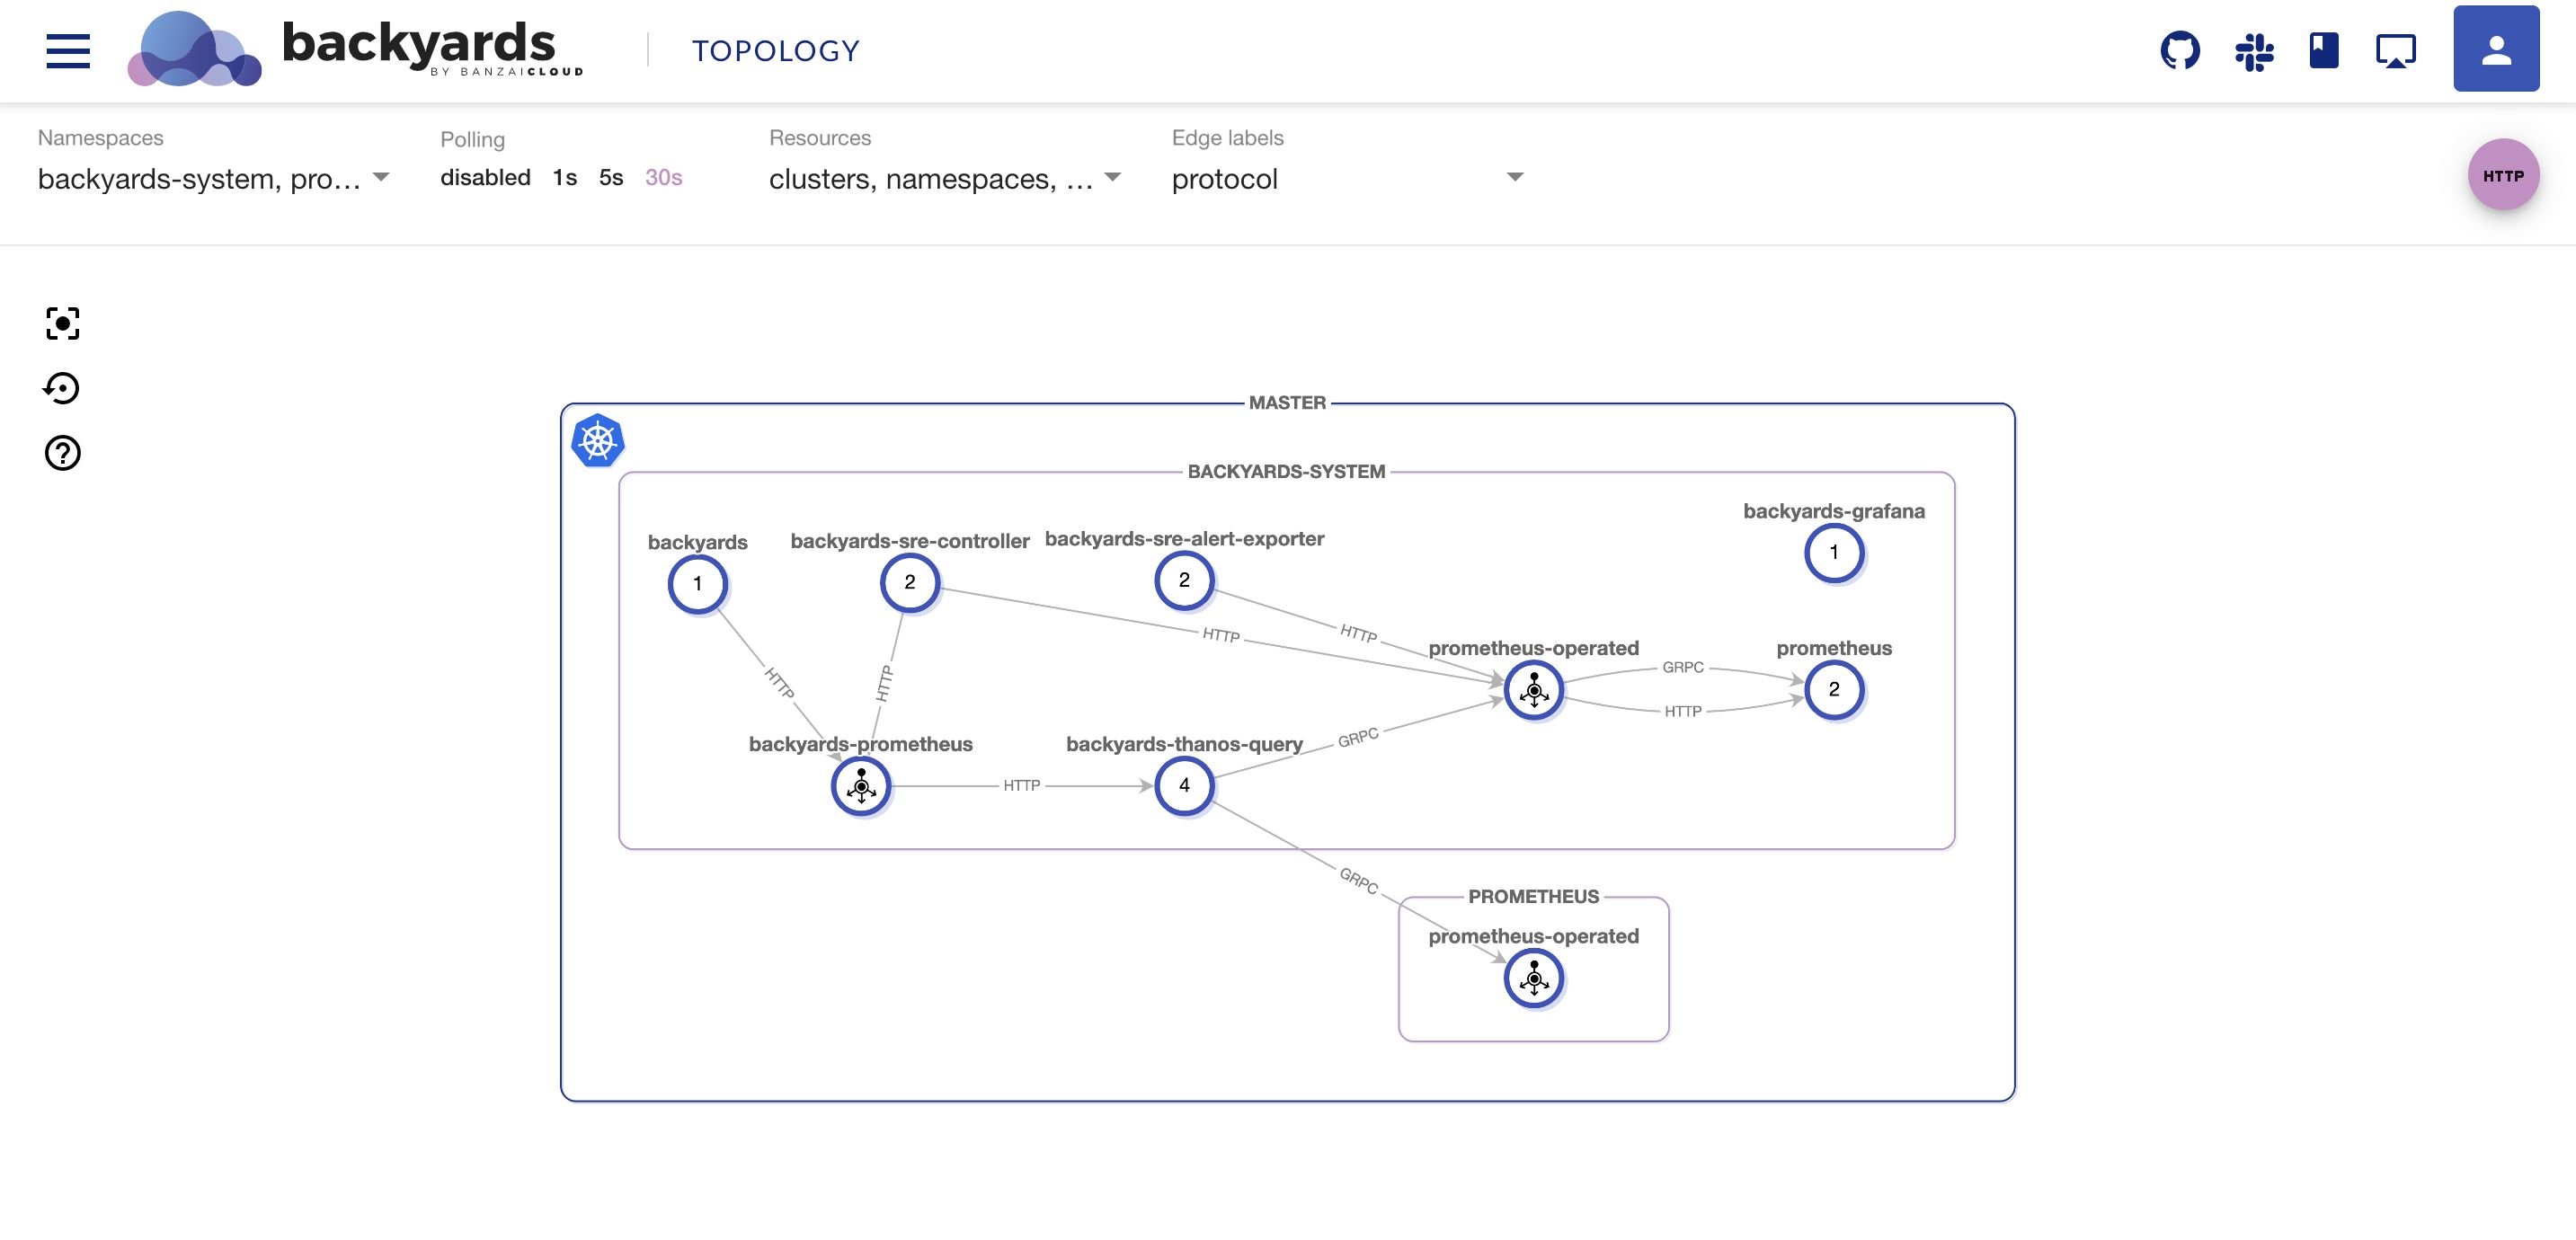
Of course, we’re not suggesting that you dump those Warnings into a Slack channel, as such channels tend to be traffic-heavy and engineers tend to ignore the “noise” there. For a more structured overview of your system’s health we recommend using Backyards’ new Health feature:
Measure everything, alert on what matters 🔗︎
It might be tempting to rely on the vast collection of metrics provided by Prometheus to create Alerts based on conditions like CPU usage of a pod, or if a pod got killed due to an Out Of Memory issue (OOMKilled). Strangely enough, it is considered a best practice to treat these indicators as Warnings only. The reason behind this is simple:
Kubernetes provides self-healing capabilities that should be able to compensate for these issues (at least temporarily) if configured properly.
When a pod has high CPU usage and a Horizontal Pod Autoscaler (HPA) is set up properly, your Deployment upscales to compensate for the increased demand on the CPU. If your pod gets OOMKilled, the underlying ReplicaSet ensures that a new pod is started. As long as the end-user does not see any difference in the quality of the service provided, these issues are not important enough to pay the aforementioned price of triggering an Alert.
Alerting on RED metrics 🔗︎
After having discussed anti-patterns, it is only natural that we now discuss what, exactly, to Alert on in the environment we’ve described.
As a means of answer this question, let’s take a look at The Four Golden Signals, detailed in the Site Reliability Engineering book by Google. These signals are:
- Latency (or Duration): The time it takes to service a request.
- Errors: The rate of requests that fail, either explicitly (e.g., HTTP 500s) or implicitly (for example, an HTTP 200 success response, but coupled with the wrong content).
- Traffic (or Rate): A measure of how much demand is being placed on your system, measured in a high-level system-specific metric. For a web service, this measurement is usually the number of HTTP requests per second.
- Saturation: How “full” your service is. A measure of your system fraction, emphasizing the resources that are most constrained (e.g., in a memory-constrained system, show memory; in an I/O-constrained system, show I/O)
Based on our experience, the workloads that run most frequently on a service mesh are request-based services (most often HTTP), thus we will be focused primarily on microservices acting as HTTP servers.
Environment 🔗︎
To start alerting on these golden signals, first, we need to measure how our services behave. Given that a properly configured Istio-based service mesh can provide the required metrics, we will be assuming that such an environment is present. If you would like to replicate these rules, you can always try out Backyards, Banzai Cloud’s Enterprise-Grade Istio Distribution.
In case your production environment does not use a service mesh, please feel free to check out our blog post on Defining Application Level SLOs using Backyards. This post details the best practices for exporting these metrics from the application level to abstract implementation details by relying on Prometheus recording rules.
In the examples below, we’ll be relying on two Prometheus metrics provided by Istio (more precisely the Envoy proxy):
istio_requests_totalis a counter containing the total number of requests a givenistio-proxycontainer has handled.istio_request_duration_milliseconds_*:istio_request_duration_milliseconds_bucketis a histogram showing how much time it took to serve a given request.
For the sake of this post, the most important labels on the metric are:
destination_service_name, which contains the name of the service the request was made to, anddestination_service_namespace, which contains the name of the namespace the target service resides in.
Finally, there is the reporter label. Its value can be either source or destination, depending on whether the measurement was taken at the caller or on the callee-side of the Proxy. In this guide, we’ll be using the source-side for examples, as it contains not just the time it took for the microservice to process the request, but also the network transfer and connection overhead. In this way, source-side measurements give us a better representation of the behavior the user encounters (as it includes network latency, etc.).
In our examples, we will be using the Backyards’ demo application to showcase individual alerts. It has the following architecture:
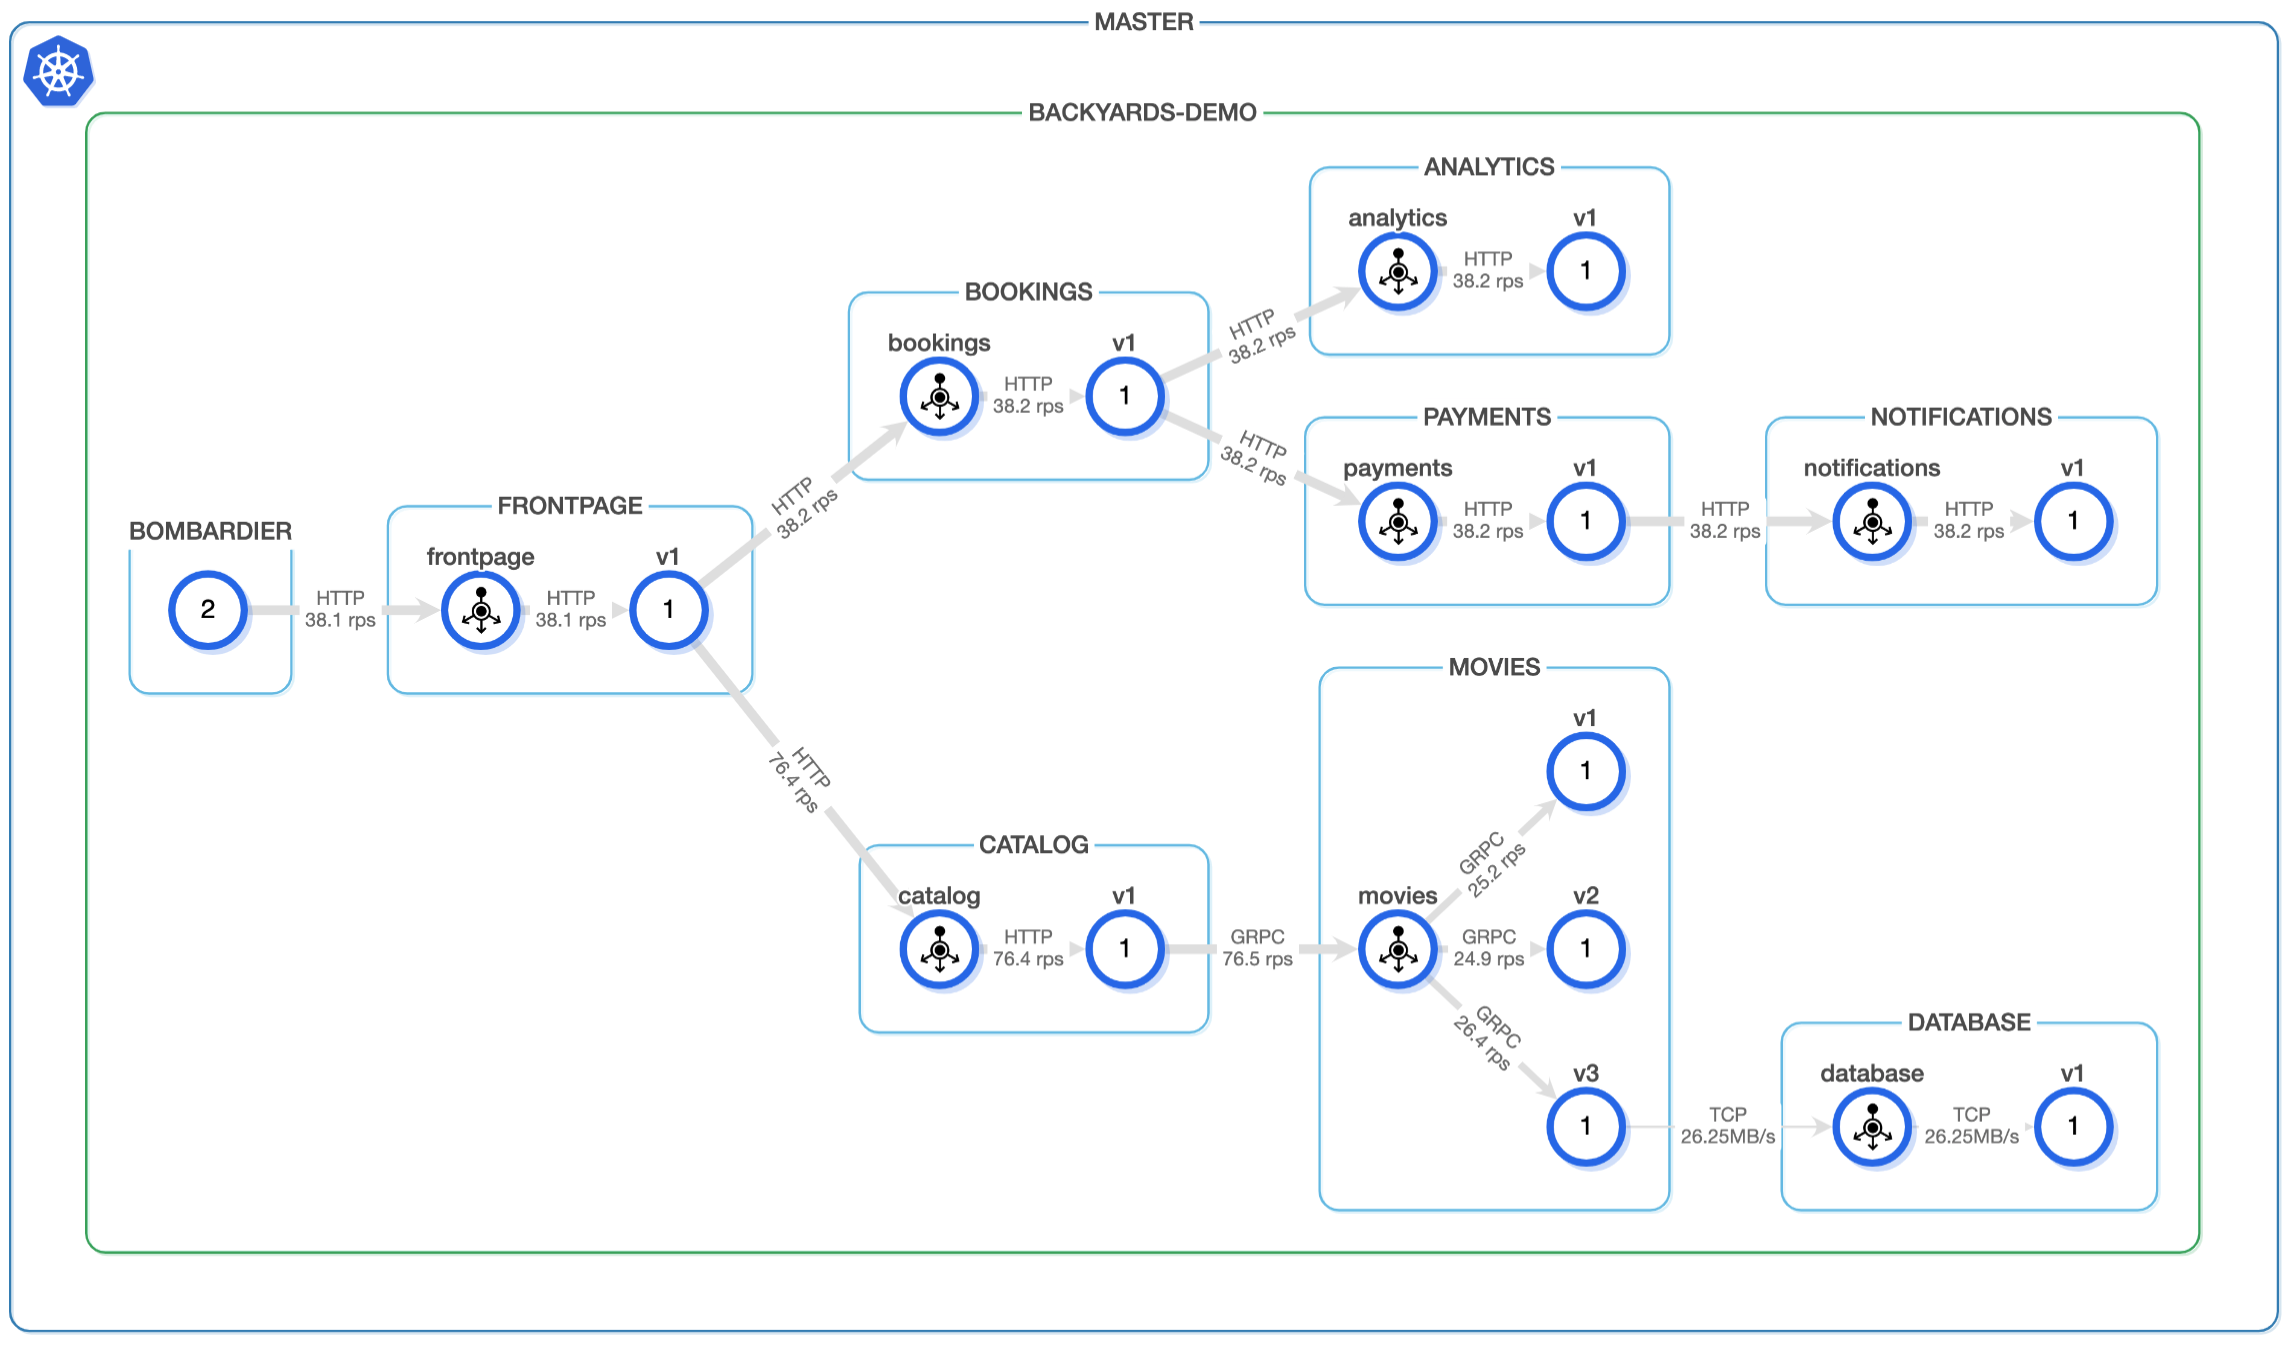
The example alert definitions will be created on the movies service, whose namespace is backyards-demo. If you wish to reuse these examples, please replace those constants with the appropriate service names.
Alerting on Response Errors 🔗︎
As previously mentioned, selecting the right metrics to Alert on should be the result of a conscious process designed to protect the daily operations of the service. It might seem trivial, but let’s take a look at how response errors manifest for the end-user, and why we should alert on (HTTP) errors.
When a service returns an error code, generally two things can happen from the end-user’s point of view.
- The error can be directly presented to the end-user, who, after a few manual retries, will stop using the site, resulting in decreased traffic and possibly the loss of that user.
- If the error is handled correctly in the frontend (or client application), it will retry the operation and, in the case of a partial outage (when only a fraction of requests fail), the end-user will see increased response times due to multiple attempts being made. Depending on the amount of time spent retrying, from the end-user’s perspective the service will become (unbearably) slow, again resulting in the user navigating away from the site.
Defining Error Rate alerts 🔗︎
For request errors, the most basic alert is one that allows for a given threshold of unsuccessfully processed requests. Given that most services receive a varying number of requests over time, we recommend measuring the percentage of requests that result in an error. This percentage is called the Error Rate, and which allows you to specify a threshold that results in alerts made independent of request-rate.
As discussed in our blog post about Tracking and enforcing SLOs, the following PromQL query can be used to measure error rate:
    sum(rate(
        istio_requests_total{
            reporter="source",
            destination_service_name="movies",
            destination_service_namespace="backyards-demo",
            response_code!~"5.."}[2m]))
    /
    sum(rate(
        istio_requests_total{
            reporter="source",
            destination_service_name="movies",
            destination_service_namespace="backyards-demo"}[2m])) > 0.01
The above example takes the number of 5xx errors and divides it by the total rate (RPS) of requests the service has received, and generates an alert, if, in the last two minutes (2m), the ratio of such errors is over 1% (i.e. 99% of requests are still working as expected).
From the definition you can see that we’re using some “magic” constants (such as our 2 minutes of lookback time and our 99% success rate). When trying to finalize such an alert, the most difficult part is arriving at the correct thresholds (the “magic” constants), so the system’s availability does not decrease while ensuring that the alerts are only triggered when needed.
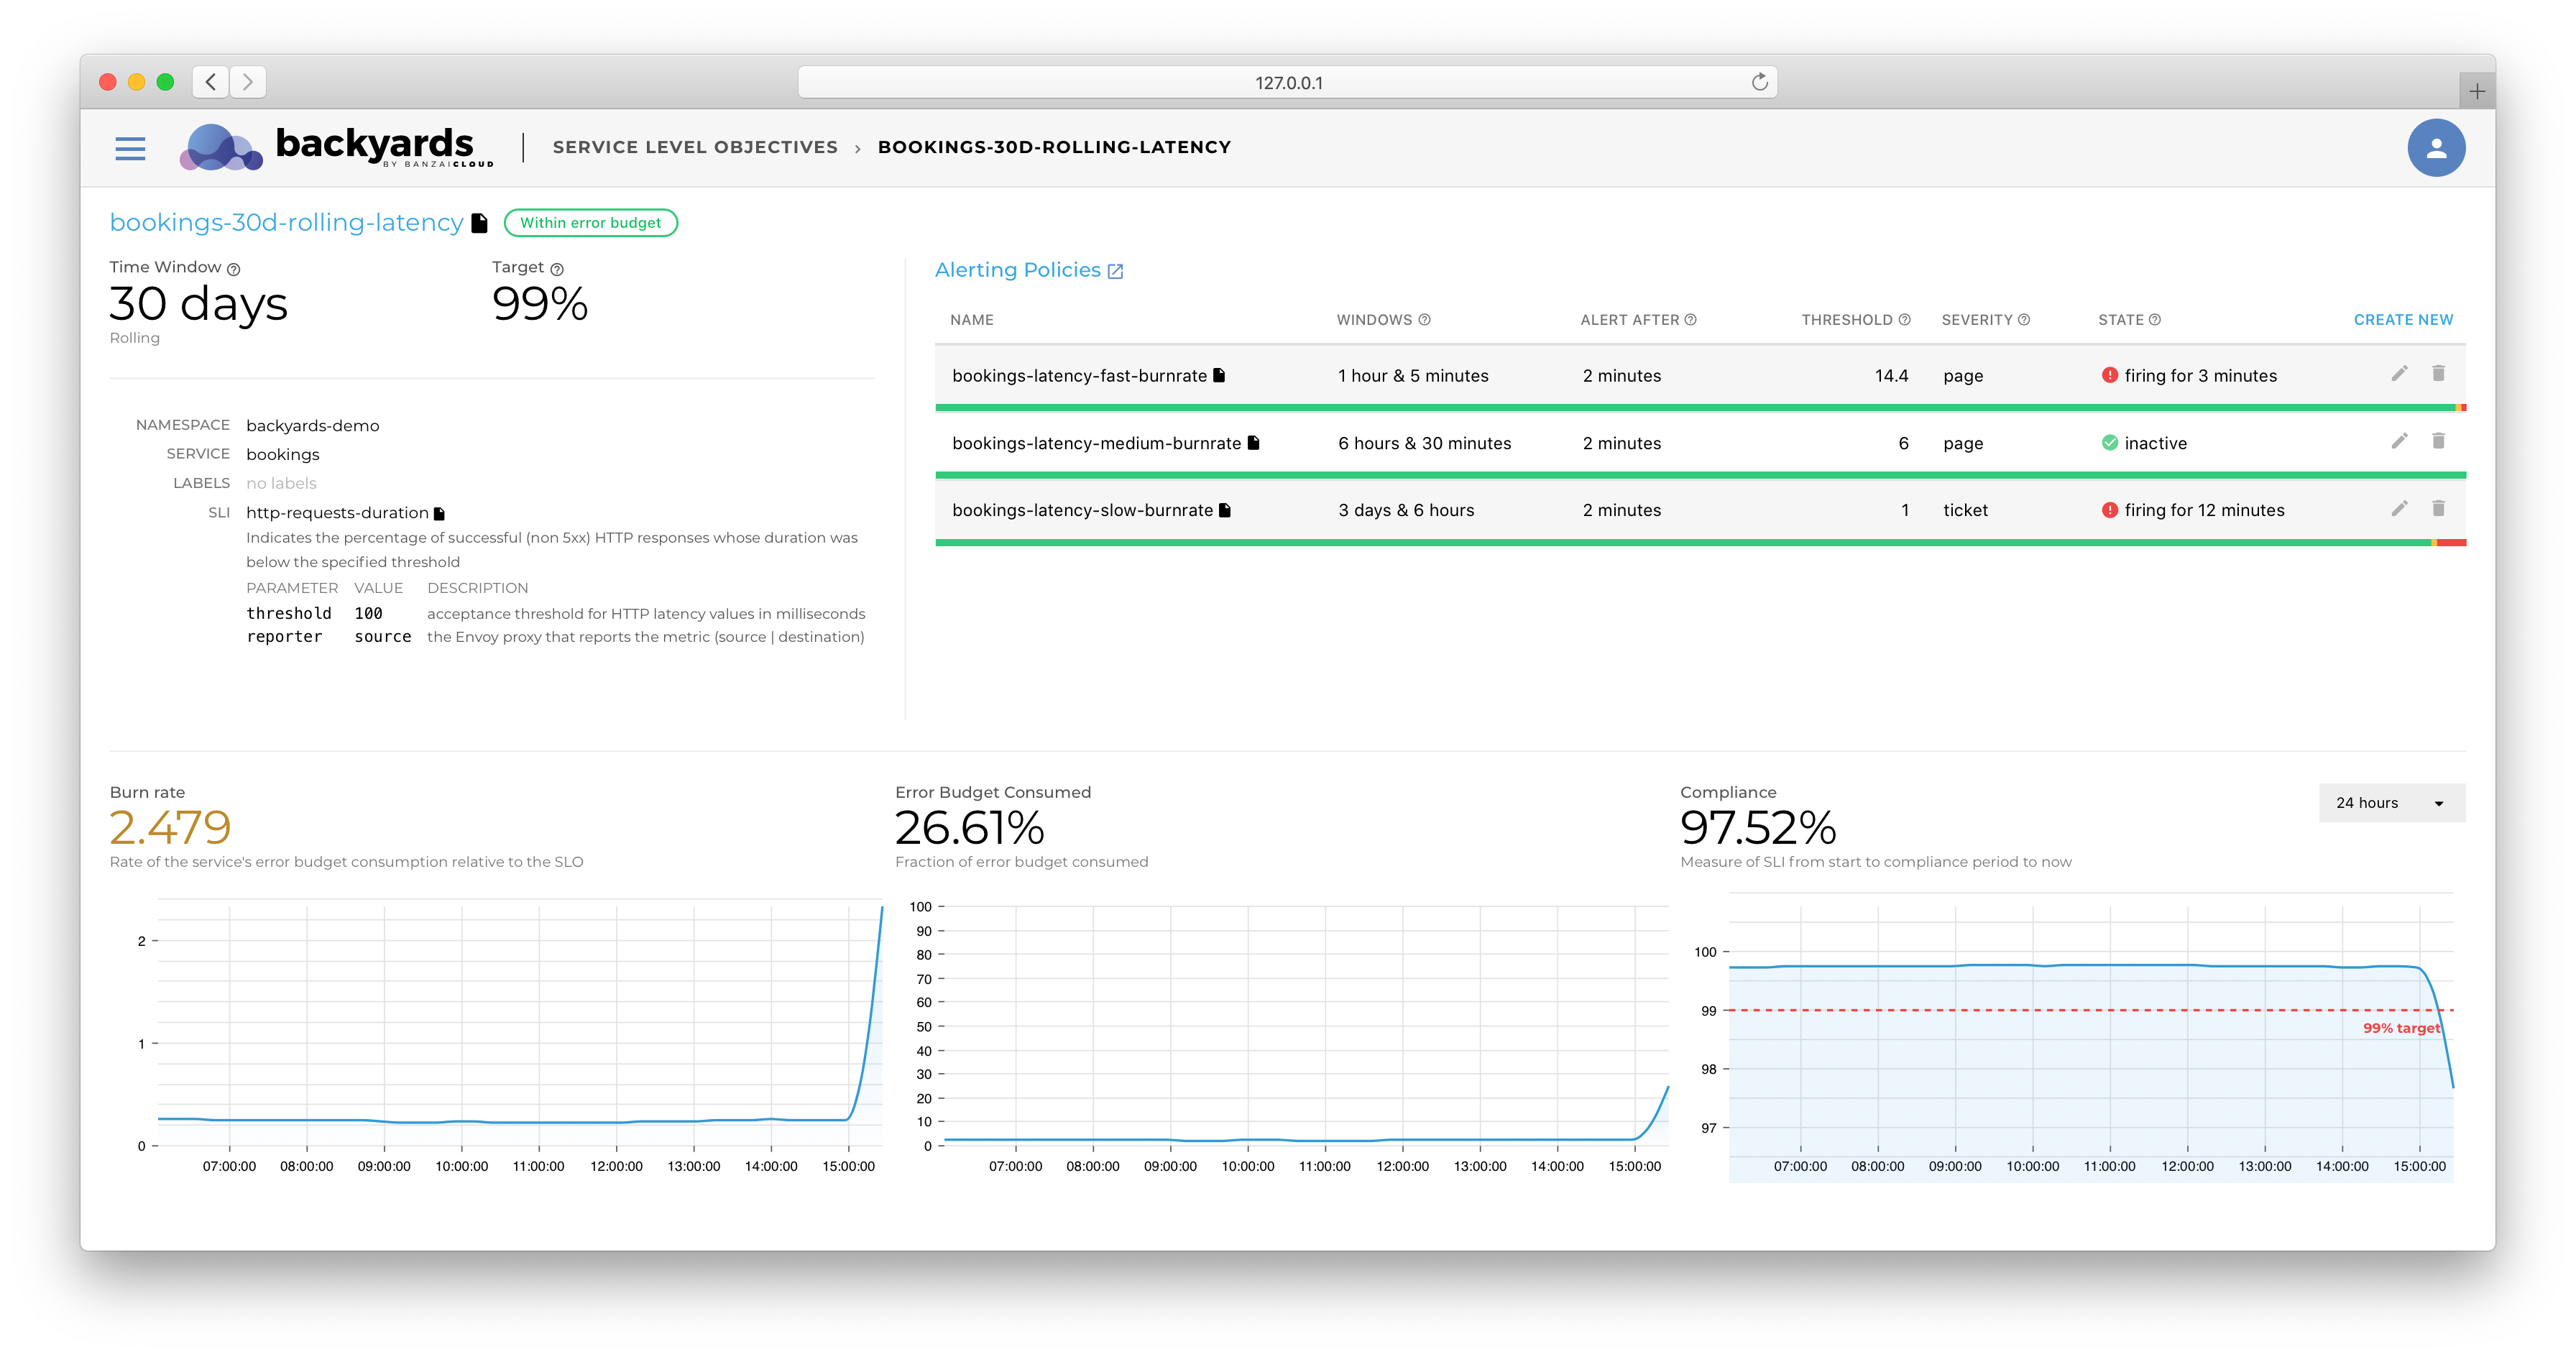
Backyards provides a framework for segmenting Alerts and Warnings, based on the magnitude of an issue, in the form of Burn Rate-based alerts. For an in-depth analysis of this technique, please see our blog post, Burn rate-based alerting demystified.
In order to demonstrate the importance of this segmenting process, let’s consider an example. The movies application receives 20 requests per second. If the application returns errors for 40 requests (over a 2 second period), the alert we’ve described will trigger a page. Given that we have a 99.9% SLO defined over 30 days, we could have up to 43 minutes of downtime.
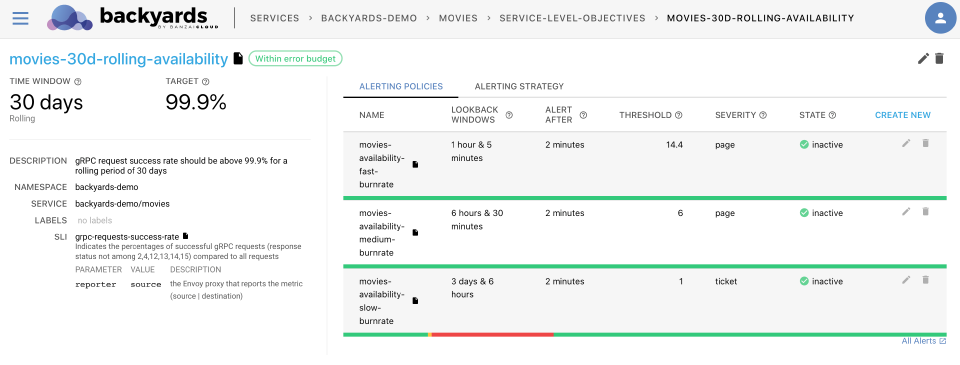
When using SLO-based alerting, the alerts behave like so:
The red line shows that, since the error only lasted two seconds, and then recovered, Backyards only issued a Warning (ticket severity), as the SLO was not in danger. Accordingly, it would be completely fine to check the issue the next day. If you’d like to experiment with your own alerts settings, please check out Backyards’ documentation on Creating SLOs and Alerting Policies.
Corner cases of Error Rate measurement 🔗︎
Before moving on, let us revisit the definition of Error Rate:
Error rate for a service means the rate (percentage) of requests that fail.
Istio’s (or any other service mesh solution’s) role is to abstract network complexity, providing built-in security and observability for the traffic it handles. These implementations, due to being abstraction layers, cannot take into consideration workload-specific behaviors.
To rely on Backyards (and implicitly Istio’s metrics) for alerting, the underlying protocol needs to be understood by Istio (currently HTTP and GRPC are supported).
When using arbitrary TCP-based protocols or any request-based protocol that Istio does not natively support, application-level metrics are required in order to make Error Rate alerts available. For details on how to use these metrics to Backyards, and how to create an abstraction layer using recording rules for diverse environments, please check out our blog post on Defining application-level SLOs using Backyards.
Additionally, the traffic is expected to behave as mandated by the HTTP specification, and according to HTTP 1.1’s definition in RFC7231:
The 5xx (Server Error) class of status code indicates that the server is aware that it has erred or is incapable of performing the request.
An HTTP 200 response code might mean a failure indicated in the payload due to an implementation error or some other technical detail. This should be fixed on the application side to make sure that the Istio metrics are functioning properly; remember, application-level metrics should be used to help us glean a real understanding of how a specific application behaves. Unless these issues persist, the reported SLO compliance values will be off and not representative of the end user’s experience.
Alerting on request rate 🔗︎
The third assumption for the Error Rate calculation is that the service receives traffic. If this is not true, the previous definitions will indicate that everything is working perfectly (as all of the 0 incoming requests were served successfully).
Besides, as we had already mentioned, the number of visitors (and thus implicitly the number of requests served by the service) is proportional to the income generated by the service. This makes request rate monitoring not just a pre-requisite for error rate monitoring, but also a mandatory member of a business value focused alerting strategy.
Given the complexity of a properly implemented rate monitoring system, we had already published a blog post on Request rate monitoring with practical examples of the different strategies when implementing such an Alert.
Alerting on Request Duration 🔗︎
As mentioned during our discussion of Error Rate alerts, users do not churn exclusively because of errors, but also due to a service being slow to respond. This means that the end-user is interested in the system’s end-to-end performance, as this is the latency they are dealing with. Now, if we take a look at our demo application:

The frontpage makes two calls (on average) to our catalog service. This means that if catalog service’s response times increase from 50ms to 150ms and frontpage executes those calls sequentially, the end-user will experience a 200ms increase in latency. In microservice architectures, this is the primary reason why latency alerts are particularly important, as any latency increase in the call chain can cause amplified latency increases on the end-user side.
Request duration-based alerts fire when the time it took to serve some requests goes above a given threshold. A trivial version of this kind of alert would look something like this:
    histogram_precentile(0.99,
        sum(
            by (le)
            rate(
                istio_request_duration_milliseconds_bucket{
                    reporter="source",
                    destination_service_name="movies",
                    destination_service_namespace="backyards-demo",
                }[2m]
                )
            )) > 250
This expression means that Prometheus will fire an alert if 99% (0.99) of the requests have not completed in under 250ms, over the preceding 2 minutes.
The issue with such alerts is the same as with error rate ones: it is hard to differentiate between the severity of a given issue. Based on preset thresholds (SLOs), a service might be fine if latencies only spike for five minutes a day.
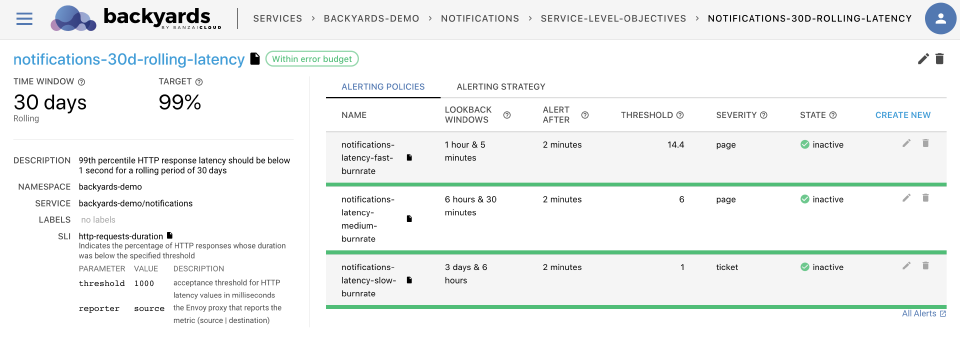
Backyards provides a refined version of this alert, based on Service Level Objectives and Burn Rates. The main improvement in our implementation is how we handle lookback windows. For most services, the incoming request rate varies over time (based on time of the day, or based on te day of the week), but a fixed 2-minute window means that a latency increase during low traffic hours will be treated with the same severity as a latency increase during peak traffic hours.
Backyards’ SLO implementation is based on request counts, meaning that it summarizes the total number of requests that do not meet a specified threshold over the entire SLO period, and will calculate compliance with the Service Level Objective and alert accordingly.
Alerting on Request Duration of Failed Requests 🔗︎
As we hope has become evident over the course of the examples we’ve explored, we recommend not connecting Alert definitions to Error Rates and Duration. If you are familiar with the SRE book by Google it clearly states the opposite:
It’s important to distinguish between the latency of successful requests and the latency of failed requests. For example, an HTTP 500 error triggered due to loss of connection to a database or other critical backend might be served very quickly; however, as an HTTP 500 error indicates a failed request, factoring 500s into your overall latency might result in misleading calculations. On the other hand, a slow error is even worse than a fast error! Therefore, it’s important to track error latency, as opposed to just filtering out errors.
We support treating these Alerts as completely separate, first, as a matter of simplicity. Even if you introduce an additional SLO, and so having multiple Alerts tied to error latencies appears to make sense, implementing an overly complex alerting strategy can be counter-productive. Only when, as part of a post-mortem, and when taking into account the specifics of a given system, it seems like an error duration alert is needed, should one be implemented.
A second reason for this approach stems from how Prometheus’ Alert Manager works by grouping alerts together. In our recommended default setup, these alerts will only trigger one page, so that the engineer working on the issue is not subsequently notified during initial troubleshooting. To augment this capability, Backyards’ user interface clearly indicates when both Error Rate and Request Duration alerts are firing.
Alerting on Saturation 🔗︎
Saturation expresses how “full” a service is. Some examples of Saturation-based alerts include:
- Memory usage
- CPU usage
- Network traffic
- Disk full
Generally speaking, when it comes to (stateless) microservices serving request-based protocols (such as HTTP) running on Kubernetes, we do not recommend setting Saturation Alerts (assuming that the service has a properly set Horizontal Pod Autoscaler setup).
Let us take a look at different aspects of saturation in order to understand this recommendation. If a pod’s CPU saturation reaches its limit, then:
- Firstly, the HPA will kick in and upscale the pod; in this way saturation is a transient state.
- Secondly, if CPU usage of the
Podsincreases, the end-user either notices nothing or if the service “slows” down, the latency alerts are triggered.
Based on the previously discussed approach to base the Alerting Strategy on compliance to the user’s expectations, a 100% CPU usage on a Pod is not an issue as long as it can serve the traffic with the right latency.
The same is true for memory usage: in case a Pod/container gets OOMKilled (runs out of memory), from the end user’s perspective it does not matter, as long as the other Pods of the Deployment can serve the traffic without increased Error Rates or latencies until Kubernetes recovers the failing Pod or container.
Of course, we are not arguing against having Warnings set to trigger in the evert memory gets low. However, due to the self-maintaining capabilities of Kubernetes, as long as these issues are not visible to the end-user, they do not require immediate attention from an engineer.
When to Alert on Saturation 🔗︎
There are also cases when it is necessary to set alerts on saturation issues. First of all, if a given service relies on a PhysicalVolumes to store persistent data, then the volume will not scale automatically as the data stored there increases. In such cases, we recommend setting up predictive alerts for such volumes.
Another example is when a service does not scale well horizontally (such as Prometheus itself). In these cases, it is worth setting up alerts on CPU and Memory Saturation as Kubernetes will not solve for increased CPU and Memory usage. Another alternative could be Vertical Pod Autoscaling. However, the underlying node’s capacity will always serve as an upper limit to how this service scales.
Conclusion: But what about finding the root cause of an issue? 🔗︎
As demonstrated above, a RED-based (Rate, Error, Duration-based) alerting strategy sets out to accomplish only one thing: make sure that a “capable” engineer is notified when something visible to the end-user goes wrong.
An engineer that solves these issues should be “capable”, because - depending on the issue - multiple metrics must be analyzed and cross-referenced to trace the root cause of the incident.
This is the reason alert strategies work best, not just if the responding engineer is “capable”, but also only if they are provided with the right tools, so that they, in the middle of the night, can pinpoint what has changed in a system’s behavior.
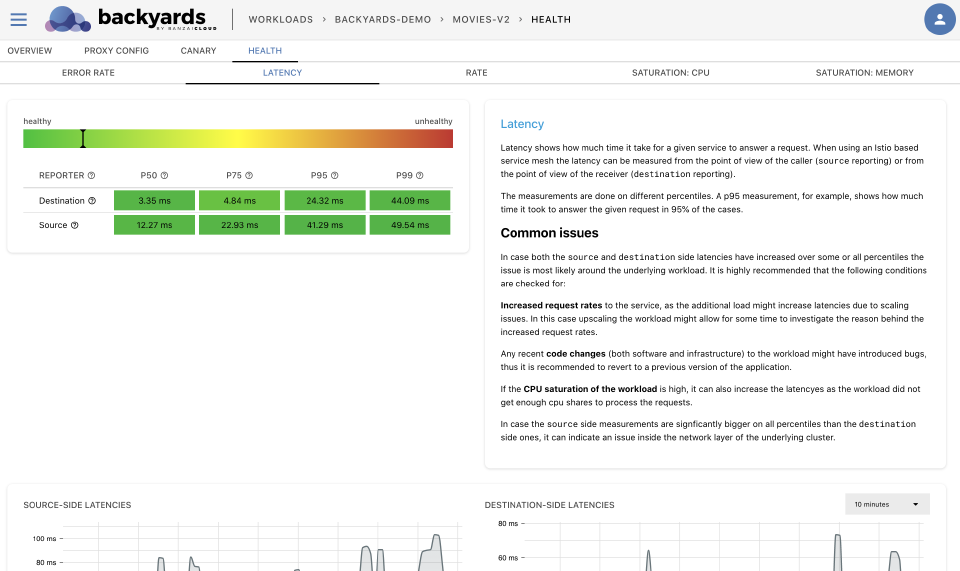
This issue of system complexity can be best addressed by providing the correct set of dashboards with the right graphs. Providing such dashboards is a huge undertaking in itself. This is why Backyards 1.5 provides an outlier detection engine geared towards root-cause analysis for all of the workloads and services running inside your service mesh:
Please check our upcoming blog post for more details on how we use Istio and Prometheus to provide Backyards’ users with this feature, without having to configure anything in their applications (or even in Backyards).
About Backyards 🔗︎
Banzai Cloud’s Backyards (now Cisco Service Mesh Manager) is a multi and hybrid-cloud enabled service mesh platform for constructing modern applications. Built on Kubernetes, our Istio operator and the Banzai Cloud Pipeline platform gives you flexibility, portability, and consistency across on-premise datacenters and on five cloud environments. Use our simple, yet extremely powerful UI and CLI, and experience automated canary releases, traffic shifting, routing, secure service communication, in-depth observability and more, for yourself.


