Running a computing system at scale is hard. The goal of the whole Cloud Native transformation is to make it easier, but it still requires a deep expertise in observability and alerting tools to track the state of the infrastructure and the services. And it’s not only the tools, but the questions that arise at scale. Practice shows that running a complex system with a 100% reliability target is unrealistic. But in that case, how do you determine that certain level of errors that you can live with, or when do you need to trigger alerts to possibly wake an engineer up in the middle of the night? The answers to these questions always depend on the product and therefore the expectation of its users, but some generic concepts that may help are Service Level Objectives (SLOs) and error budgets. This article takes a look at these concepts, and walks through a concrete implementation using PromQL and metrics from an HTTP service.
What is Site Reliability Engineering? 🔗︎
Error budgets and SLOs were first put into use at Google, when they invented the concept of Site Reliability Engineering (SRE). Site reliability engineering has increased in popularity over the last few years, but there’s always confusion about what it really is, and how does it compare to system administration or devops. We don’t want to discuss this question right here, I’ll just quote one of my favourite lines from the SRE book, that Google made freely available online:
SRE is what happens when you ask a software engineer to design an operations team.
To get an in-depth understanding of the topic, you should really go ahead and read that book, alongside its counterpart, the SRE Workbook. These two books not just discuss the framework itself, but also provide insights into the origins and motivations that led to the birth of the SRE role in Google.
Why do I need an SLO? 🔗︎
It’s not a realistic expectation to operate a service at scale without any failures. If you’re relying on Kubernetes, it’s designed for fault tolerance but still, there’s no such thing as a perfectly operated service. System errors will happen when rolling out a new version, when there’s a hardware (or cloud provider) failure, or simply because of bugs in the code that remained undiscovered during testing. It’s okay to accept it, but still, we want to define a level of service our users can expect.
This level of service can be provided through service level indicators, service level objectives, and error budgets. These are based on telemetry (mostly monitoring) information, so the most important thing before adopting an SLO model is to have meaningful, appropriate metrics and a proper and stable monitoring system in place. In this article we won’t discuss monitoring - rather take it as granted, - but keep in mind that you won’t go far in this journey without it.
Terminology 🔗︎
Before jumping into the example, let’s go through the terminology we’ll use throughout the article.
SLI 🔗︎
An SLI is a service level indicator — a carefully defined quantitative measure of some aspect of the level of service that is provided.
The SLI is basically what you measure as a level of service. It can be:
- the success rate of HTTP requests,
- the percentage of requests below a certain latency threshold,
- the fraction of time when a service is available, or
- any other metrics that somehow describe the state of the service.
It’s usually a good practice to formulate the SLI as the ratio of two numbers: the good events divided by the total events. This way the SLI value will be between 0 and 1 (or 0% and 100%), and it’s easily matched to the SLO value that’s usually defined as a target percentage over a given timeframe. The previous examples are all following this practice.
SLO 🔗︎
An SLO is a service level objective: a target value or range of values for a service level that is measured by an SLI.
The SLO is the minimum level of reliability that the users of your service can expect. Above this level, your users are generally happy about the reliability, below that they will probably start to complain, or even pick another service instead of yours. Of course, this is a major simplification and only true if you are able to find the optimal SLO value by taking into account a lot of details about its users and the service itself.
Let’s say you want to have an 99.9% HTTP success rate, then your SLO is 99.9%. An important aspect of the SLO is the period where it’s interpreted. An SLO can be defined for a rolling period, or for a calendar window. Usually, an SLO refers to a longer period, like a month, or 4 weeks. It’s a hard task to properly define both the SLO goal and the period, and it involves looking at historical metrics, or simply intuition while taking into account the particularities of your service. It’s always a good practice to continuously improve your SLOs based on the current performance of your system.
Compliance 🔗︎
Compliance is the current level of your service, measured by the SLI.
Compliance measures the current performance of the system and is measured against your SLO. For example, if you have a 99.9% SLO goal for a 4 week period, then compliance is the exact measurement based on the same SLI, let’s say 99.98765%.
Error budget 🔗︎
The error budget provides a clear, objective metric that determines how unreliable the service is allowed to be within a period of time.
The remaining error budget is the difference between the SLO and the actual compliance in the current period. If you have an SLO of 99.9% for a certain period, you have an error budget of 0.1% for that same period. If the compliance is 99.92% at the end of the period, it means that the remaining error budget is 20%. Or without speaking only in percentages: if you expect 10 million requests this month, and you have a 99.9% SLO, then you’re allowed 10.000 requests to fail. These 10.000 requests are your error budget. If a single event causes 2.000 requests to fail, it burned through 20% of your error budget.
Burn rate 🔗︎
Burn rate is how fast, relative to the SLO, the service consumes the error budget.
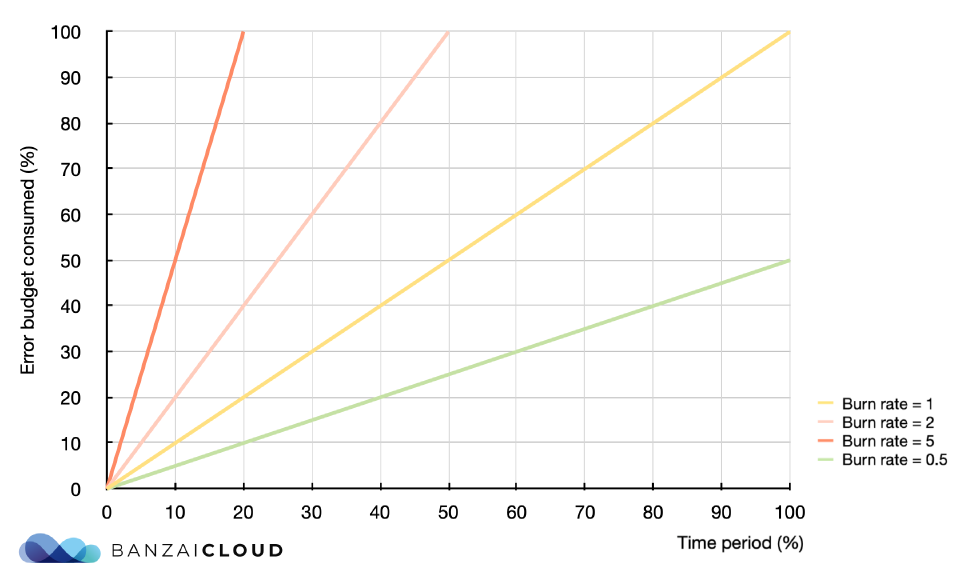
A burn rate of 1 for the whole SLO period means that we’ve burned through exactly 100% of our error budget during that period. A burn rate of 2 means that we’re burning through the budget twice as fast as allowed, so we’ll exhaust our budget at halftime of the SLO period, or that we’ll have twice as many failures as allowed by the SLO by the end of the period. The burn rate can be interpreted even for a shorter period than your SLO period, and it is what serves as the base idea for a good alerting system. We’ll talk about burn rates in more detail in the alerting section of this article, and also in the Burn Rate Based Alerting Demystified post of this series.
An SLO implementation example 🔗︎
Basics 🔗︎
If you’re a regular reader of this blog, it should not come as a surprise that we’re bringing an example that somehow involves Istio. Don’t be scared, the example is easy to understand without knowing Istio, and stands on its own without it. The only thing we’ll use is that Istio (and Envoy) provide unified HTTP metrics for services in the mesh, so the metric names and labels will follow that convention. We’ll also use Prometheus expressions, but these can be easily transplanted to other monitoring solutions.
The istio_requests_total Prometheus metric is a counter that is incremented when a request is handled by an Istio proxy. It tells how many requests have a specific service processed. It also has some labels to differentiate between services, destination_service_name and destination_service_namespace tells the target Kubernetes services apart.
To get the requests per second rate received by a specific service in the last hour, you would need a Prometheus query like this:
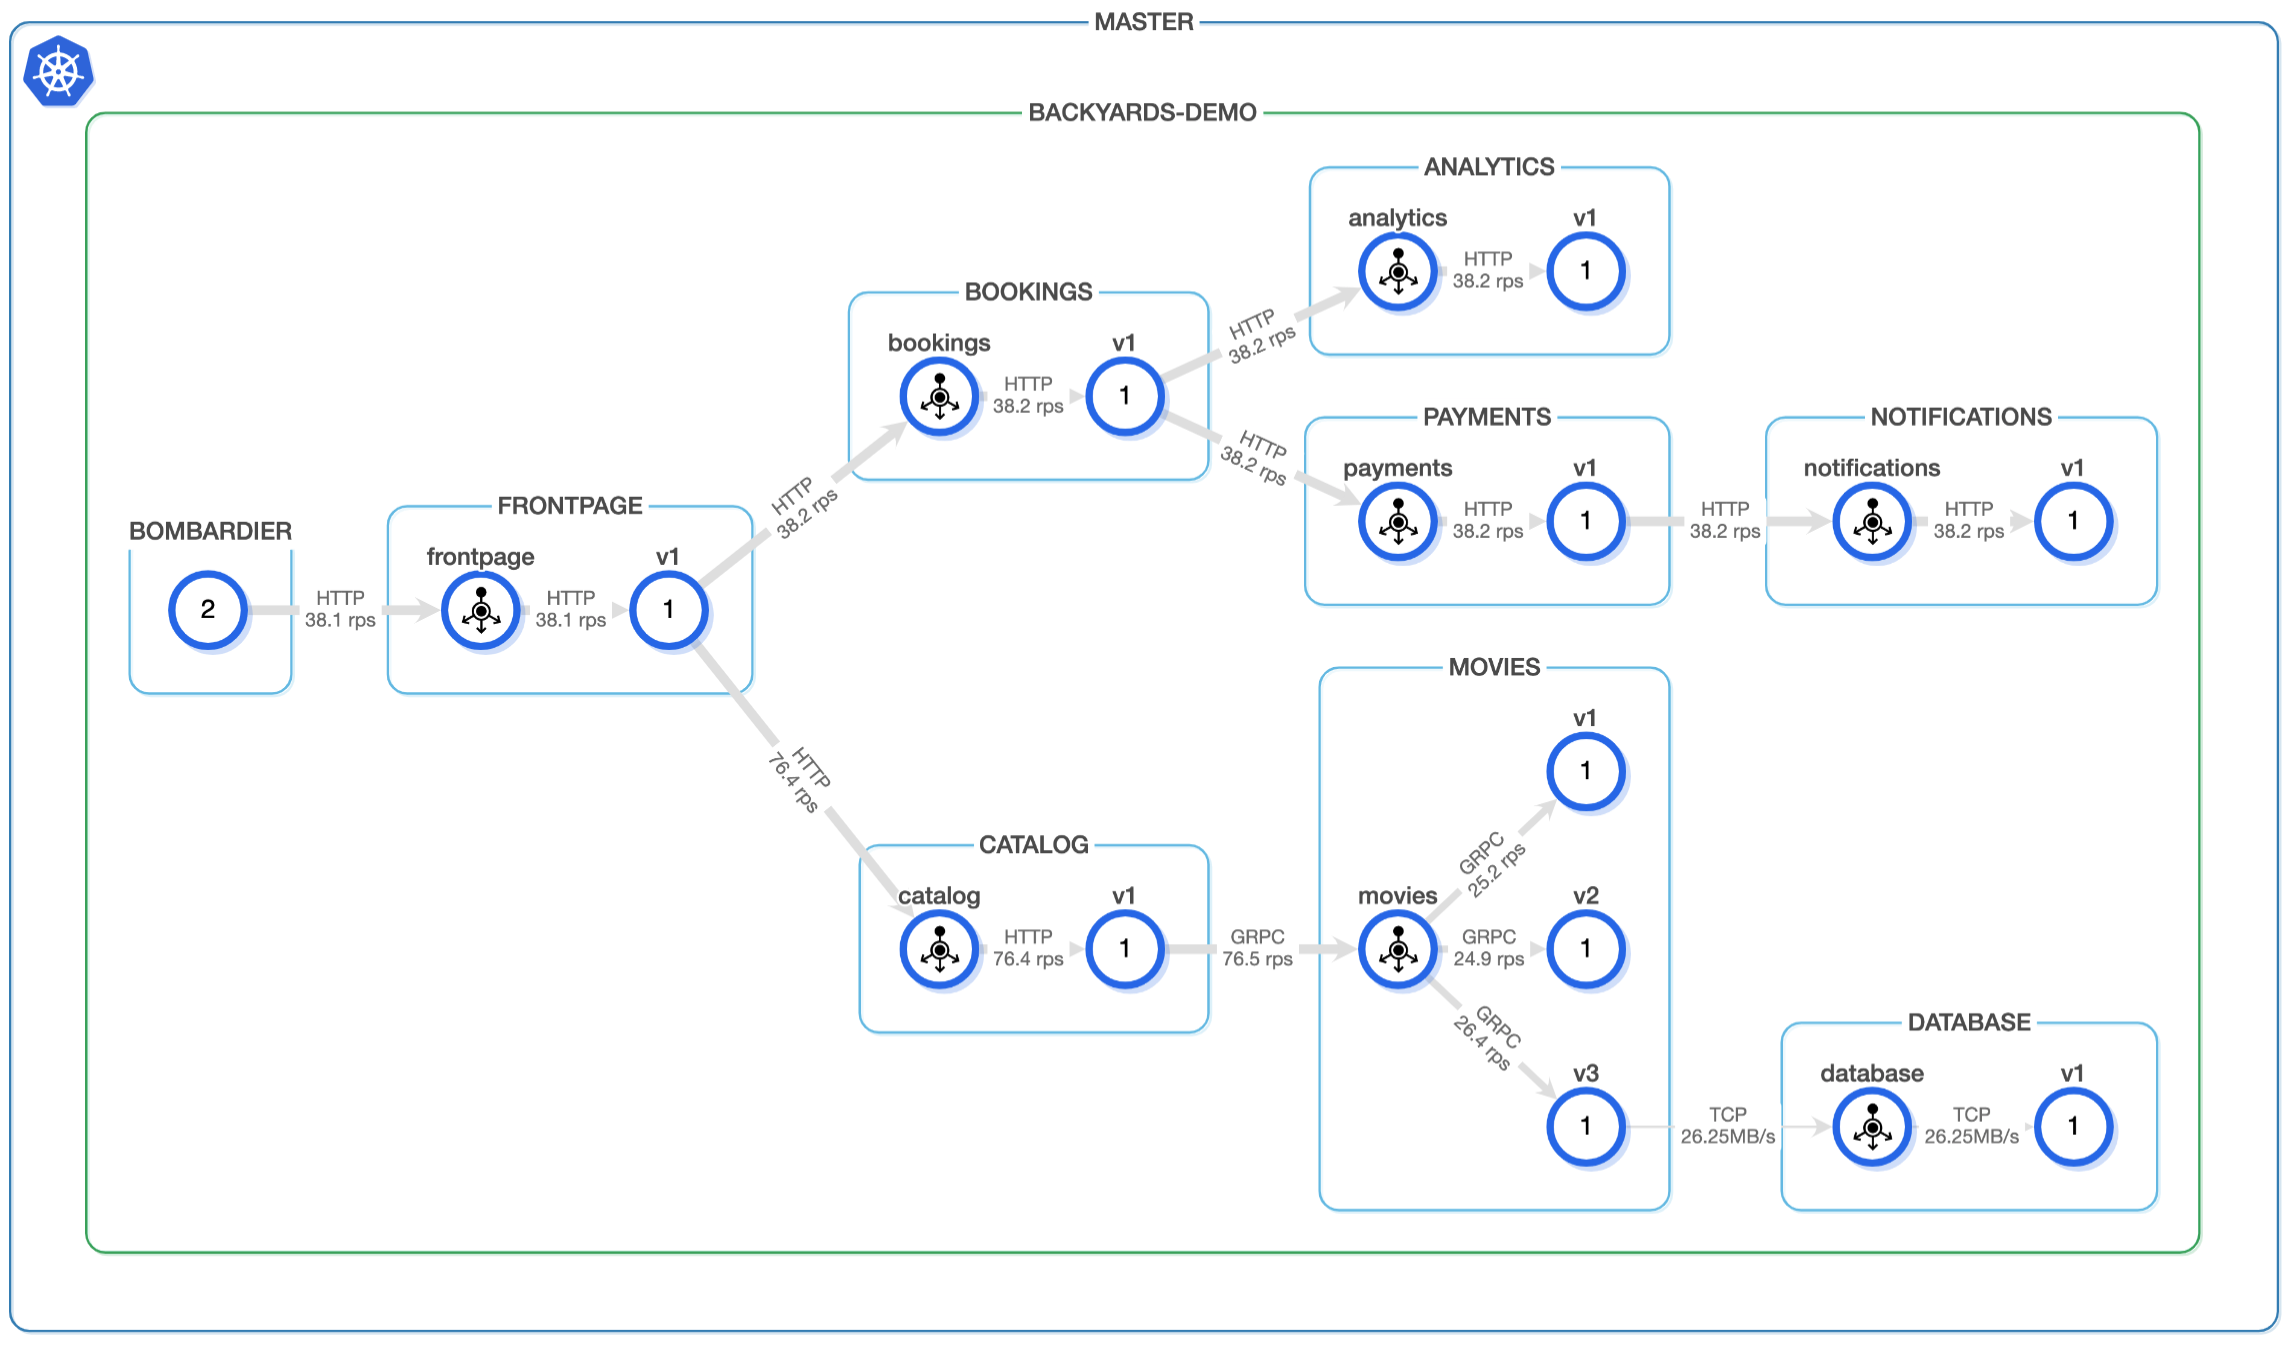
sum(rate(istio_requests_total{reporter="source", destination_service_namespace="backyards-demo", destination_service_name="catalog"}[1h]))
The
reporterlabel is specific to Istio. An HTTP request in a mesh goes through two different proxies, one of these is a sidecar of the source workload, the other one is the sidecar of the receiving (destination) workload. Both of these proxies report similar metrics,reporter="source"means that we’re relying on the metrics provided by the source Envoy proxy.
Constructing the SLI 🔗︎
The query above can be used to see the rate of traffic flowing to a service, but it’s not an SLI yet. As the Google SRE book suggests, a good SLI is usually a ratio of two numbers: the number of good events divided by the total number of events. A common SLI based on request counter metrics is the HTTP success rate.
The HTTP success rate can be defined as the ratio of requests with a non-5xx HTTP response code and the total number of requests. The following PromQL query will yield the HTTP success rate for the last hour:
sum(rate(istio_requests_total{reporter="source", destination_service_namespace="backyards-demo", destination_service_name="catalog", response_code!~"5.."}[1h]))
/
sum(rate(istio_requests_total{reporter="source", destination_service_namespace="backyards-demo", destination_service_name="catalog"}[1h]))
Defining and tracking the SLO 🔗︎
An SLO is a target value that SLI is measured against. In our example, the target value of the HTTP success rate can be 99%. When defining an SLO you need to decide on two things:
- the SLO target
- and the time interval where the SLO is interpreted.
Defining, and later continuously reviewing and refining these values is probably the most important task when dealing with SLOs. The Google SRE books have complete chapters dealing with the questions that arise when constructing an SLO. We recommend reading Chapter 4 of the SRE book, and Chapter 2 of the SRE workbook to have a better understanding.
In this article we’re focusing on the implementation itself, so let’s say that our goal is to have a 99.9% HTTP request success rate for a rolling window period of 7 days. To retrieve the compliance for the whole SLO period, our SLI Prometheus query can be modified to show the success rate for the last 7 days, instead of 1 hour:
sum(rate(istio_requests_total{reporter="source", destination_service_namespace="backyards-demo", destination_service_name="catalog", response_code!~"5.."}[168h]))
/
sum(rate(istio_requests_total{reporter="source", destination_service_namespace="backyards-demo", destination_service_name="catalog"}[168h]))
To retrieve the error rate for the whole SLO period, just extract the result from 1:
1 - (sum(rate(istio_requests_total{reporter="source", destination_service_namespace="backyards-demo", destination_service_name="catalog", response_code!~"5.."}[168h]))
/
sum(rate(istio_requests_total{reporter="source", destination_service_namespace="backyards-demo", destination_service_name="catalog"}[168h])))
The 99.9% SLO goal means that we’re allowing for a 0.1% error budget. If the error rate is exactly 0.1%, then 100% of the error budget will be consumed by the end of the SLO period. The burn rate denotes how fast, (relative to the SLO) the service consumes the error budget, so for the whole period it’s error_rate/error_budget. Let’s see a few examples of potential error budget consumptions and corresponding burn rates for the whole SLO period (error rate and error budget values are added in percentage notation to make it easier to follow, but note that the Prometheus expression above returns a rate instead of a percentage):
| Error rate | Error budget | Error budget consumption | Burn rate |
|---|---|---|---|
| 0.1% | 0.1% | 100% | 1 |
| 0.03% | 0.1% | 30% | 0.3 |
| 0.5% | 0.1% | 500% | 5 |
| 0.1% | 0.2% | 50% | 0.5 |
| 0.3% | 0.2% | 150% | 1.5 |
Alerting on the SLO 🔗︎
So far we’ve put together some PromQL queries to track the SLOs and measure the reliability of some services, but we haven’t done anything to enforce it. The usual way of enforcing these SLOs is to turn them into alerting rules, so an SRE will know when something goes wrong, and that they need to take action. Chapter 5 of the SRE workbook does a great job explaining different alerting techniques along with their advantages and shortcomings.
As explained in the SLO section, there is no silver bullet to constructing alerting rules either. It always depend on the service, the amount of traffic it receives, or the distribution of that traffic. When constructing an alerting rule you should take these things into account. But the alerting rules described here are very similar to the ones in the Google SRE workbook, and these kind of rules are well-tried at some other companies, like SoundCloud.
We won’t go through every iteration mentioned in the SRE workbook, but we’re starting with the most trivial one that comes into everyone’s mind first, to be able to discuss its shortcomings.
We’ll use the SLI example from above, but we’ll refer to it as a recording rule to make the alerting rules more compact. For example, the error rate SLI for the catalog service and a 1 hour period is referred to as
catalog:istio_requests_total:error_rate1h
The naive alerting rule 🔗︎
If our SLO is 99.9%, it seems to be a good idea to alert when the current error rate for a shorter time period (10mins, 1h, etc.) exceeds 0.1%. It’s very simple to write it down as a Prometheus expression:
- alert: SLOErrorRateTooHigh
  expr: catalog:istio_requests_total:error_rate1h >= 0.001
But what’s the main problem with this kind of alerting rule? It’s that the precision of this alert is very low. If our period is one week, and we have a 1 hour period every day when the error rate is 0.1%, the SREs will get an alert every day, even though we’ve only consumed 1/24 of our error budget. In general it means lots of false positive alert triggers, even when the SLO goal is not threatened at all.
These kind of basic alerts are quite common in production systems, and they aren’t necessarily bad. It’s possible that they work just fine for a simpler system, and you don’t need SLO based alerts at all. SLO based alerting usually comes into the picture at scale, where you can’t avoid failures purely because of the size of the system, and these kind of alerts are producing too much noise. But if your site is served by a single web server, don’t overcomplicate things, just stick with your alerts that may be as simple as pinging that server and firing an alert if it’s unreachable.
Alerting on burn rate 🔗︎
The SRE workbook details some intermediate steps, but the big idea of improving our alerting is to alert on burn rate. We were talking about burn rates in the SLO section, it says how fast we’re burning through the error budget. If viewed as a mathematical operation, it’s basically the slope of a linear function, where the x-axis denotes the time passed, and the y-axis denotes the error budget consumed in that time period:
burn_rate = error_budget_consumed(%) / time_period(%)
When constructing an alert, it should be along the lines of: “I want to know if x% of my error budget is consumed in a period of time”.
Again, let’s see a few examples:
| Error budget consumed | SLO period | Alert window | Alert window/SLO Period(%) | Burn rate |
|---|---|---|---|---|
| 2% | 30d | 1h | 1/720 * 100 | 14.4 |
| 5% | 30d | 6h | 6/720 * 100 | 6 |
| 10% | 30d | 3d | 72/720 * 100 | 1 |
| 2% | 7d | 12m | 0.2/168 * 100 | 16.8 |
| 5% | 7d | 1h | 1/168 * 100 | 8.4 |
| 1/7*100% | 7d | 1d | 24/168 * 100 | 1 |
By knowing these burn rates, you can start constructing alerts like the following (assuming the 99.9% SLO):
- alert: SLOBurnRateTooHigh
  expr: catalog:istio_requests_total:error_rate1h >= 14.4 * 0.001
Adding one burn rate alert is never enough. You may add one with a 1 hour window, and a 14.4 burn rate, and you’ll never know if your burn rate was 12 for the complete SLO period. That’s why you’ll need to add multiple. Usually three of these should do the trick:
- one with a shorter window, and a relatively larger burn rate
- one with a medium sized window and a medium burn rate, and
- one with a longer alert window and a burn rate of 1.
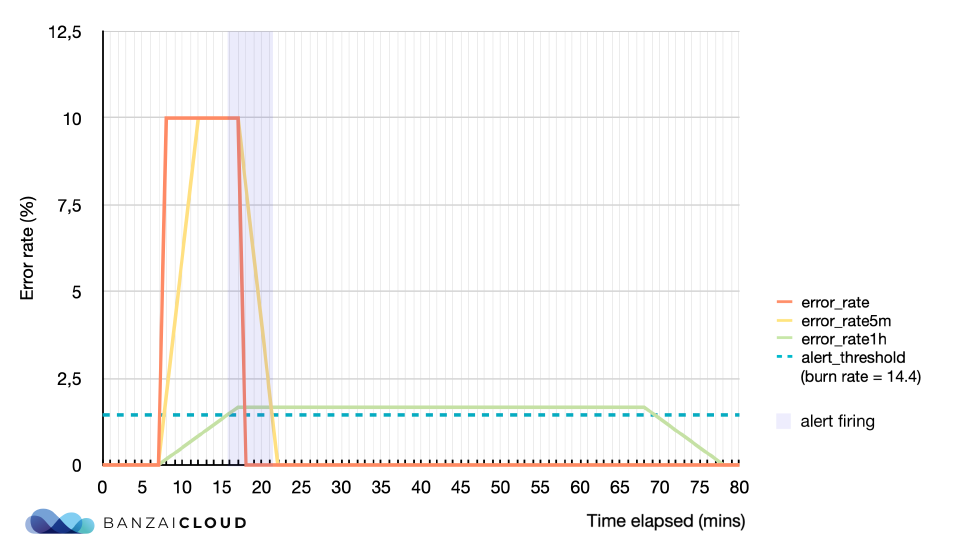
This approach is quite good, it only lacks a good reset time. The reset time is the time needed for the alert to stop firing, once the issue is resolved. If the reset time is too long, it can lead to confusion or mask subsequent errors in the service. An extreme example is when you have a 5 minute spike in a 30 days SLO period when the service is completely unavailable (error rate is 1, burn rate is 1000, error budget consumed is ~11.5%), and your alert with a 3 day window will keep on firing in the next 3 days, until the spike moves out of the alert window.
The solution that’s usually proposed is to have a shorter, secondary window for every burn rate alert. It will notify us if the error budget is still actively being consumed. This shorter, control window is changing our PromQL expression like this:
- alert: SLOBurnRateTooHigh
  expr:   catalog:istio_requests_total:error_rate1h >= 14.4 * 0.001
        and
          catalog:istio_requests_total:error_rate5m >= 14.4 * 0.001
A good rule of thumb is to make the control window 1/12 the duration of the longer window. So in our above example, the shorter window for the 3 days alert window is 72/12=6hours, and it will change the reset time from 3 days to 6 hours.
Here’s another example visually displayed:
SLOs and Backyards 🔗︎
Defining a good framework for SLOs is not an easy task, especially if your services emit different metrics, or do not have proper metrics at all. A service mesh is a great tool to have unified networking observability for your microservices without changing a single line of code in the applications. If you have a production-ready monitoring system set up, then it’s only a step further to have unified SLOs as well.
With Backyards (now Cisco Service Mesh Manager), you already have
- an enterprise grade Istio distribution,
- a production ready monitoring system built on Prometheus, and
- a UI that displays real time information about the traffic between services.
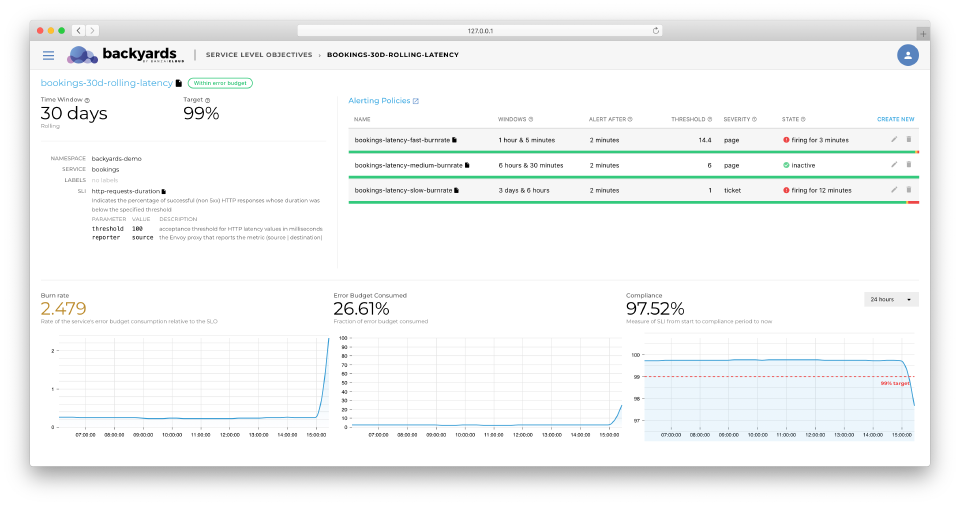
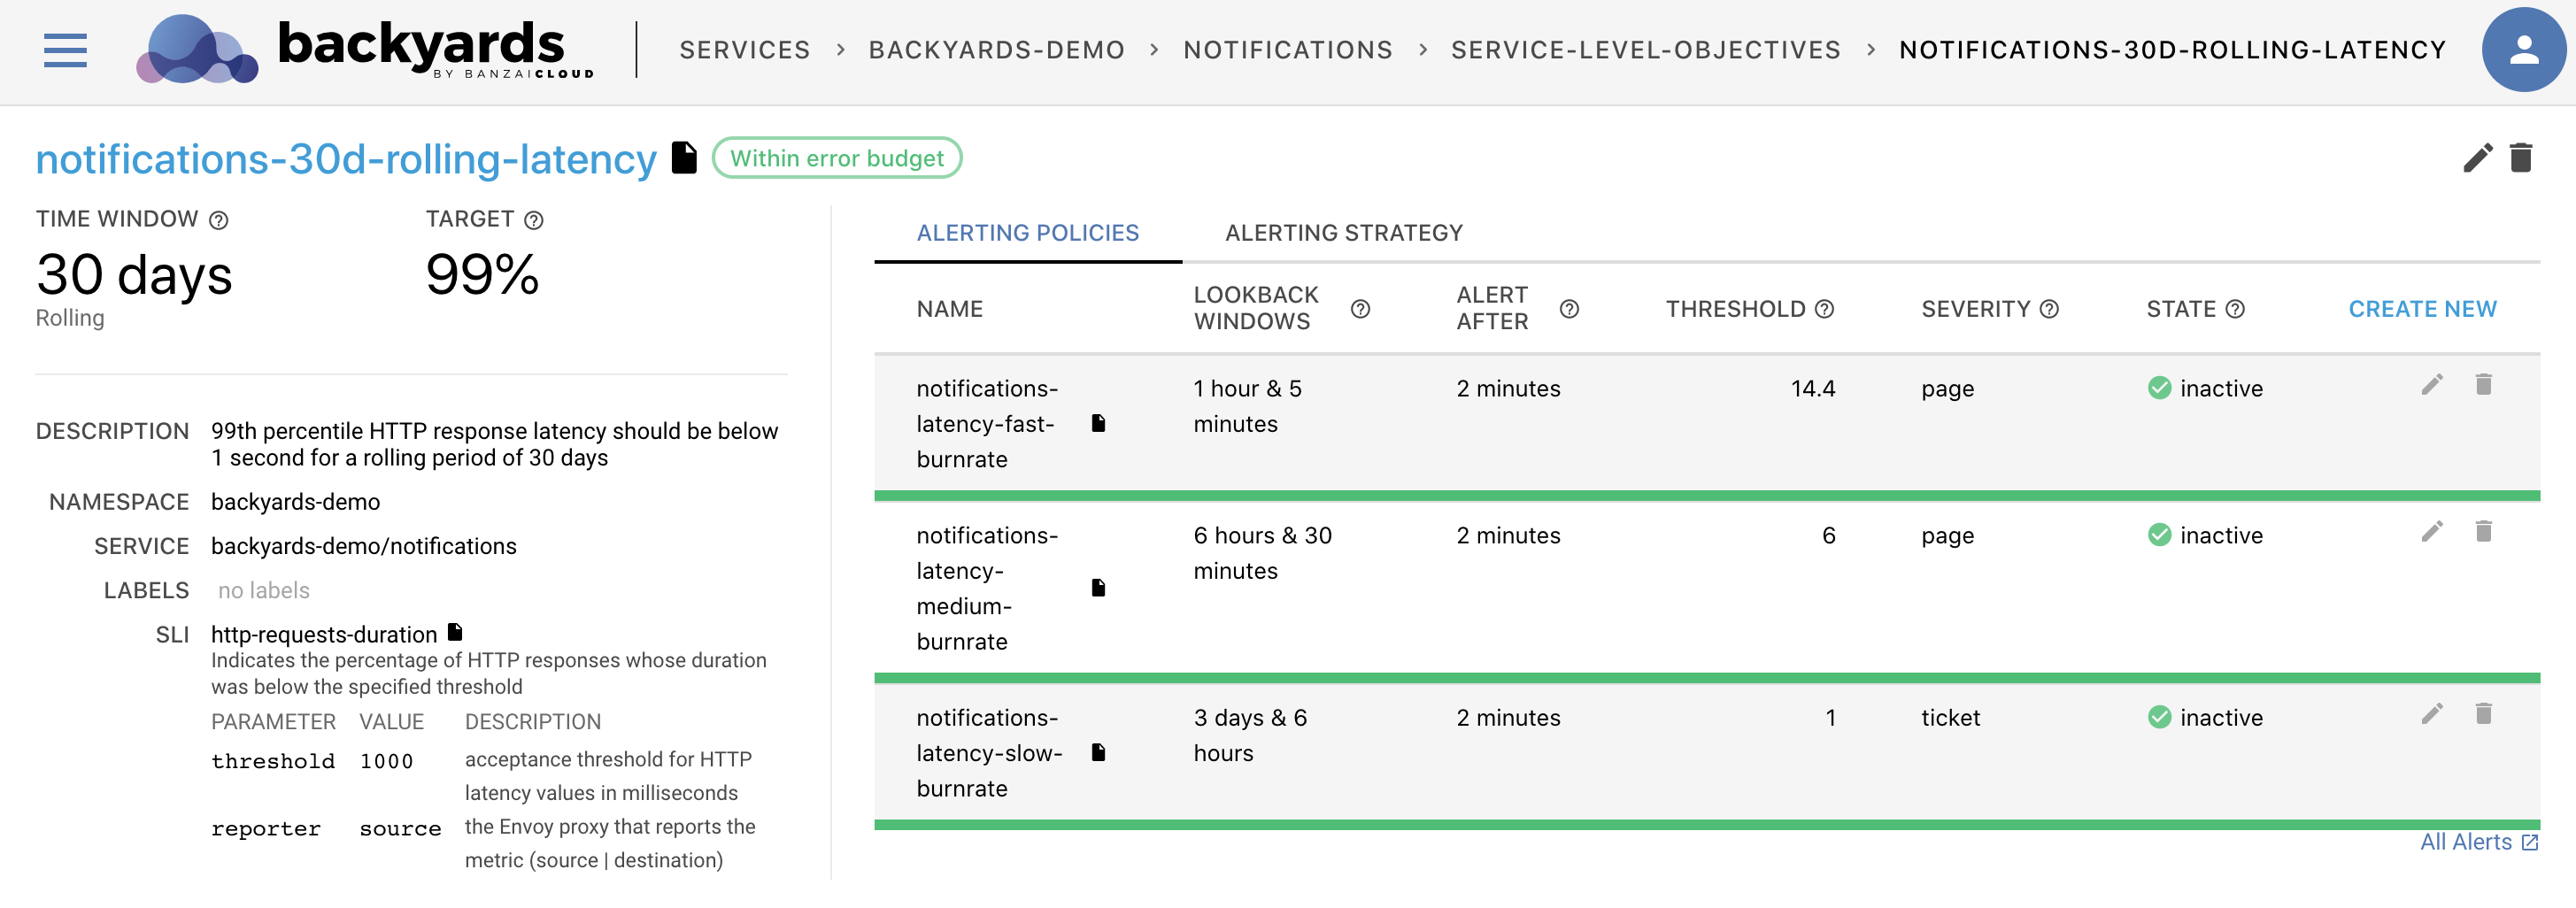
It seemed like a natural step to move towards a higher level, SRE-focused dashboard with Backyards (now Cisco Service Mesh Manager). In the Backyards 1.4 release, we have introduced a new feature that makes it easy to design and track SLOs from the Backyards (now Cisco Service Mesh Manager) dashboard, or using Kubernetes custom resources.
Conclusion 🔗︎
SLOs, error budgets and alerting on burn rate are great tools to control how your services are doing, to see if they are meeting the expected requirements of its users, and to ensure that it will stay like this in the medium to long term. These concepts are widely applicable to all kinds of services, but designing SLOs and alerts should be a thoughtful process, and something that needs to be reviewed continuously. If you’re doing it good, SLOs should be decision factors in risk management instead of statistical numbers about your services. And one last thing: keep in mind that (probably) you are not Google, and you should keep it simple until it’s not absolutely necessary to change.
If you are interested in burn-rate alerting, read the Burn Rate Based Alerting Demystified post of this series, or learn how you can create your own Service Level Indicator templates from the Defining application level SLOs using Backyards blog post.
About Backyards 🔗︎
Banzai Cloud’s Backyards (now Cisco Service Mesh Manager) is a multi and hybrid-cloud enabled service mesh platform for constructing modern applications. Built on Kubernetes, our Istio operator and the Banzai Cloud Pipeline platform gives you flexibility, portability, and consistency across on-premise datacenters and on five cloud environments. Use our simple, yet extremely powerful UI and CLI, and experience automated canary releases, traffic shifting, routing, secure service communication, in-depth observability and more, for yourself.


