Istio, and in general the service mesh has changed the way of service to service communication (from dumb pipes and smart endpoints to sidecar-to-sidecar). While this has lots of benefits, it can increase the complexity of troubleshooting microservice to microservice communication. One of the typical places developers are checking when comes to troubleshoot is the Envoy sidecar proxy container’s access logs, both on the source and destination side. With the increased number of microservices deployed to distributed environments, this process can be tedious, and it’s very inconvenient trying to pair source and destination access log pairs.
In this post, we’re introducing a new Banzai Cloud Backyards 1.1 feature, called Traffic Tap which allows you to stream Envoy access logs.
Traffic tap - capture Istio sidecar proxy access logs 🔗︎
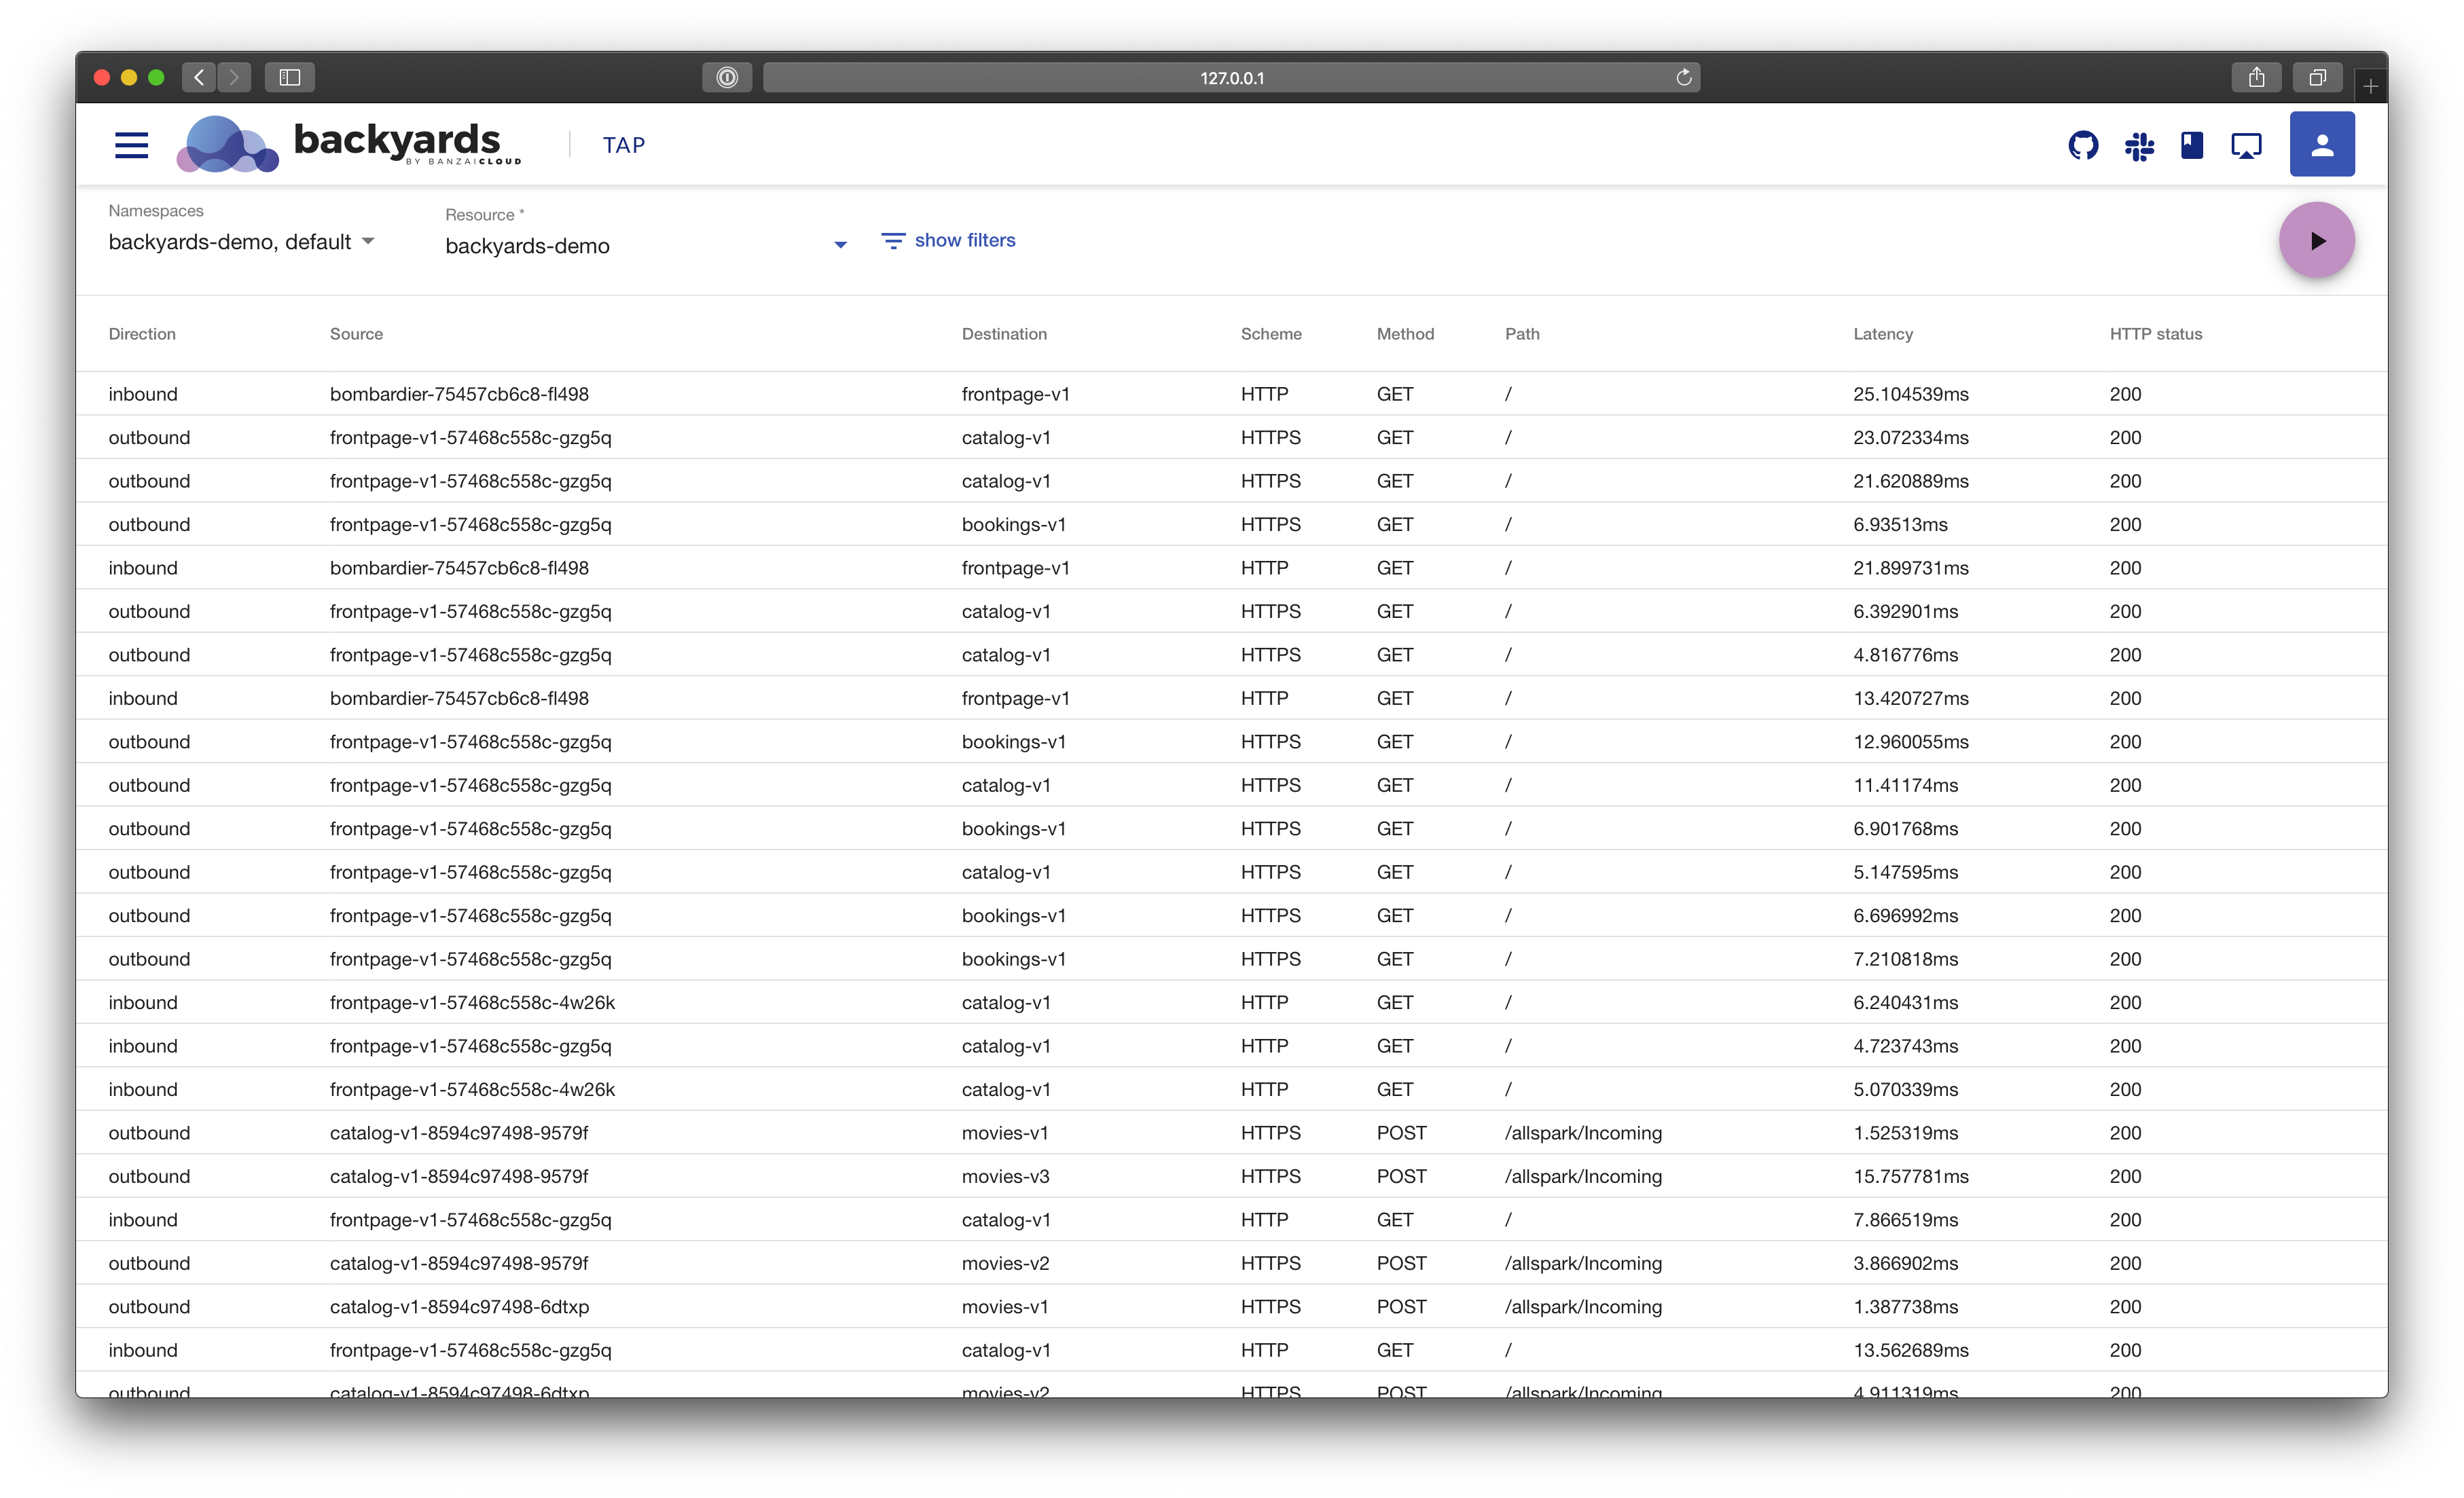
The traffic tap feature of Banzai Cloud Backyards 1.1 enables you to monitor live access logs of the Istio sidecar proxies. This can help debugging the communication between services, and enriches the already existing robust observability features brought by Banzai Cloud Backyards (drill down, monitoring, logs and traces). It is an additional and highly configurable observability tool, a reliable disaster mitigation feature.
Each sidecar proxy outputs access information for the individual HTTP requests or HTTP/gRPC streams. For example, there will be two log entries for in-mesh communication on both ends of the request. Outbound direction means that the log entry was generated on the sending end, while inbound was generated on the receiving end of a request/response exchange or connection.
The access logs contain information about the:
- reporter proxy,
- source and destination workloads,
- request,
- response, as well as the
- timings.
Backyards aggregate these entries into a single stream of logs.
Try it out! 🔗︎
The following procedure walks you through the process of:
- creating a cluster,
- installing Backyards (now Cisco Service Mesh Manager),
- creating a service mesh for the cluster, and
- testing all the traffic tap features on the service mesh (using the Backyards UI or the command line).
You can test all this for yourself in less than 15 minutes, which includes the time it takes to install Istio.
Create a cluster 🔗︎
To test Backyards, you’ll need a Kubernetes cluster.
I created a Kubernetes cluster on AWS, using Banzai Cloud’s lightweight, CNCF-certified Kubernetes distribution, PKE via the Banzai Cloud Pipeline platform.
If you’d like to do likewise, create your clusters on any of the several cloud providers we support, or on-premises using the free version of Banzai Cloud’s Pipeline platform.
Install Backyards 🔗︎
The easiest way to install Istio and a demo application on a new cluster is to install Backyards (now Cisco Service Mesh Manager) by using the Backyards CLI.
-
Make sure that
KUBECONFIGis set for the cluster where you want to test Istio. -
Register for the free version and run the following command to install the CLI tool, then watch as Backyards starts a brand new production-ready Istio cluster in just a few minutes!
This command first installs Istio with the open-source Banzai Cloud Istio operator, then installs Backyards (now Cisco Service Mesh Manager) itself as well as a demo application. After the installation of each component has finished, the Backyards UI will automatically open and send some traffic to the demo application.
Tap into traffic 🔗︎
You can watch the access logs for an individual namespace, workload or pod by using the tap command of the Backyards command-line tool:
# Usage:
#  backyards tap [[ns|workload|pod]/resource-name] [flags]

# tap the backyards-demo namespace
backyards tap ns/backyards-demo

# tap the bookings-v1 workload in the backyards-demo namespace
backyards tap --ns backyards-demo workload/bookings-v1

# tap a pod of the bookings app in the backyards-demo namespace
POD_NAME=$(kubectl get pod -n backyards-demo -l app=bookings -o jsonpath="{.items[0]..metadata.name}")
backyards tap --ns backyards-demo pod/$POD_NAME
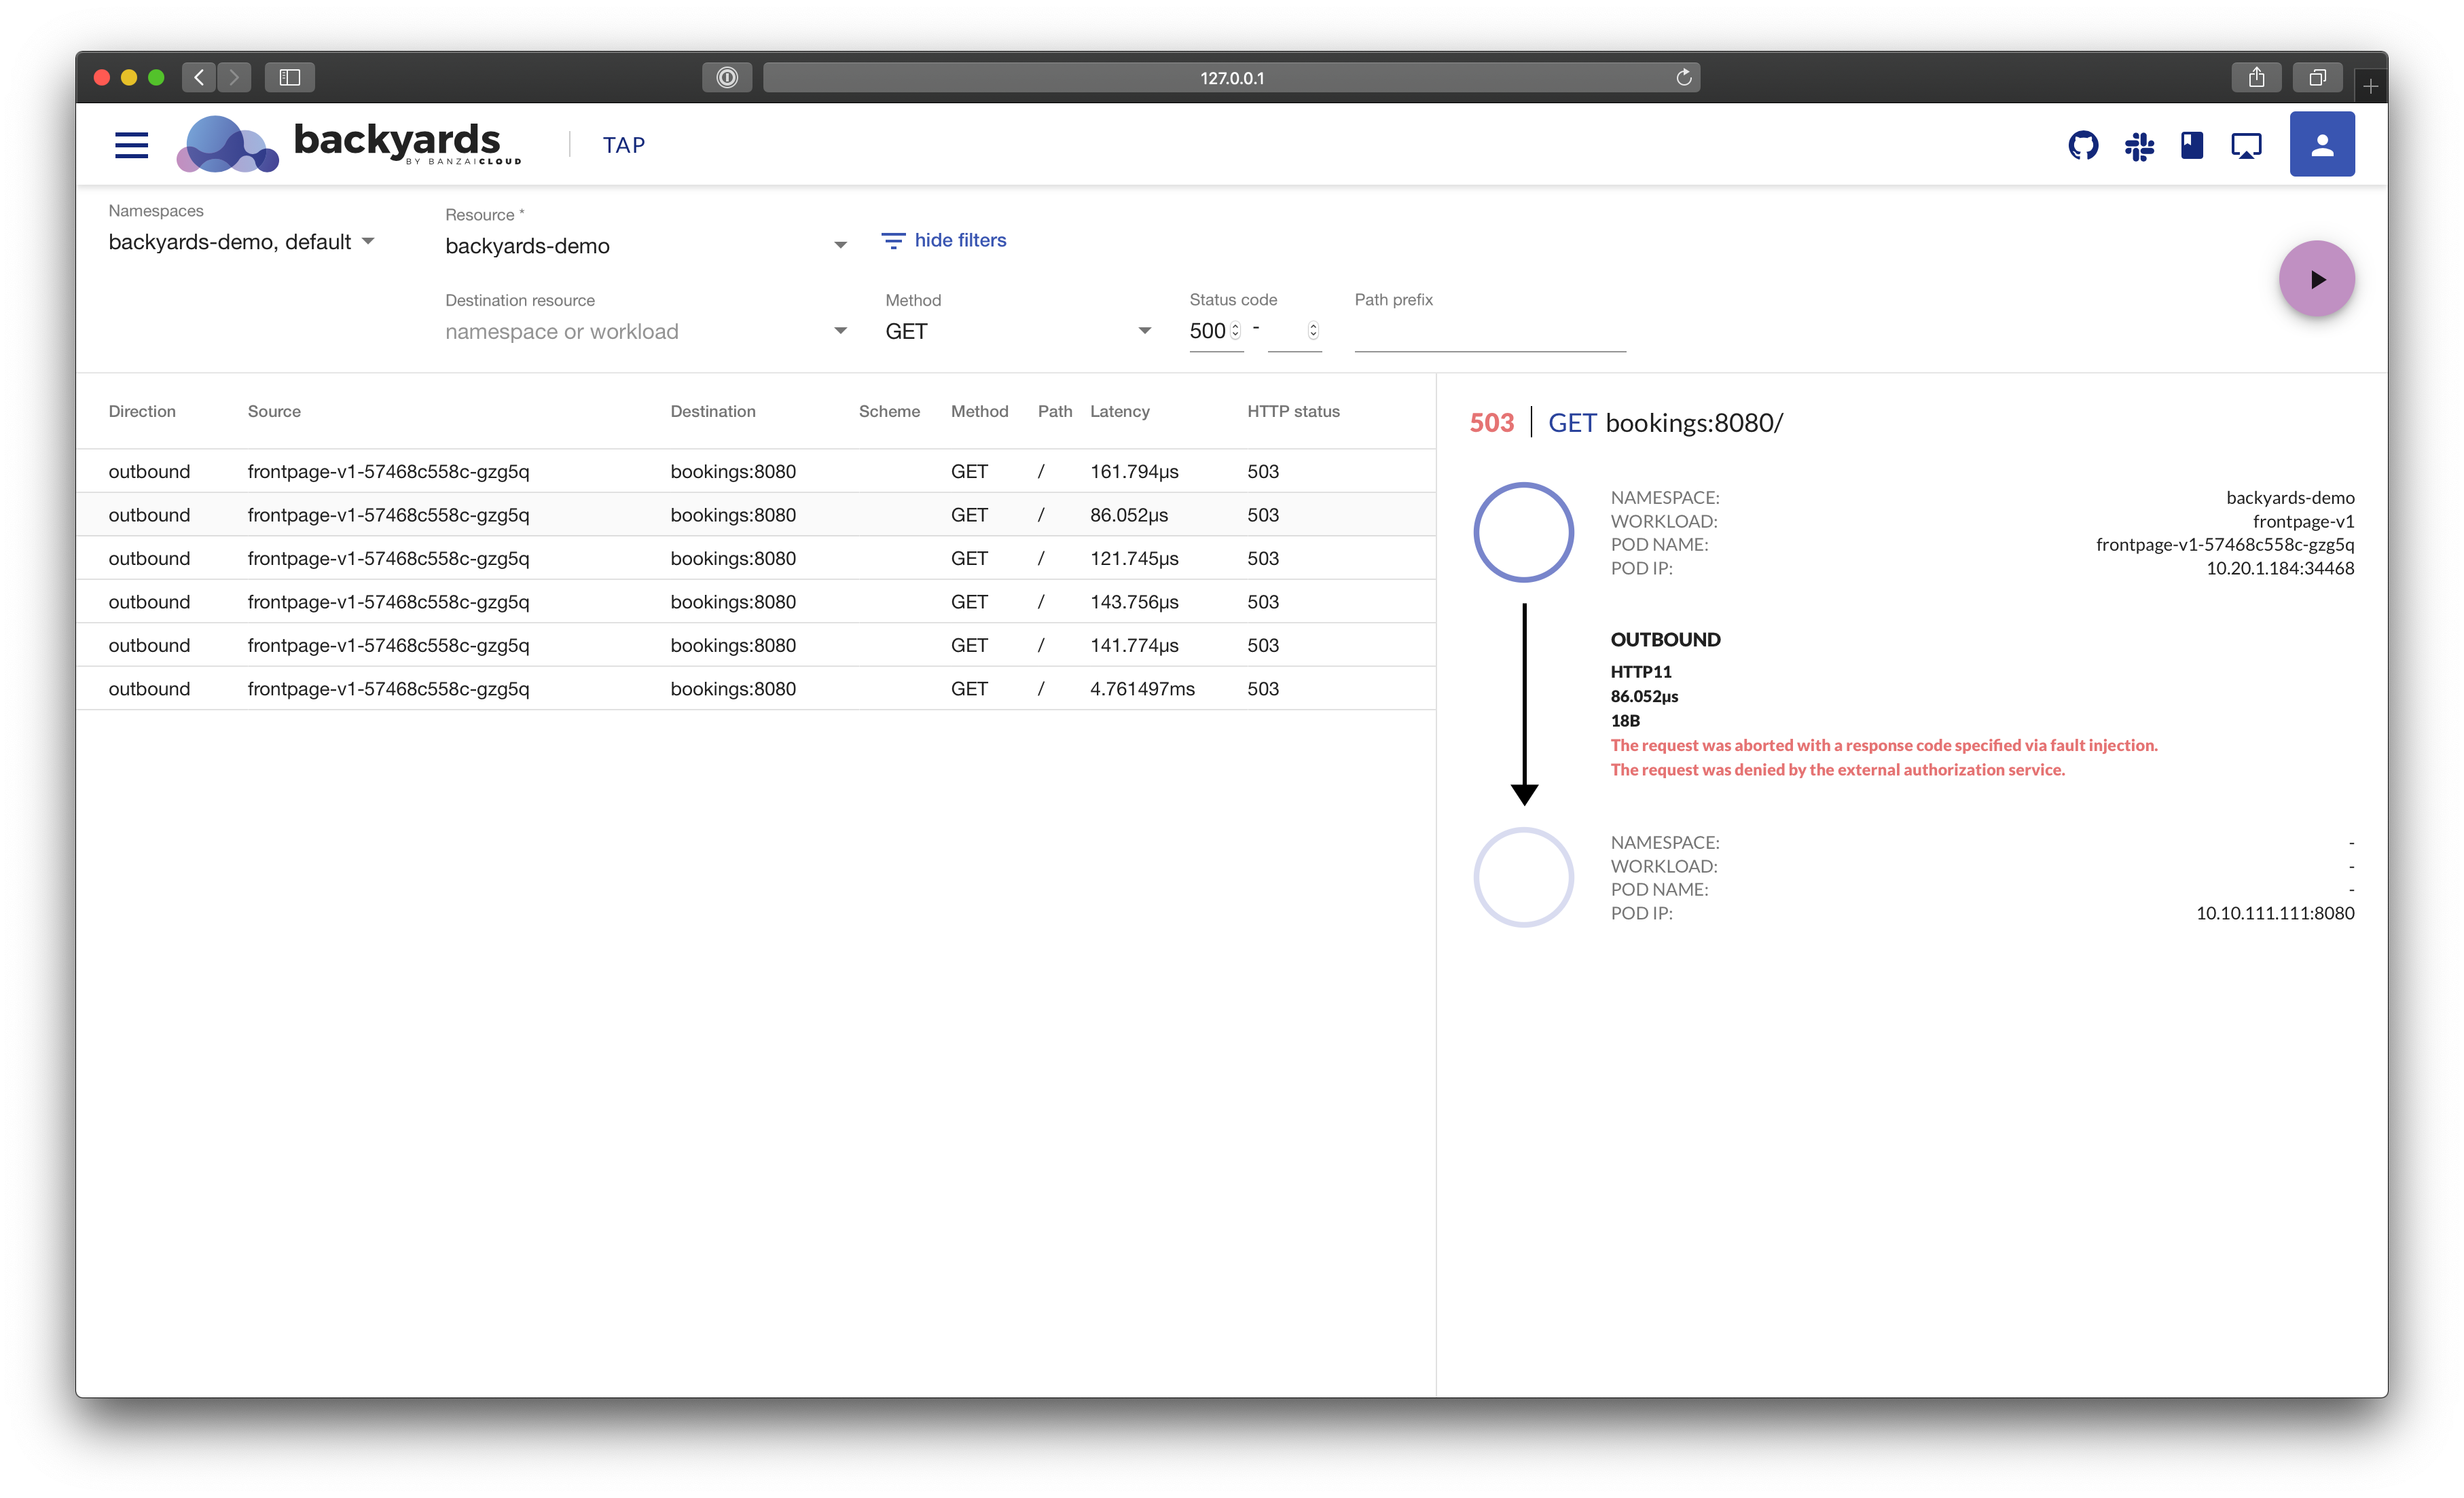
Similarly, you can follow the logs on the Backyards UI.

At this volume it’s difficult to find the relevant or problematic log lines. You can use filter flags to narrow them down:
# server errors
backyards tap ns/backyards-demo --method GET --response-code 500,599
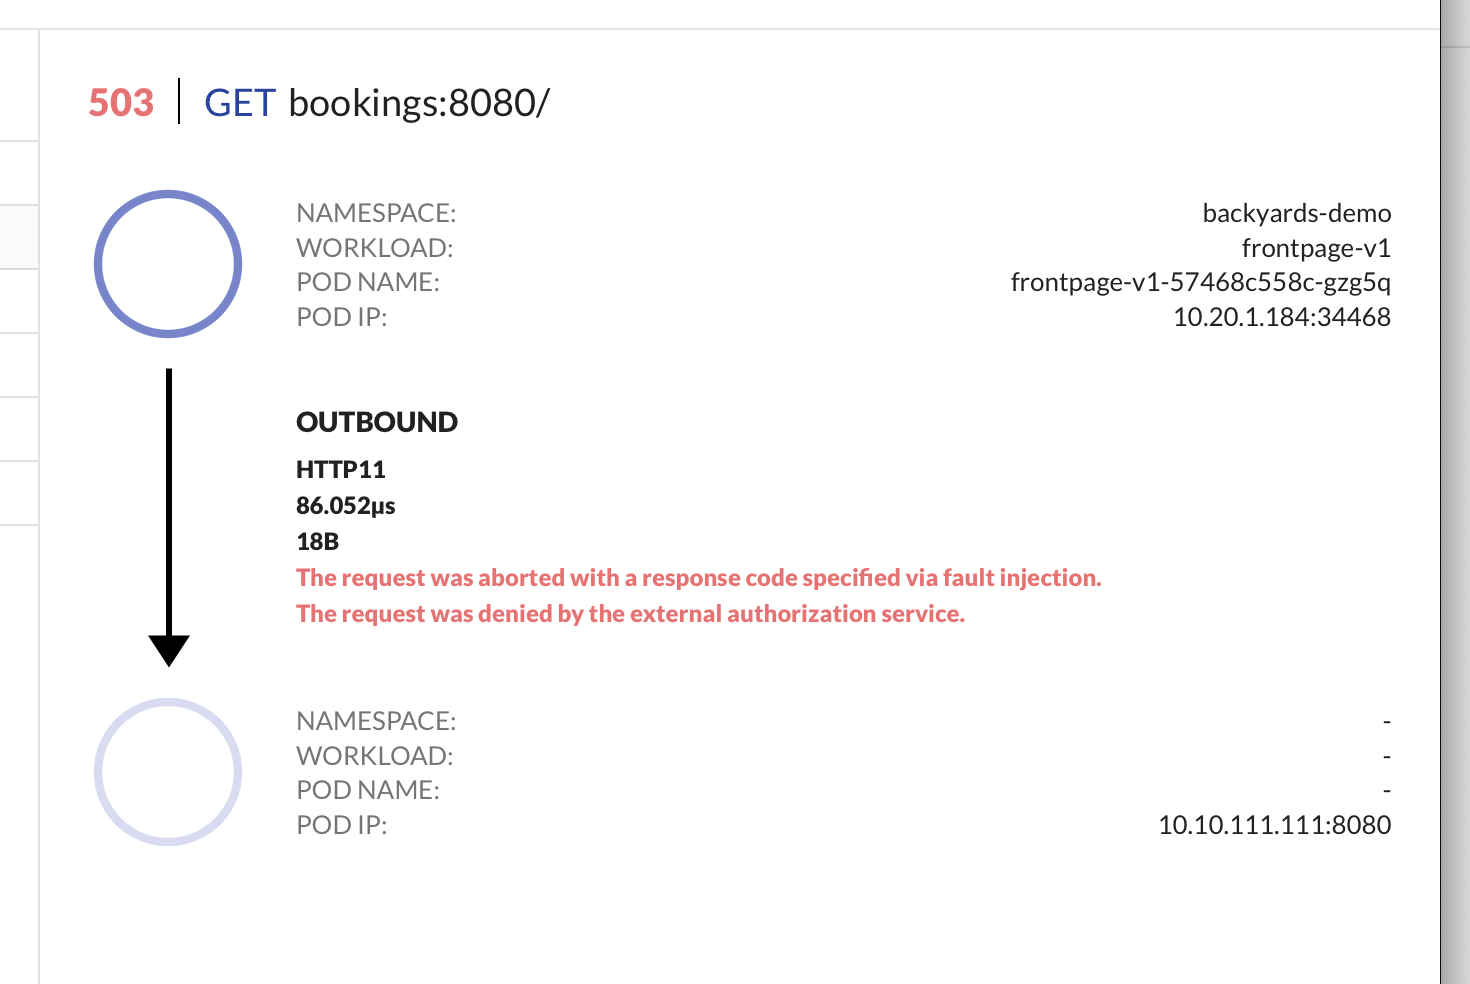
On the Backyards UI, you can see the details of a log in a more visual way.
And here is a zoomed in version.
By changing the output format to JSON, you will be able to use the command line tool jq to further filter or map the log entries:
# get pods with a specific user-agent
backyards tap ns/backyards-demo -o json | jq 'select(.request.userAgent=="grpc-go/1.17.0,fasthttp") | .source.name'
Cleanup 🔗︎
To remove the demo application, Backyards, and Istio from your cluster, run the following command, which removes all of these components in the correct order:
$ backyards uninstall -a
Takeaway 🔗︎
The process of debugging applications in Istio is not a smooth process by default. However, Backyards (now Cisco Service Mesh Manager), the Banzai Cloud operationalized and automated service mesh product built on Istio, helps to stream and pair Envoy access logs to make the debugging process much more convenient for you.
Contact us if you’d like to use Backyards in production.
About Backyards 🔗︎
Banzai Cloud’s Backyards (now Cisco Service Mesh Manager) is a multi and hybrid-cloud enabled service mesh platform for constructing modern applications. Built on Kubernetes, our Istio operator and the Banzai Cloud Pipeline platform gives you flexibility, portability, and consistency across on-premise datacenters and on five cloud environments. Use our simple, yet extremely powerful UI and CLI, and experience automated canary releases, traffic shifting, routing, secure service communication, in-depth observability and more, for yourself.


