Check out Backyards in action on your own clusters!
Want to know more? Get in touch with us, or delve into the details of the latest release.
Or just take a look at some of the Istio features that Backyards automates and simplifies for you, and which we’ve already blogged about.
One of the core features of the Istio service mesh is the observability of network traffic. Because all service-to-service communication is going through Envoy proxies, and Istio’s control plane is able to gather logs and metrics from these proxies, the service mesh can give you deep insights about your network. While a basic Istio installation is able to set up all the components needed to collect telemetry from the mesh, it’s not easy to understand how these components fit together and how to configure them in a production environment. It becomes even more difficult when the mesh expands to multiple clusters across different cloud providers, or in a hybrid or edge-compute environment. This blog post tries to explain how Istio telemetry works and walks through some practical monitoring examples, like configuring Prometheus targets and exploring available metrics. At the end of the post, you’ll get a sneak peak into Banzai Cloud’s new Pipeline component - a multicloud and hybridcloud management platform built on top of our Istio operator.
Mixer and Envoys 🔗︎
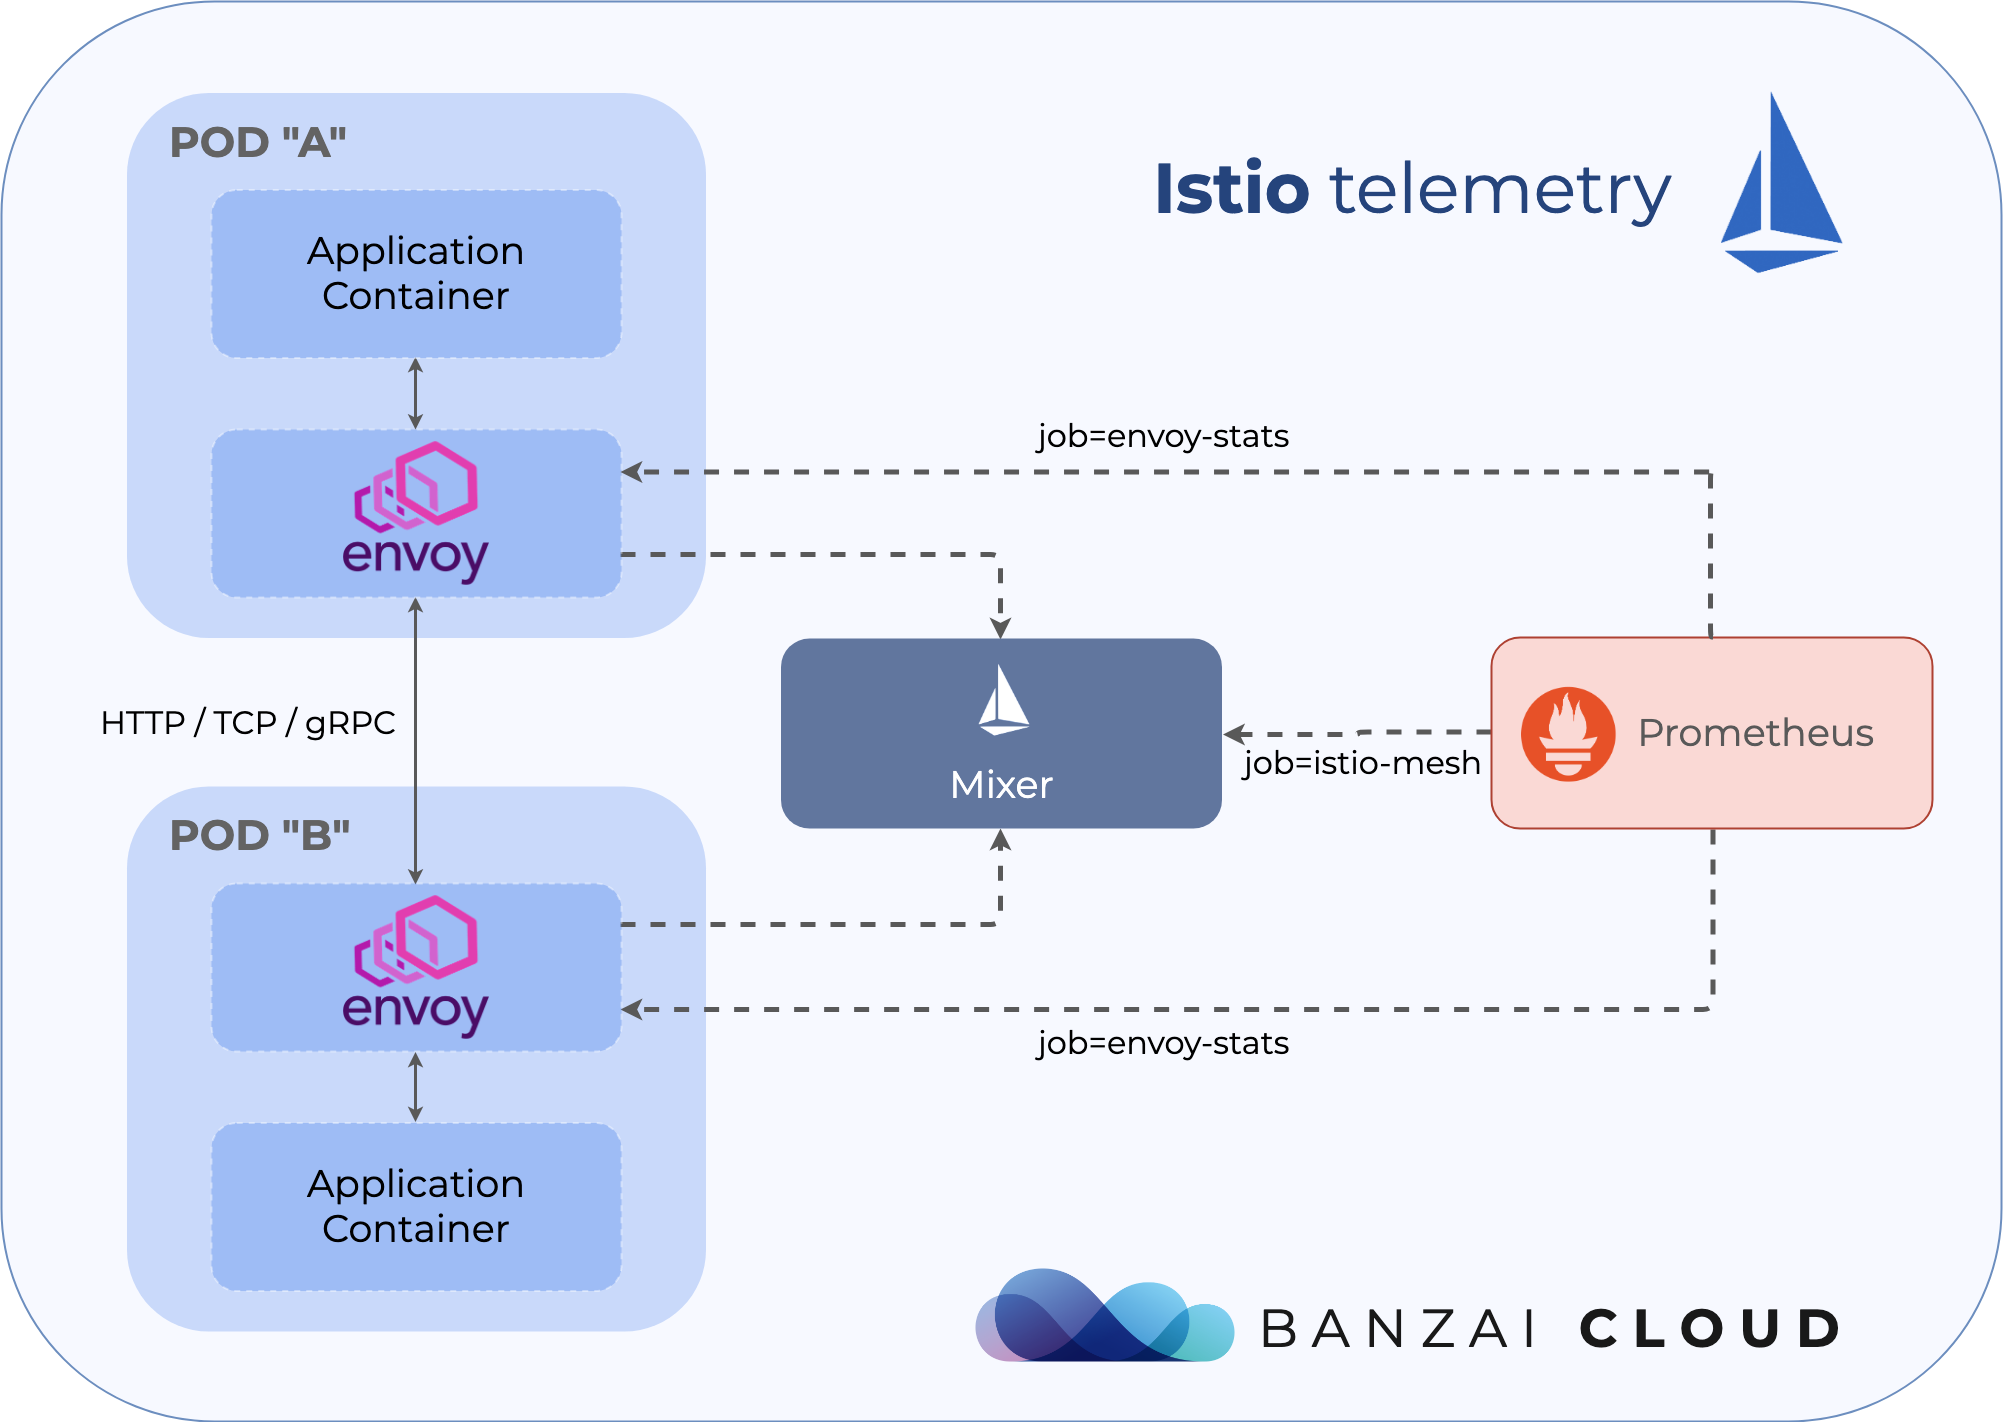
The Istio Control Plane is split into a few different components, one of them is called Mixer. But Mixer itself is two different deployments in Kubernetes. One is called istio-policy, the other is called istio-telemetry. As their names already tell, these components are responsible for providing policy controls and telemetry collection respectively.
The Envoy sidecars from the application pods call istio-policy before each request to perform precondition policy checks, and after each request to report telemetry. The sidecar has local caching such that a large percentage of precondition checks can be performed from cache. Additionally, the sidecar buffers outgoing telemetry such that it only calls Mixer infrequently.
Running Mixer on the Istio control plane is optional, if you don’t want central policy checks and telemetry you can disable these components completely. When enabled, these components are highly extensible, and can be driven entirely from custom resource configuration. If you don’t want to dive deep into Istio configuration, or don’t want to use your own infrastructure backends to collect logs or metrics but rely on the defaults (stdio logs, Prometheus metrics), you won’t need to care about these things at all.
But if you’d like to use a different adapter - like Stackdriver - you’ll need to update the custom resource configuration of Mixer. Istio has the concept of handlers, instances and rules. Handlers determine the set of infrastructure backend adapters that are being used and how they operate, instances describe how to map request attributes into adapter inputs, and rules bind handlers and instances together. If you want to learn more about these concepts, you can read the official docs here, but this blog post will provide some examples of the defaults later.
Configuring Prometheus to scrape service mesh metrics 🔗︎
Istio’s documentation has some examples about collecting custom metrics, or querying metrics from Prometheus, but it lacks a very important topic: understanding and configuring Prometheus scrape targets.
If you just want to try out Istio, you’ll probably deploy it using the official Helm chart (though we recommend our Istio operator for a better experience). The Helm chart includes a Prometheus deployment by default where targets are properly configured. But in a production environment, you usually have your own way of setting up Prometheus and configuring your own targets to scrape. If that’s the case, you’ll need to include the Istio scrape targets manually in your configuration.
First, let’s take a look at these targets. If you check out the configuration here, you’ll see that Istio adds more than ten jobs to Prometheus. Most of them are collecting custom metrics from the Istio control plane components. An example of that is how Pilot reports telemetry about xDS pushes, timeouts or internal errors through metrics like pilot_xds_pushes, pilot_xds_push_timeout and pilot_total_xds_internal_errors. These jobs are named after the components and scrape the http-monitoring port of the corresponding Kubernetes service. For example, the job that scrapes pilot looks like this:
- job_name: 'pilot'
  kubernetes_sd_configs:
  - role: endpoints
    namespaces:
      names:
      - {{ .Release.Namespace }}
  relabel_configs:
  - source_labels: [__meta_kubernetes_service_name, __meta_kubernetes_endpoint_port_name]
    action: keep
    regex: istio-pilot;http-monitoring
But the two most important targets are istio-mesh and envoy-stats. Including the first one in prometheus.yml will allow Prometheus to scrape Mixer, where service-centric telemetry data is provided about all network traffic between the Envoy proxies. envoy-stats on the other hand will query the Envoy proxies directly and will collect endpoint-centric telemetry data about the same network traffic (see metrics like envoy_cluster_upstream_rq).
Mixer uses Pilot to enhance the telemetry data reported by Envoys with Kubernetes service details, so data coming from Mixer will contain richer information that includes service and workload names among other Kubernetes specific stuff. But according to some blog posts, sending telemetry data from every sidecar proxy in the cluster to a central deployment has some severe performance effects, and it may be worth turning Mixer completely off on a large cluster, and relying only on envoy-stats, even if that means losing feature parity.
The yaml config for istio-mesh adds a job that queries the istio-telemetry service’s prometheus port:
- job_name: 'istio-mesh'
  kubernetes_sd_configs:
  - role: endpoints
    namespaces:
      names:
      - {{ .Release.Namespace }}
  relabel_configs:
  - source_labels: [__meta_kubernetes_service_name, __meta_kubernetes_endpoint_port_name]
    action: keep
    regex: istio-telemetry;prometheus
The yaml config of envoy-stats is more complicated, but the important part is here. It selects pods with a port name *-envoy-prom and queries /stats/prometheus:
- job_name: 'envoy-stats'
  metrics_path: /stats/prometheus
  kubernetes_sd_configs:
  - role: pod
  relabel_configs:
  - source_labels: [__meta_kubernetes_pod_container_port_name]
    action: keep
    regex: '.*-envoy-prom'
When using the Helm chart to deploy Prometheus to a cluster, these targets can be added to values.yaml, or directly edited in the configmap that holds prometheus.yaml and is mounted to the Prometheus server pod.
Using Prometheus operator 🔗︎
A better way to deploy Prometheus to a cluster is to use the Prometheus operator.
In that case configuring targets is a bit different - instead of editing prometheus.yml directly, you can define ServiceMonitor custom resources that declaratively describe a set of services to monitor, and the operator will translate them to proper Prometheus yaml configuration in the background.
For example, a ServiceMonitor entry that defines the scraping configuration of mixer telemetry looks like this:
apiVersion: monitoring.coreos.com/v1
kind: ServiceMonitor
metadata:
  name: istio-monitor
  labels:
    monitoring: services
spec:
  selector:
    matchExpressions:
      - {key: istio, operator: In, values: [mixer]}
  namespaceSelector:
    matchNames:
      - istio-system
  jobLabel: istio-mesh
  endpoints:
  - port: prometheus
    interval: 5s
  - port: http-monitoring
    interval: 5s
It matches the label selector istio=mixer and queries the endpoint ports prometheus and http-monitoring every 5 seconds. As above, Mixer provides custom metrics about its own operation on the http-monitoring port, but provides the aggregated service-centric metrics about the network traffic on port prometheus.
Default metrics 🔗︎
In the Istio documentation, the first task about metrics has the title Collecting new metrics. It does a good job describing how Istio utilises custom resources to configure instances, handlers and rules, and how to create a new metric that Istio will generate and collect automatically, but it can be considered as an advanced scenario.
In most use cases, the default set of metrics covers everything that’s needed, and an Istio user doesn’t need to understand these underlying concepts.
Our Istio operator (and also the Istio Helm charts) comes with these default metrics initialised. If you have Istio up and running in a cluster, and Prometheus is configured to scrape telemetry from Mixer, you won’t need to do anything else to have telemetry data about network traffic between services in the mesh. Once you have some traffic between Envoy sidecars, you can open the Prometheus UI (or use the query API) to check out metrics collected by Prometheus.
The default metrics are standard information about HTTP, gRPC and TCP requests and responses. Every request is reported by the source proxy and the destination proxy as well and these can provide a different view on the traffic. Some requests may not be reported by the destination (if the request didn’t reach the destination at all), but some labels (like connection_security_policy) are only available on the destination side. Here are some of the most important HTTP metrics:
istio_requests_totalis aCOUNTERthat aggregates request totals between Kubernetes workloads, and groups them by response codes, response flags and security policy. This can be useful to compute the request rate (RPS) between different workloads. An example query can be something like this (using the Bookinfo example). It computes the requests per second in the last hour between theproductpageand thereviewsservices, and groups the results by response code and workload subsets:
sum(rate(istio_requests_total{reporter="source",source_workload="productpage-v1",destination_service_name="reviews"}[1m])) by (source_workload,source_version,destination_service_name,destination_workload,destination_version,request_protocol,response_code)
{destination_service_name="reviews",destination_version="v2",destination_workload="reviews-v2",request_protocol="http",response_code="200",source_version="v1",source_workload="productpage-v1"}	12.71
{destination_service_name="reviews",destination_version="v3",destination_workload="reviews-v3",request_protocol="http",response_code="200",source_version="v1",source_workload="productpage-v1"}	12.72
{destination_service_name="reviews",destination_version="v1",destination_workload="reviews-v1",request_protocol="http",response_code="200",source_version="v1",source_workload="productpage-v1"}	6.35
{destination_service_name="reviews",destination_version="v1",destination_workload="reviews-v1",request_protocol="http",response_code="503",source_version="v1",source_workload="productpage-v1"}	6.37
istio_request_duration_secondsis a histogram that collects latency between workloads. The following example computes the 95th percentile latency of successful requests between theproductpageand thereviewsservices, and groups the results by workload subsets.
histogram_quantile(0.95, sum(rate(istio_request_duration_seconds_bucket{reporter="source",source_workload="productpage-v1",destination_service_name="reviews",response_code="200"}[60m])) by (le,source_workload,source_version,destination_service_name,destination_workload,destination_version,request_protocol))
{destination_service_name="reviews",destination_version="v2",destination_workload="reviews-v2",request_protocol="http",source_version="v1",source_workload="productpage-v1"}	0.1201
{destination_service_name="reviews",destination_version="v3",destination_workload="reviews-v3",request_protocol="http",source_version="v1",source_workload="productpage-v1"}	0.1345
{destination_service_name="reviews",destination_version="v1",destination_workload="reviews-v1",request_protocol="http",source_version="v1",source_workload="productpage-v1"}	0.1234
- The remaining two HTTP metrics are
istio_request_bytesandistio_response_bytes. These are also a histograms and can be queried in a similar way toistio_request_duration_seconds
Default metric internals 🔗︎
If you’re still interested in the internals of how these metrics are configured in Mixer, you can check out the corresponding Istio custom resources in the cluster. If you get the metric CRs from the cluster, it lists eight different resources that will be translated to Prometheus metrics:
kubectl get metric -n istio-system
NAME                   AGE
requestcount           17h
requestduration        17h
requestsize            17h
responsesize           17h
tcpbytereceived        17h
tcpbytesent            17h
tcpconnectionsclosed   17h
tcpconnectionsopened   17h
The handler configuration describes the Prometheus metrics and references the previous metric custom resources in the instance_name fields.
It also defines the name that can be used in Prometheus queries later (with the istio prefix), like requests_total:
kubectl get handler -n istio-system prometheus -o yaml
apiVersion: config.istio.io/v1alpha2
kind: handler
metadata:
  ...
spec:
  compiledAdapter: prometheus
  params:
    metrics:
    - instance_name: requestcount.metric.istio-system
      kind: COUNTER
      label_names:
      - reporter
      - source_app
      ...
      name: requests_total
The last building block is the rule custom resource that binds the metrics to the handlers:
kubectl get rule -n istio-system  promhttp -o yaml
apiVersion: config.istio.io/v1alpha2
kind: rule
metadata:
  ...
spec:
  actions:
  - handler: prometheus
    instances:
    - requestcount.metric
    - requestduration.metric
    - requestsize.metric
    - responsesize.metric
  match: (context.protocol == "http" || context.protocol == "grpc") && (match((request.useragent
    | "-"), "kube-probe*") == false)
If you still need some custom metrics about network traffic, you’ll need to add custom resources of these types. To do that, you can follow the Istio documentation.
A multi/hybrid cloud monitoring and control plane tool for Istio 🔗︎
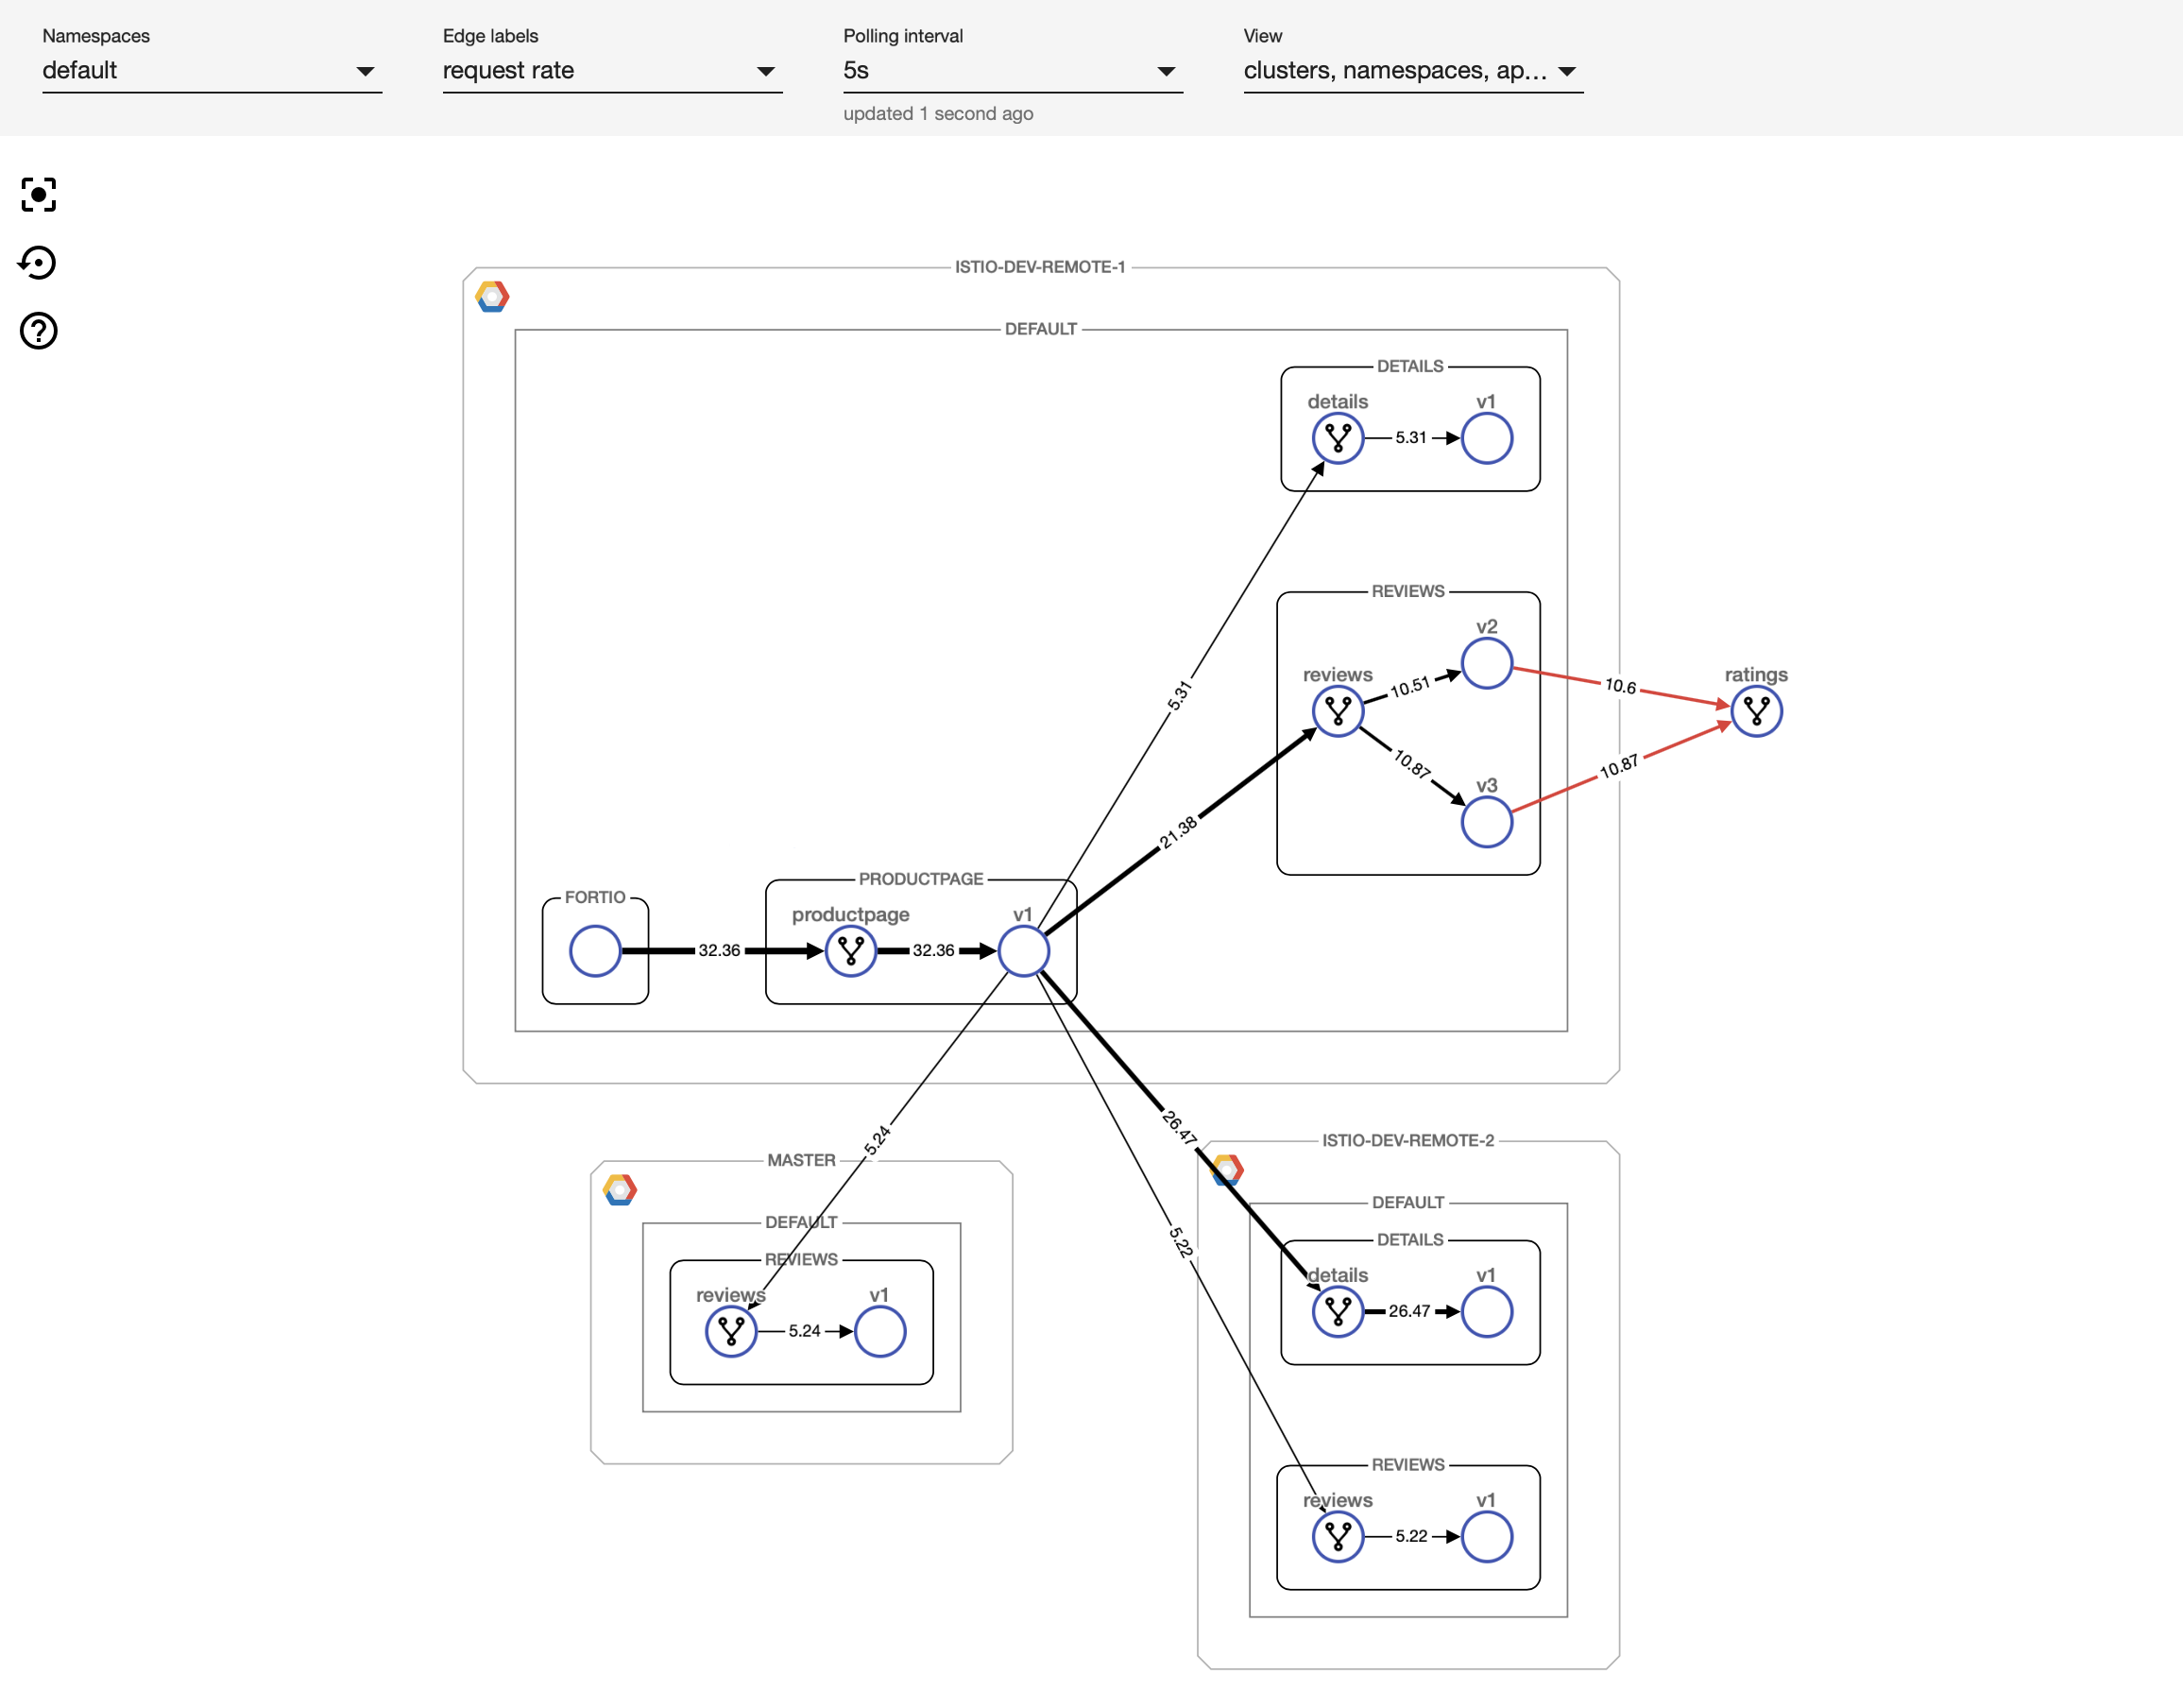
Istio and its telemetry component can be intimidating at first, especially if there are multiple clusters involved. We deeply care about simplifying service mesh use in multi-cluster environments as we are focused on building a multi- and hybrid-cloud platform at Banzai Cloud. The fruits of our labor are about to be released at KubeCon: a visual tool for monitoring and configuring service mesh activity. We considered using other tools, for example Kiali, but it fell short on multi-cluster support and the ability to specify configuration options through the UI. So we ended up writing our own UI and back-end infrastructure for communicating with the service mesh. This new tool will be released soon at KubeCon and will be available as part of the Pipeline platform, so stay tuned!
About Banzai Cloud Pipeline 🔗︎
Banzai Cloud’s Pipeline provides a platform for enterprises to develop, deploy, and scale container-based applications. It leverages best-of-breed cloud components, such as Kubernetes, to create a highly productive, yet flexible environment for developers and operations teams alike. Strong security measures — multiple authentication backends, fine-grained authorization, dynamic secret management, automated secure communications between components using TLS, vulnerability scans, static code analysis, CI/CD, and so on — are default features of the Pipeline platform.
About Banzai Cloud 🔗︎
Banzai Cloud changing how private clouds get built to simplify the development, deployment, and scaling of complex applications, bringing the full power of Kubernetes and Cloud Native technologies to developers and enterprises everywhere.
#multicloud #hybridcloud #BanzaiCloud


