


Observability is a key feature of the Banzai Cloud Pipeline platform - we put significant effort into monitoring and centralized log collection - and, recently, into tracing.
Instrumentation 🔗︎
Instrumentation is the process of monitoring/measuring software performance, writing logs and trace information and, more generally speaking, of collecting information that helps us to diagnose errors, run software with maximum availability, to understand how the software operates and, more importantly, how it impacts users and businesses.
A lack of proper instrumentation can easily result in customers, managers and developers being frustrated, and the loss of engineering hours. This gets expensive, fast, so choosing the right tools for the job is vital.
OpenCensus 🔗︎
OpenCensus is a relatively new player in the software instrumentation market. It consists of a set of vendor-neutral libraries allowing developers to decouple their code from the actual vendor being used. This is probably the reason it’s experienced such a rapid upswing in popularity.
The core features of OpenCensus are the collection of metrics and of trace information from applications, and the ability to expose them to the storage/analysis tool of your choice. It supports all major players (Prometheus, Jaeger, Zipkin), so chances are it can be easily integrated into your existing workflow. It also provides a vendor-neutral collector agent, allowing it to decouple the application from those tools entirely.
It’s worth mentioning that OpenCensus itself is language-agnostic, so it’s a great choice for a polyglot environment.
Metrics 🔗︎
Collecting metrics is an important way of measuring software performance. Metrics can serve as a base for automatic actions (like scaling up an application or generating alerts), but they are often also the first step in diagnosing errors (for example, high error rates are first visible on metric dashboards).
OpenCensus metrics (called stats) consist of two parts:
- Measuring data points
- Aggregation of those data points to form views
Measures represent the type of metric to be recorded. All measures have a name uniquely identifing them, and a unit which defines the data point’s type. A measure for HTTP request latency would look something like this:
1	RequestLatency = stats.Float64(
2		"http/latency",
3		"End-to-end latency",
4		stats.UnitMilliseconds,
5	)
Measures themselves don’t represent much on their own. Using our previous example as a for instance, knowing a bunch of latency values does not tell us whether there is a problem; we need to make a connection between the data points by aggregating them. This is where views come into play.
The following aggregation methods are supported:
- Count: a tally of the number of measured points.
- Distribution: a histogram distribution of the measured points.
- Sum: the sum of the measured points.
- LastValue: the last recorded value, ignoring everything else.
Additionally, views can be broken down by user-defined key-value pairs (recorded with measures), called tags. Tags can provide us with further insights into application events and show us correlations where the performance drops. For example, tagging latency measures via the HTTP method or even through a URL path can show us which part of the application is slow.
Below is an example of a view in the form of an aggregated latency distribution:
1	ServerLatencyView = &view.View{
2		Name:        "http/latency",
3		Description: "Latency distribution of HTTP requests",
4		TagKeys:     []tag.Key{Method},
5		Measure:     ServerLatency,
6		Aggregation: DefaultLatencyDistribution,
7	}
This way of doing things might seem complicated in comparison to Prometheus’ approach (the current leader in metrics collection), wherein metric types also include their aggregation method, but it provides greater flexibility by separating your concerns, and frees you from vendor lock-in.
Tracing 🔗︎
Tracing tracks the lifecycle of a request as it travels through the components of a system. Components in this context can be separate services, database and caching systems, or anything else that plays a part in responding to a user request.
The unit of work, here, is called a span, which contains information (latency, status, user-defined events and attributes, etc) pertaining to the work the component was doing. Each span is collected into a piece of trace information, allowing us to get a full picture of what happened during the request.
This is an extremely powerful tool that can be used to quickly diagnose errors and narrow down the area of our investigation as much as possible. In complex systems, this can be incredibly helpful, because errors usually first appear in user-facing services, and it’s imperative that we find root causes as quickly as possible. Going through the logs of each component takes time, but, if we can identify which one is misbehaving, we can reduce that time from hours down to minutes.
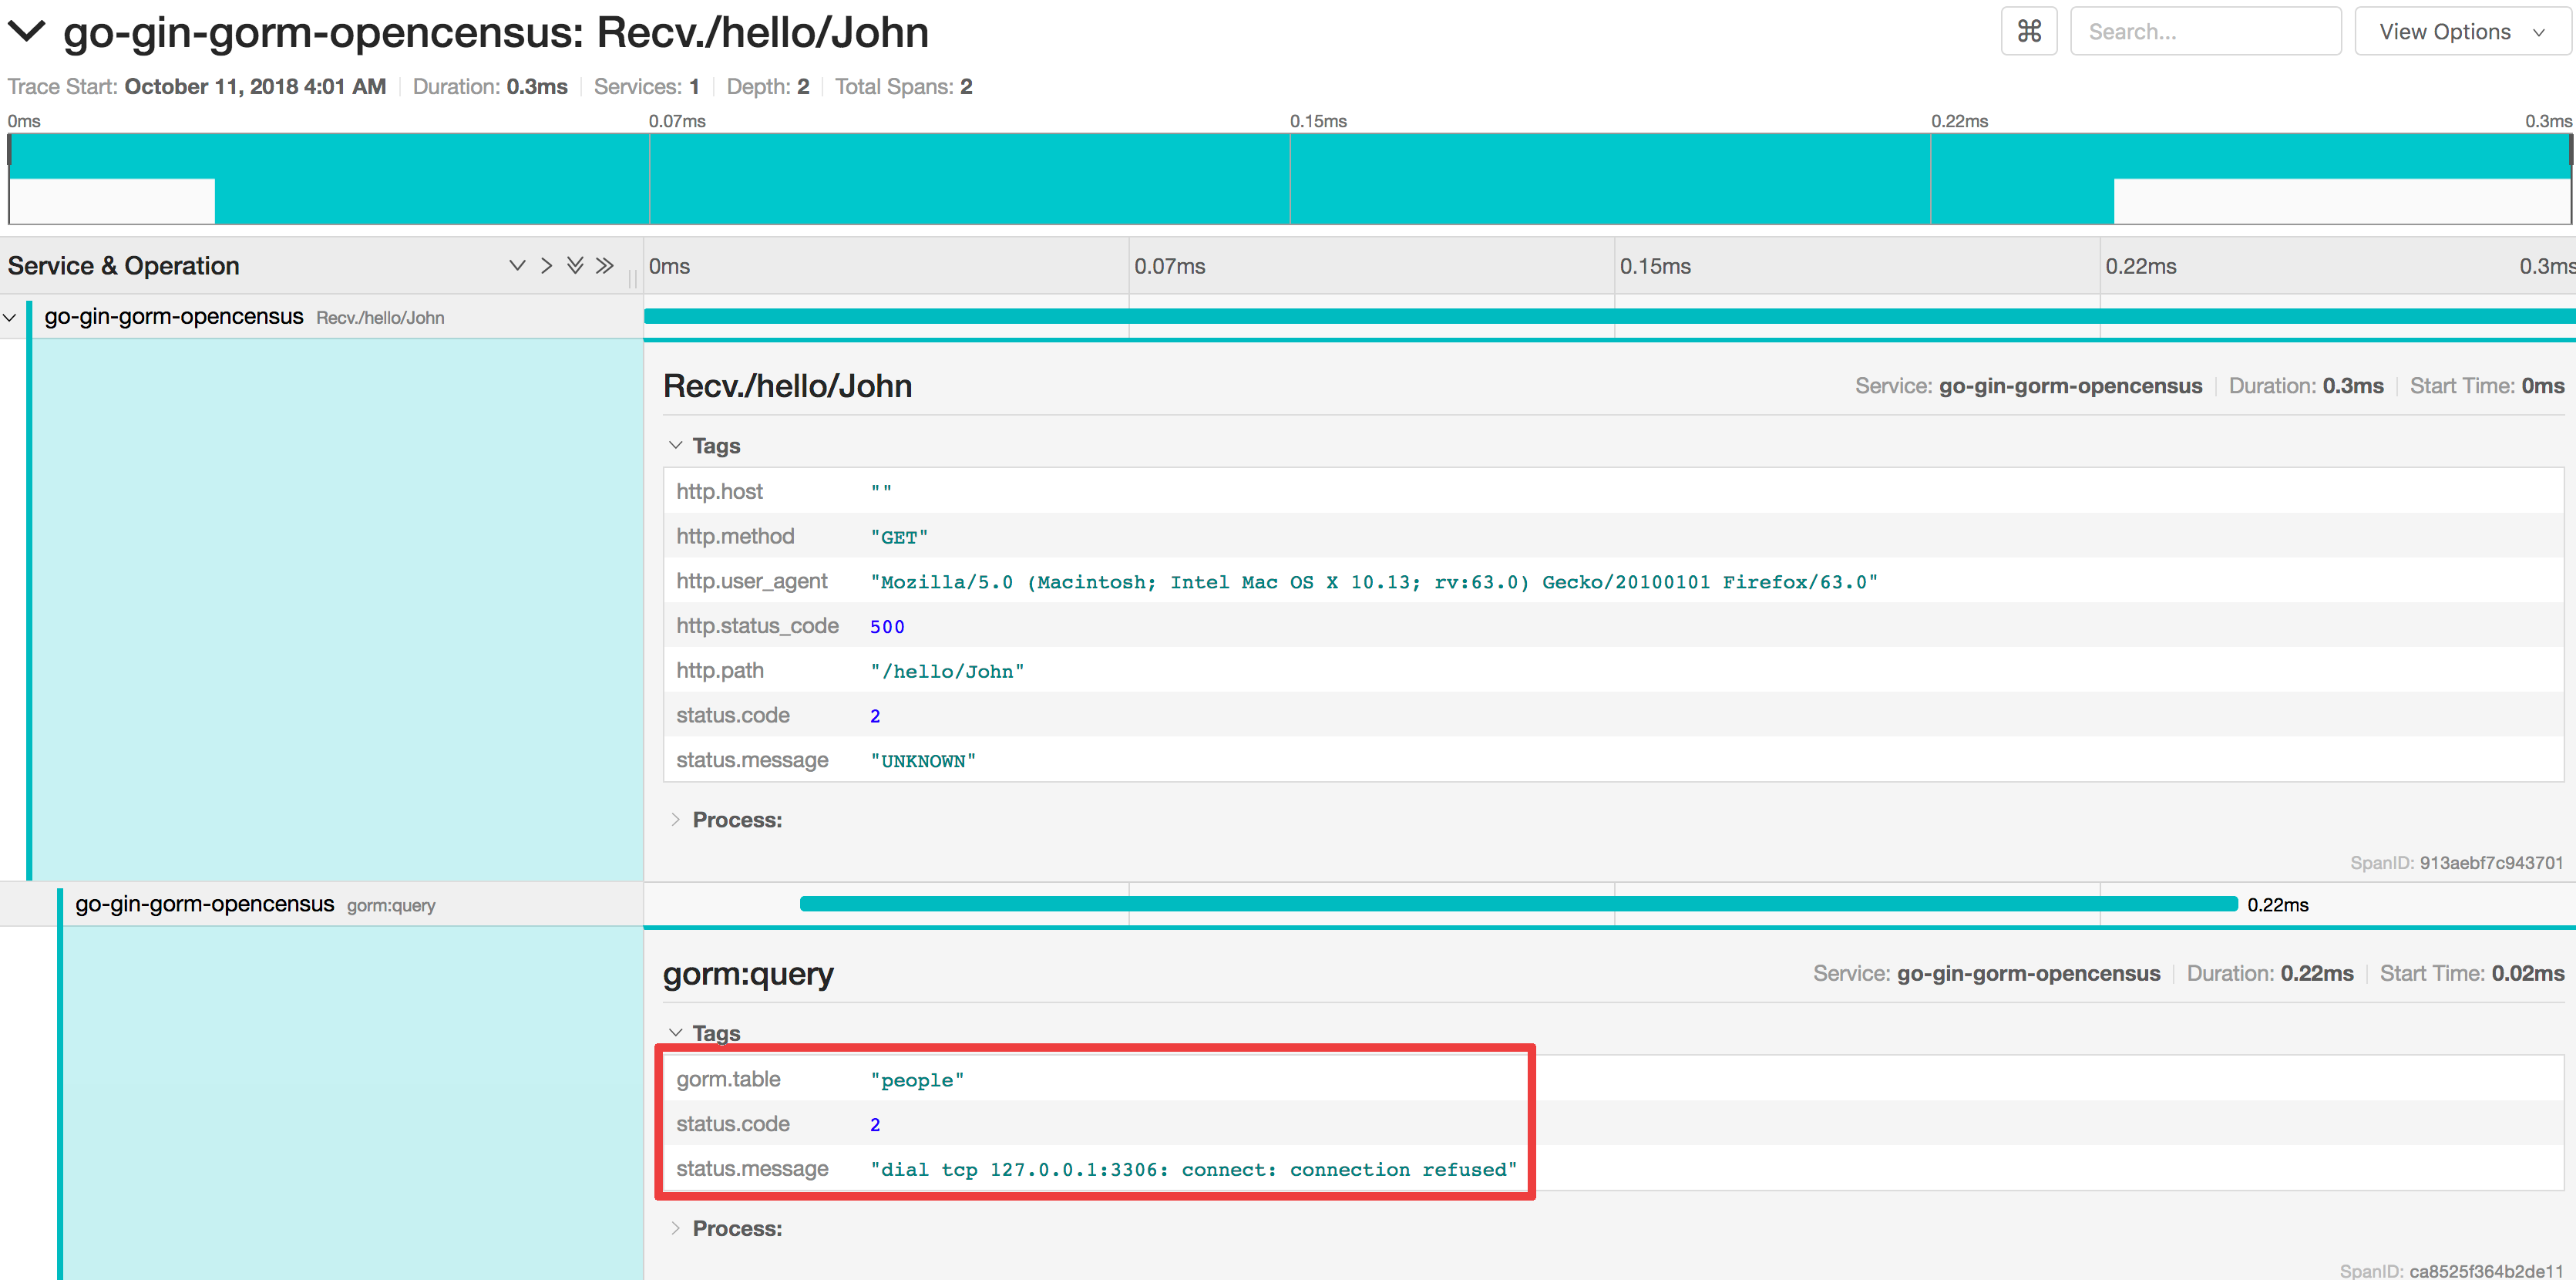
For example, in the following scenario a service returns only a 500 error to a user. Going through all the logs would take time, but by examining trace information we are immediatly pointed at the database:
Context propagation 🔗︎
An important concept in Go, which OpenCensus heavily relies on, is context propagation. As of Go 1.7 the standard library comes with a new package, called context. It provides tools for transfering parameters across API boundaries. These parameters can include cancellation signals, deadlines, but also arbitrary user parameters (like information).
OpenCensus uses contexts to propagate trace and metrics information within a single process between components, so it’s important to maintain a coherent context during a request lifecycle. Most tools in the standard library (http, sql) and frameworks like gRPC and Twirp already support (or even heavily build upon) context propagation, so you’re covered on their end.
The problem with this concept is that you have to make contexts part of your API in order to propagate them from one boundary to another.
Here is a simple way to save some data in a database received from a REST API call:
 1package main
 2
 3import (
 4	"context"
 5	"database/sql"
 6	"encoding/json"
 7	"net/http"
 8)
 9
10var db *sql.DB // initialize DB
11
12type Person struct {
13	Name string `json:"name"`
14}
15
16func CreateHandler(w http.ResponseWriter, r *http.Request) {
17	decoder := json.NewDecoder(r.Body)
18
19	var Person person
20
21	decoder.Decode(&person)
22
23	CreatePerson(r.Context(), person)
24}
25
26func CreatePerson(ctx context.Context, person Person) {
27	db.ExecContext(ctx, "INSERT INTO people (name) VALUES (?)", person.Name)
28}
As you can see, the context is being passed all the way down to the SQL library through the custom application API.
It may not be ideal or convenient, easy to forget about, and unable to produce nice APIs, but it’s an acceptable compromise given the advantages that come with it.
Example application 🔗︎
All right, let’s get to the code. For brevity, only the key parts will be presented in this post, but the whole code can be found in this repository. The application can easily be started locally (details are in the readme) and already contains everything necessary for a demonstratation:
- MySQL as the database backend
- Prometheus for metrics collection
- Jaeger for trace collection
To see how the example code evolved, take a look at the closed PRs.
Chances are, some of the code in the repository will be extracted to a maintained library once it becomes stable.
Instrumenting Gin 🔗︎
At its core, Gin is nothing more than an HTTP handler; internally it uses the HTTP server from the standard library. Fortunately, the OpenCensus library already contains integration for HTTP handlers, which work perfectly with Gin.
All you need to do is wrap the gin.Engine instance with the tracing HTTP handler, and pass it to
the HTTP server (unfortunately this means you won’t be able to use Gin’s Run function,
but it’s a small price to pay for what we’re trying to accomplish):
 1r := gin.Default()
 2
 3// Add routes to gin
 4
 5http.ListenAndServe(
 6	"127.0.0.1:8080",
 7	&ochttp.Handler{
 8		Handler: r,
 9	},
10)
After adding something like this to your Gin application, you should see something similar in your choice of tracing tool:
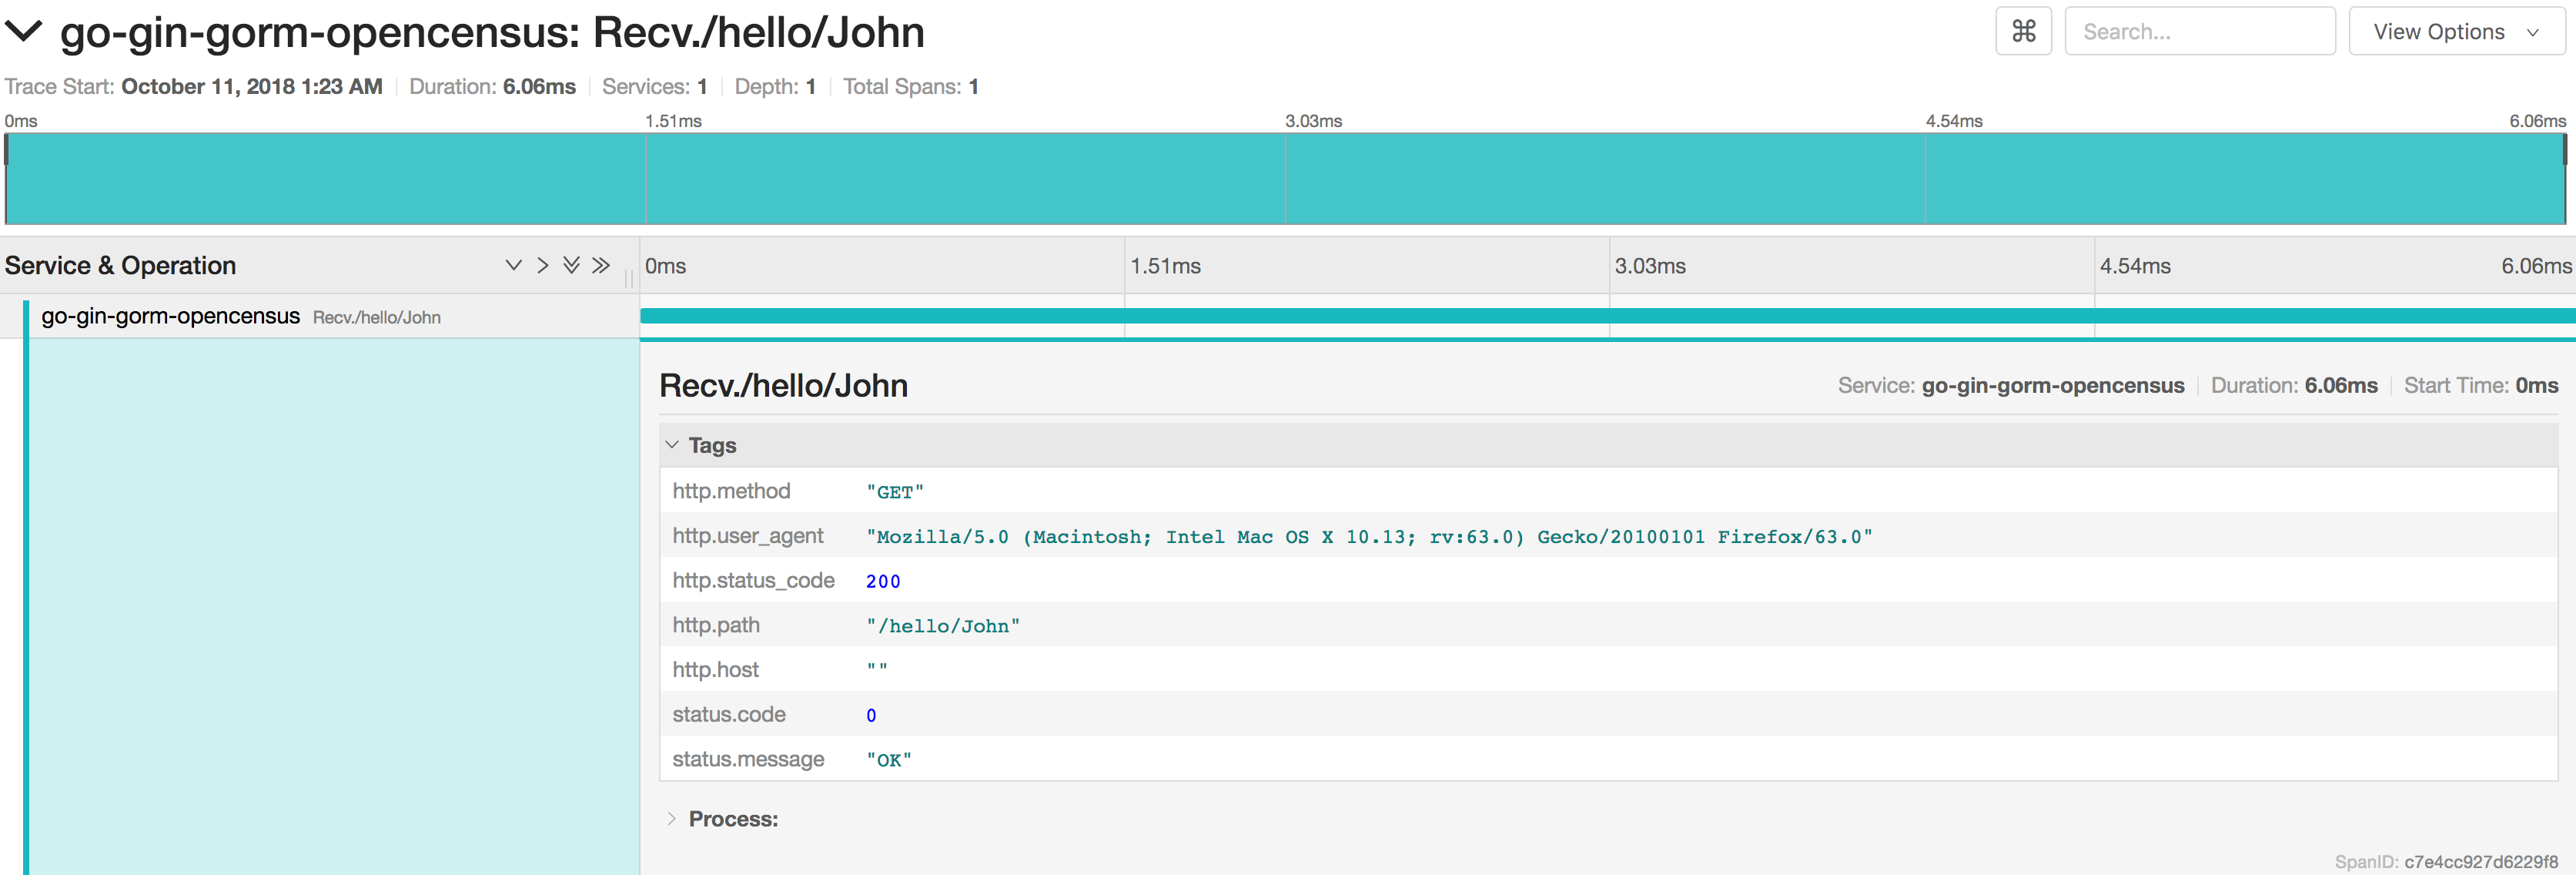
There’s one catch, the current implementation of the HTTP plugin does not allow for the insertion of custom tags into recorded metrics. This isn’t always a problem, but when using dynamic routes with parameters, it’s preferable that we collect these routes over actual URL paths. Currently, this is not possible, but there’s a pending issue that describes this problem.
Even without route names in metrics and traces, instrumenting Gin with OpenCensus is pretty easy and works well.
Instrumenting Gorm 🔗︎
Instrumenting Gorm is a little bit harder, because it does not support any kind of context propagation, which is necessary for OpenCensus to work properly. There are several issues requesting this feature, but nothing’s been done so far so we’ve had to find a workaround.
Luckily, Gorm allows us to register callbacks for certain events (namely: query, create, update, delete) and to set arbitrary values in its scope. (Gorm manages an internal state for each action, and to keep these states from colliding, actions are executed in separate scopes)
These two features allow us to implement a set of callbacks that can be instrumental to database operations. Needless to say, this is less than ideal, because the context is not propagated to the actual SQL implementation, but nonetheless it seems to work very well.
Here, integration is also easy:
1import "github.com/sagikazarmark/go-gin-gorm-opencensus/pkg/ocgorm"
2
3// ...
4
5db, err := gorm.Open("dialect", "dsn")
6if err != nil {
7 panic(err)
8}
9
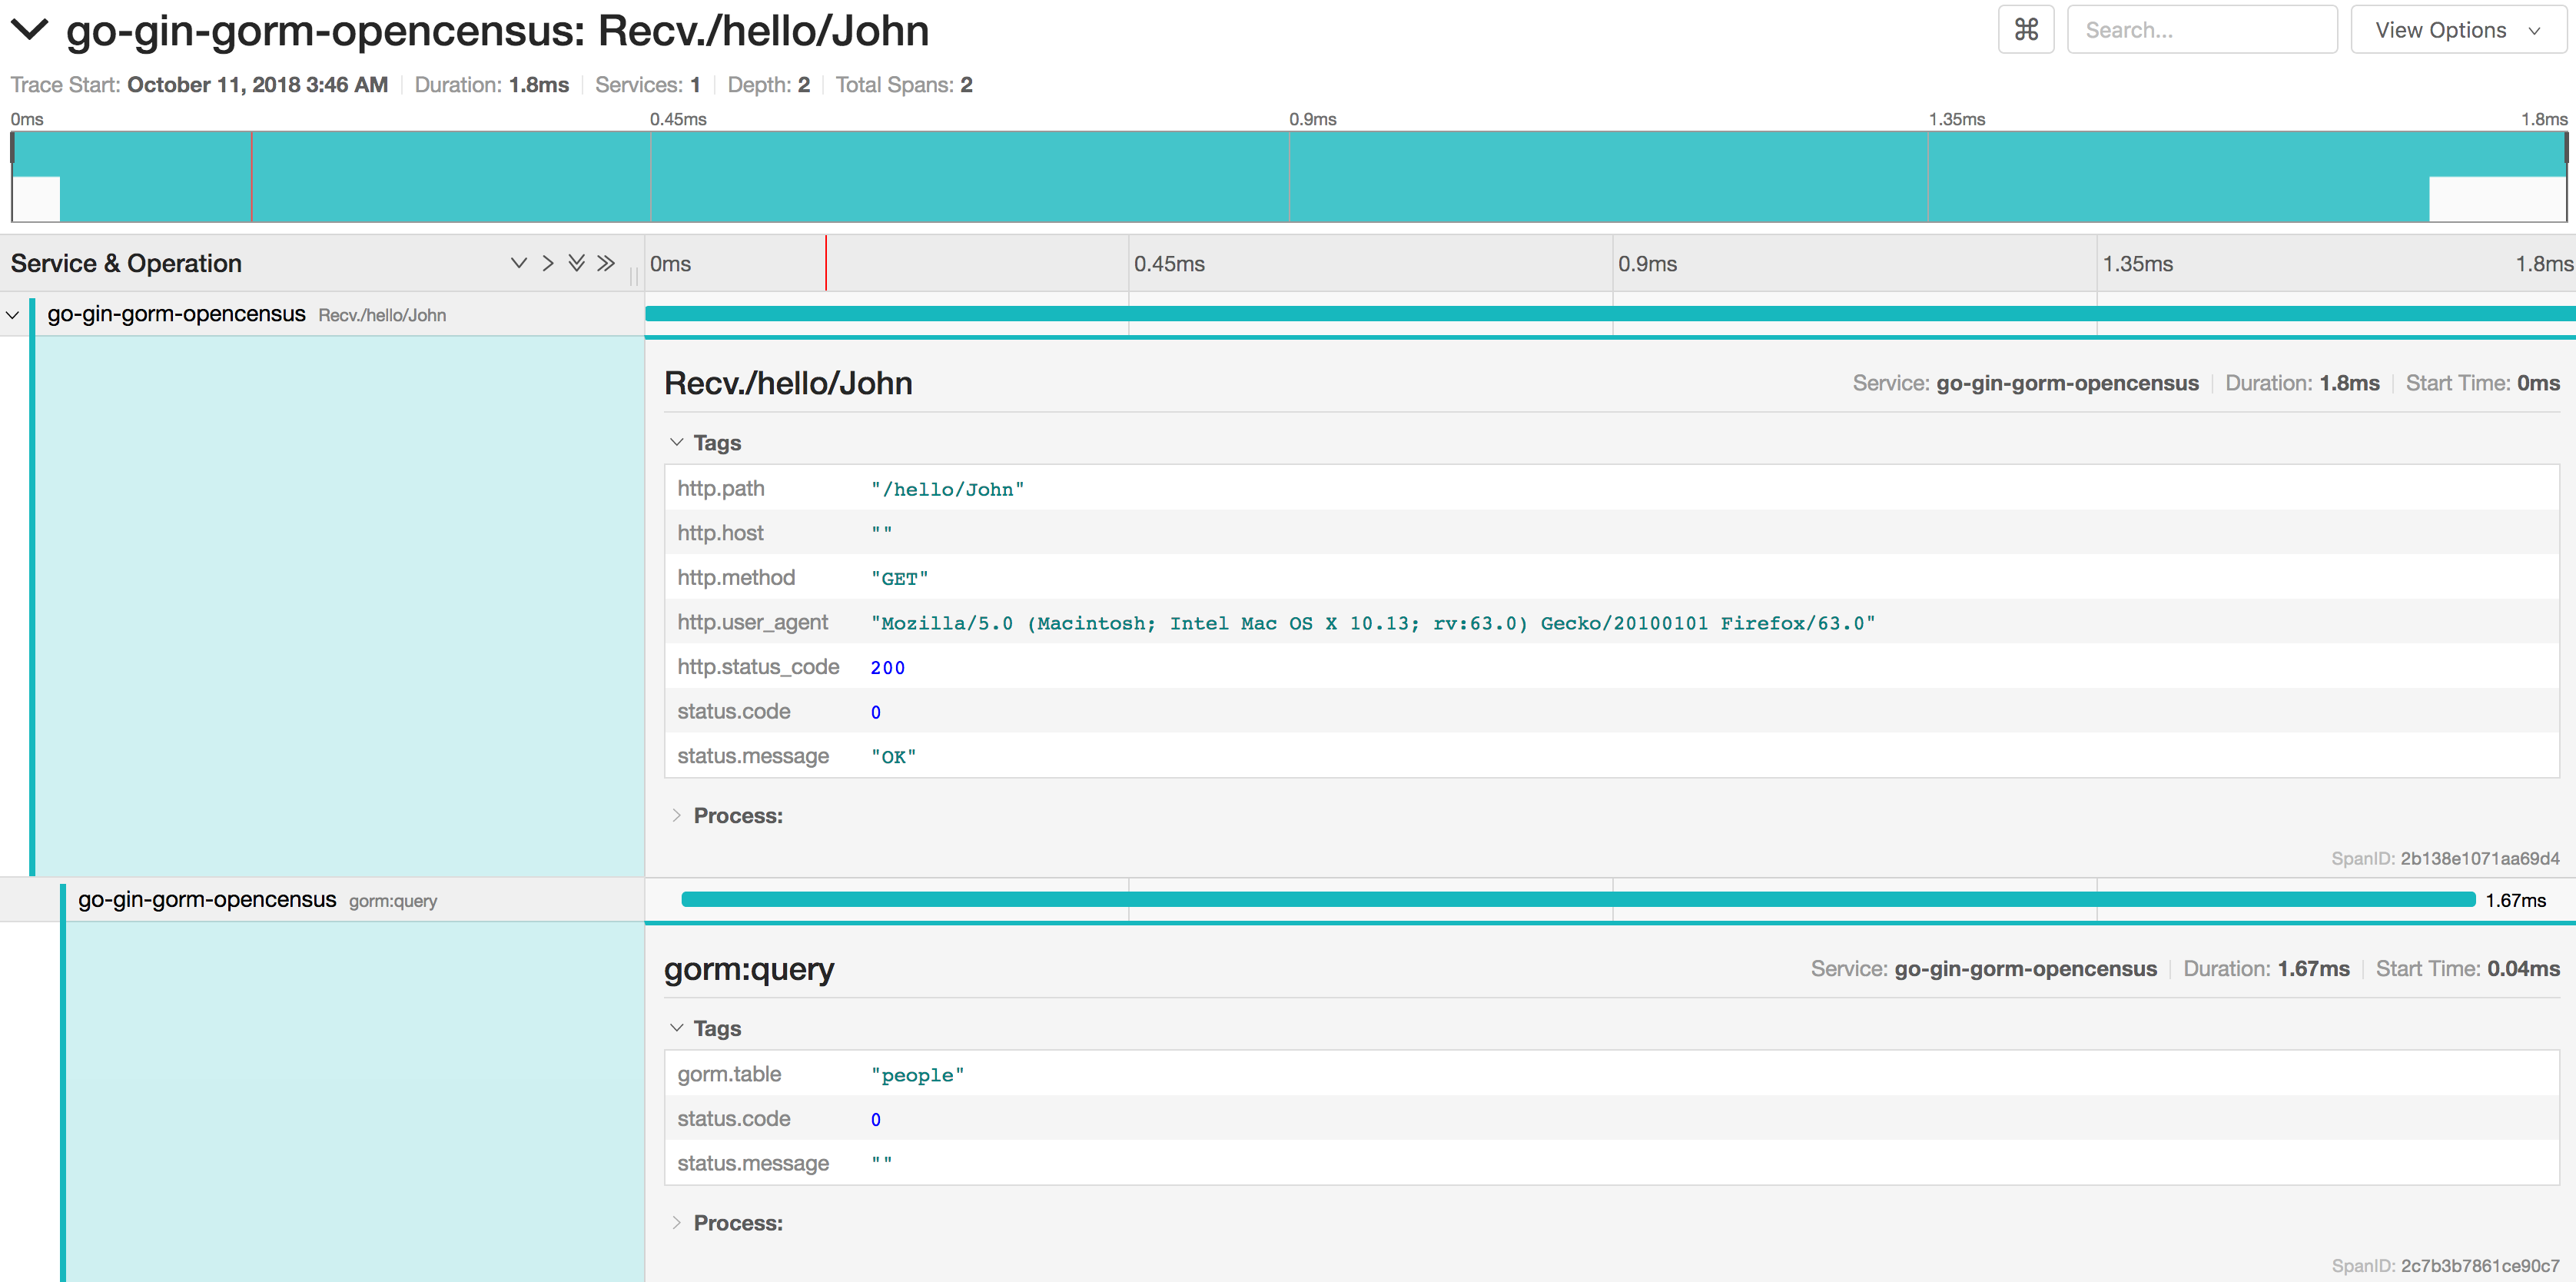
10// Register instrumentation callbacks
11ocgorm.RegisterCallbacks(db)After adding this code, you should see something like:
Conclusion 🔗︎
Adding metrics and trace collection to applications using Gin and/or Gorm is fairly simple with OpenCensus, especially in comparison to the value it provided. It may require a bit more work on existing code bases to make sure that a specific context is adequately propagated, but that investment pays dividends.
Further reading 🔗︎
https://opencensus.io/
https://github.com/census-instrumentation/opencensus-specs
https://blog.golang.org/context
https://medium.com/@bas.vanbeek/opencensus-and-go-database-sql-322a26be5cc5