


When something goes wrong in your mesh, the first thing you’ll probably notice is an alert about your services: error rate or latency is increasing. But it’s only a symptom and the real root cause can be a whole bunch of different things, like underlying Kubernetes problems, application bugs or node failures. This blog post shows you how to track such an issue and find the root cause: in this example, a misconfiguration in a Kubernetes cluster.
The Backyards (now Cisco Service Mesh Manager) dashboard is a great starting point for discovering the root cause of specific failures that can occur in your Istio service mesh. Inspecting the topology view and the integrated metrics is usually the first step of investigating a bug. Backyards’ distributed tracing, tapping and validations can also help with debugging, or analysing an issue. Leveraging Istio’s 1.5 new Telemetry v2 (aka Mixerless), Backyards (now Cisco Service Mesh Manager) drill-down view is another addition in this toolbox.
We see the service mesh as a key component of every modern Cloud Native stack. To make this a reality, we are on a mission to make Istio simple to use and manage for everyone. We have built a product called Backyards (now Cisco Service Mesh Manager), the Banzai Cloud operationalized and automated service mesh, which makes setting up and operating an Istio-based mesh a cinch.
Backyards 1.2 provides a drill-down view of services and workloads in the Istio service mesh. You can trace back an issue from the top-level service mesh layer by navigating deeper in the stack, and see the status and most important metrics of your Kubernetes controllers, pods, and even nodes.
Check out Backyards in action on your own clusters!
Want to know more? Get in touch with us, or delve into the details of the latest release.
Or just take a look at some of the Istio features that Backyards automates and simplifies for you, and which we’ve already blogged about.
Set up the environment 🔗︎
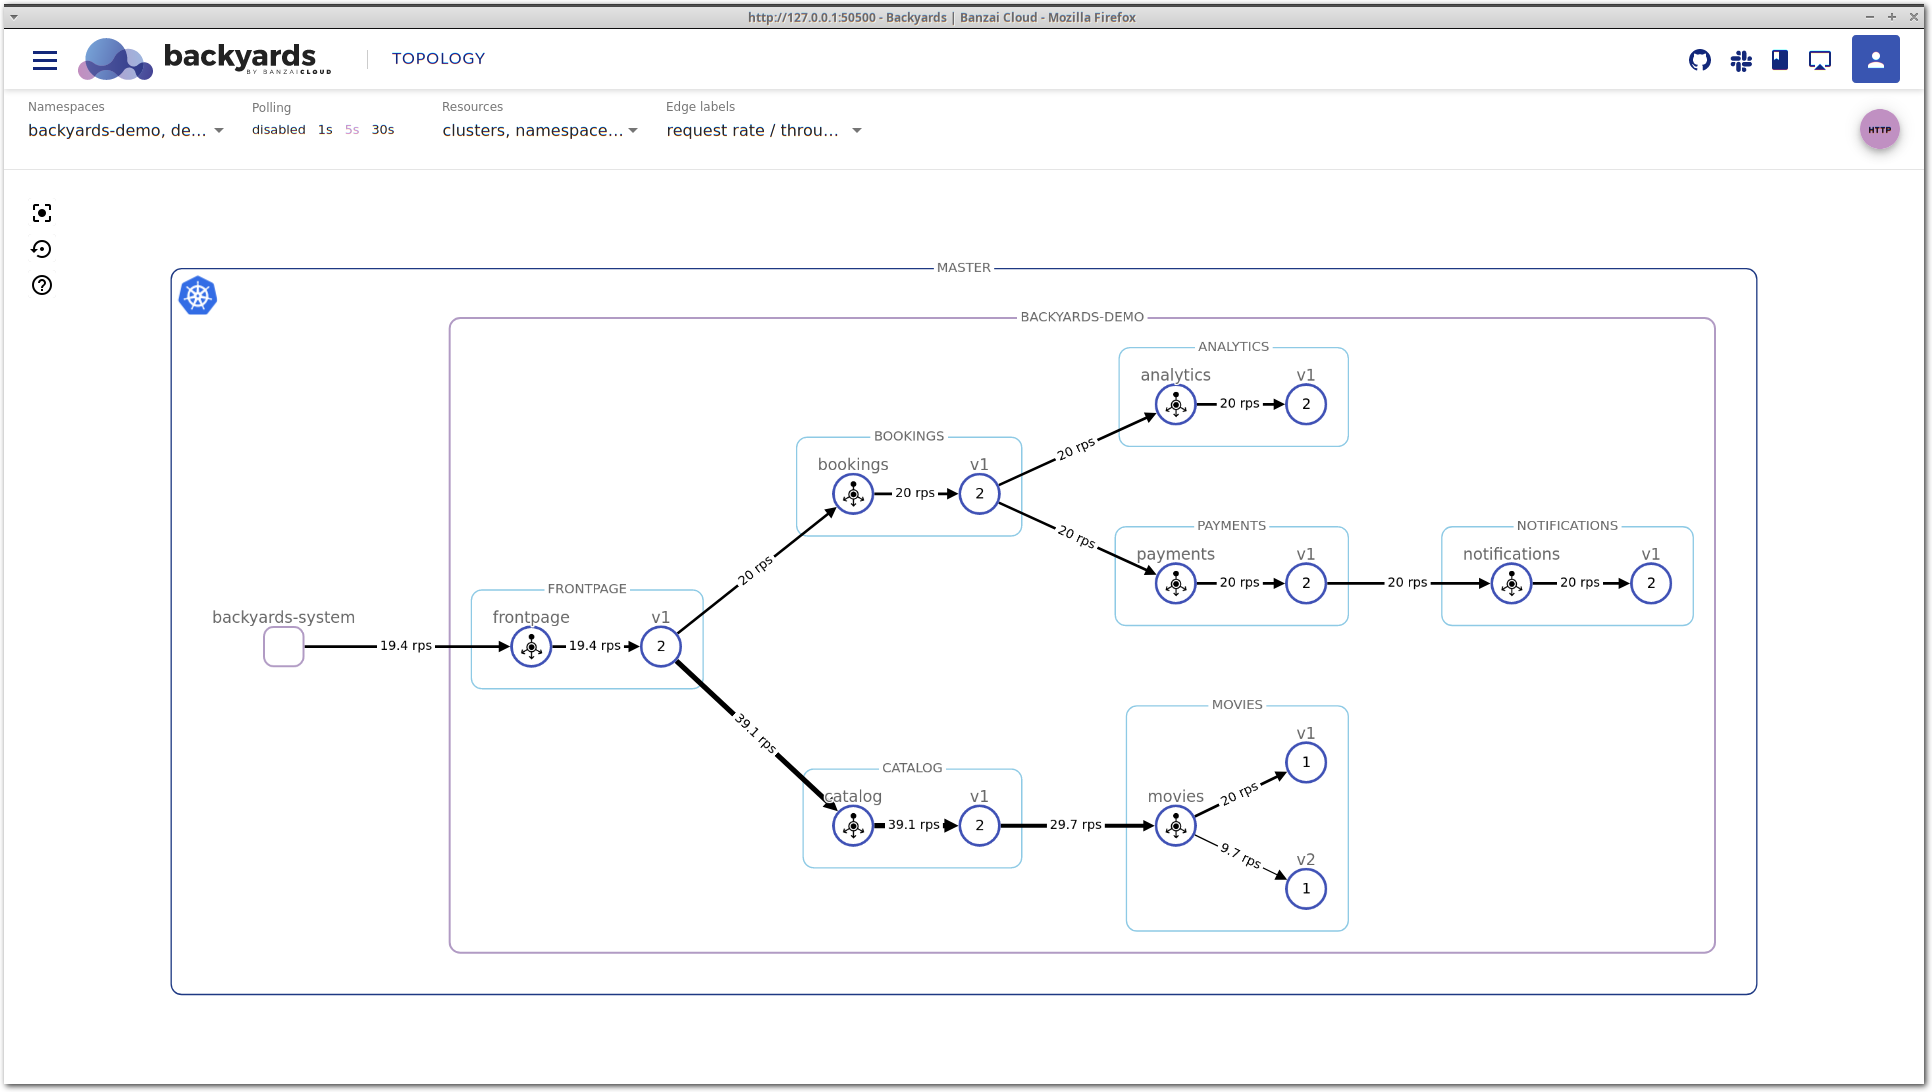
The demo environment of Backyards includes a demoapp and demo service called movies. To demonstrate the drill down feature, we’ve slightly modified some of the workloads. Let’s say we’ve just released a new v2 version of the movies microservice, and we’re doing a blue-green deployment, first by routing 50% of the traffic to the new version.
To replicate the results, you will need to use a different docker image for movies-v2 and set up autoscaling for this deployment:
kubectl patch deployment -n backyards-demo movies-v2 --type='json' -p="[{\"op\": \"replace\", \"path\":\"/spec/template/spec/containers/0/image\", \"value\":\"khernyo/movies-v2:latest\"}, {\"op\": \"remove\", \"path\":\"/spec/template/spec/containers/0/env\"}]"
kubectl annotate --overwrite deployment -n backyards-demo movies-v2 \
    hpa.autoscaling.banzaicloud.io/minReplicas=1 \
    hpa.autoscaling.banzaicloud.io/maxReplicas=10 \
    cpu.hpa.autoscaling.banzaicloud.io/targetAverageUtilization=60
You can set up routing using the Backyards CLI.
backyards routing ts set backyards-demo/movies -m port=8082 v1=50 v2=50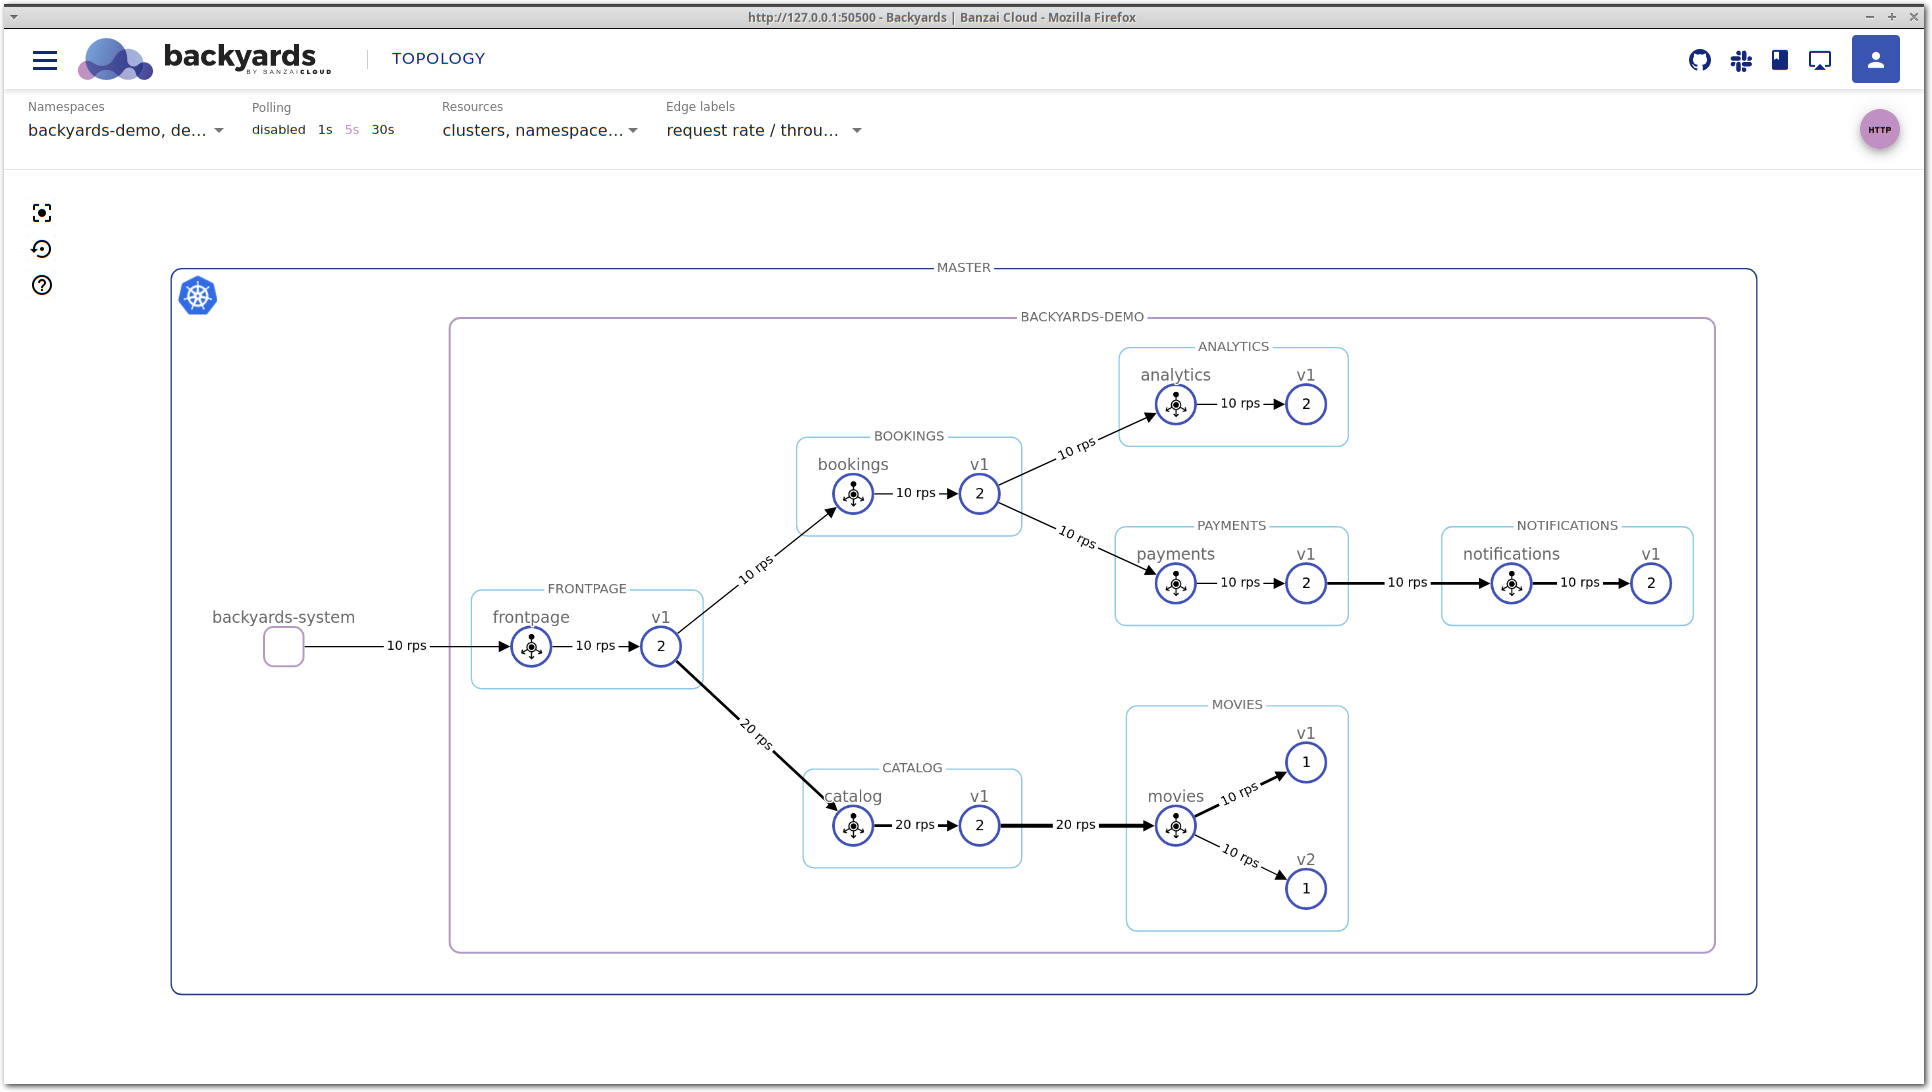
Load testing 🔗︎
Our services don’t receive real traffic, but we can do some load testing to simulate that. A bombardier deployment is packaged with the demoapp, and it’s running in the backyards-demo namespace, so let’s use that.
Send a higher amount of traffic to the microservices: increase requests/s from 10 to 20.
kubectl patch deployment -n backyards-demo bombardier --type='json' \
-p='[{
"op": "replace",
"path":"/spec/template/spec/containers/0/args",
"value":["--rate=20", "--duration=100h", "http://frontpage:8080"]
}]'
# By default it's disabled, so we need to scale it up to 1 replica
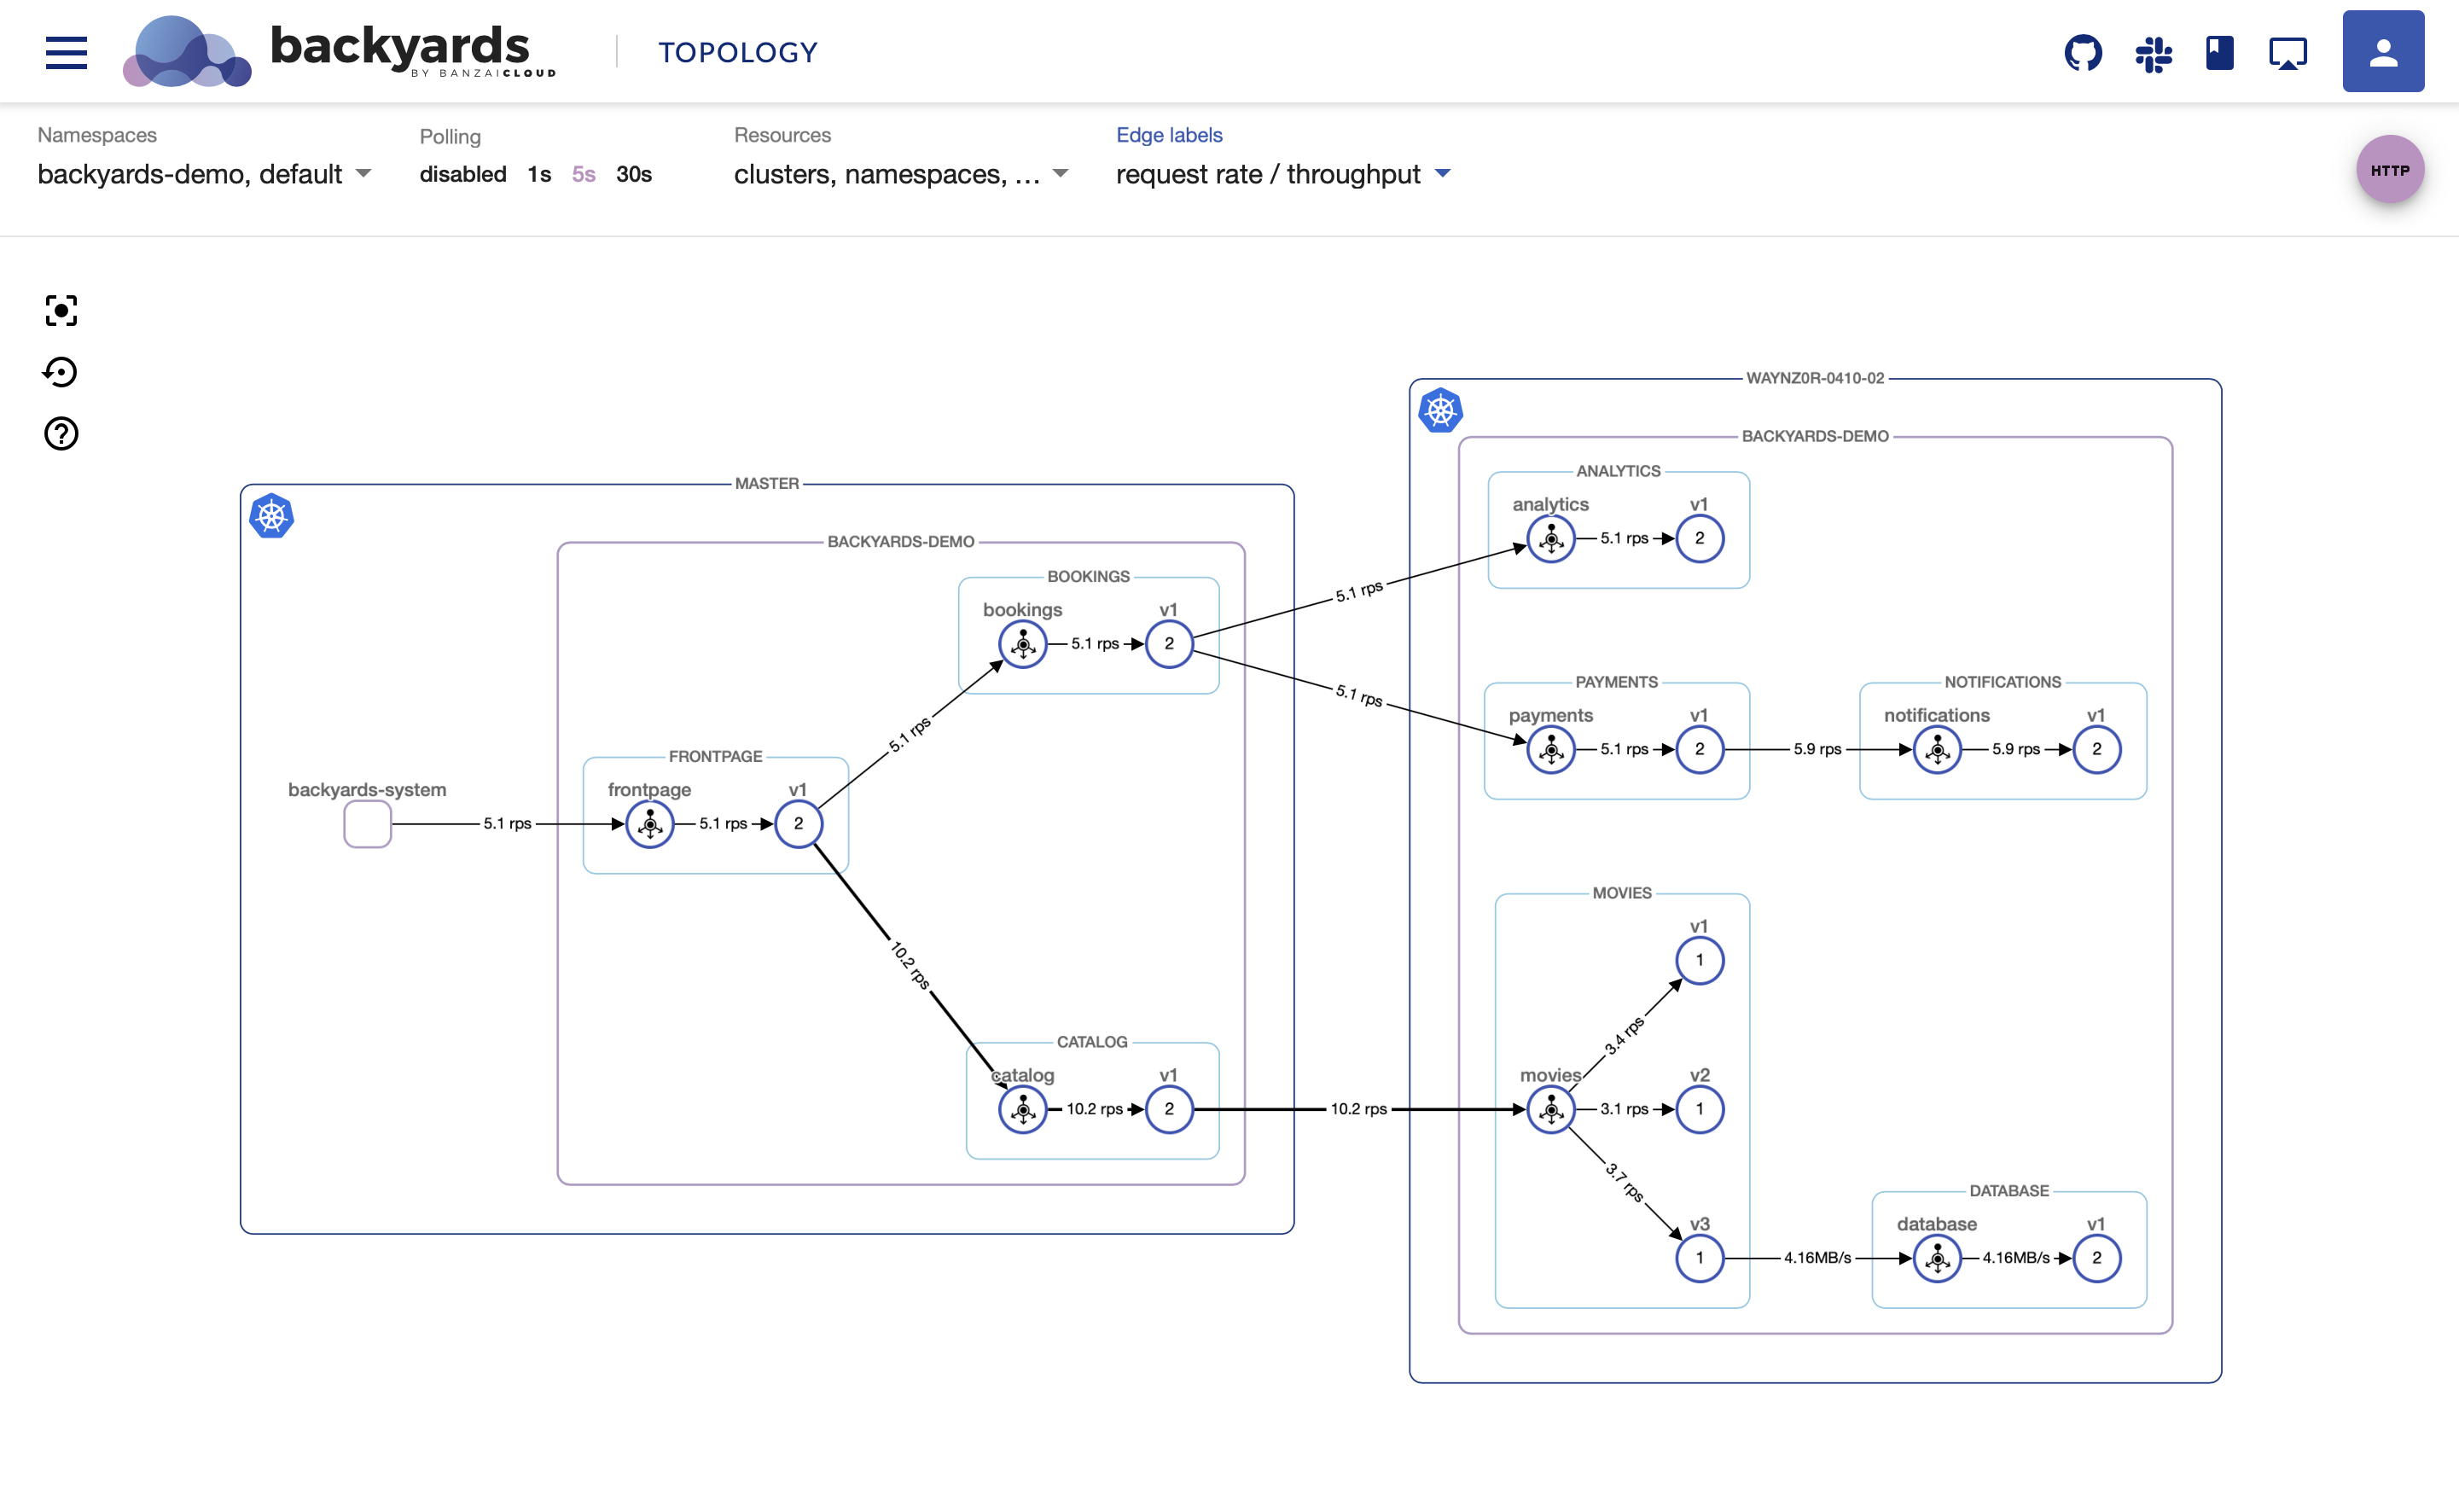
kubectl scale deployment -n backyards-demo bombardier --replicas=1Looking at the movies application on the Backyards (now Cisco Service Mesh Manager) topology view, you can see that movies-v1 is handling more traffic than movies-v2. This is unexpected, the two different versions should receive the same amount of traffic.
Find the root cause 🔗︎
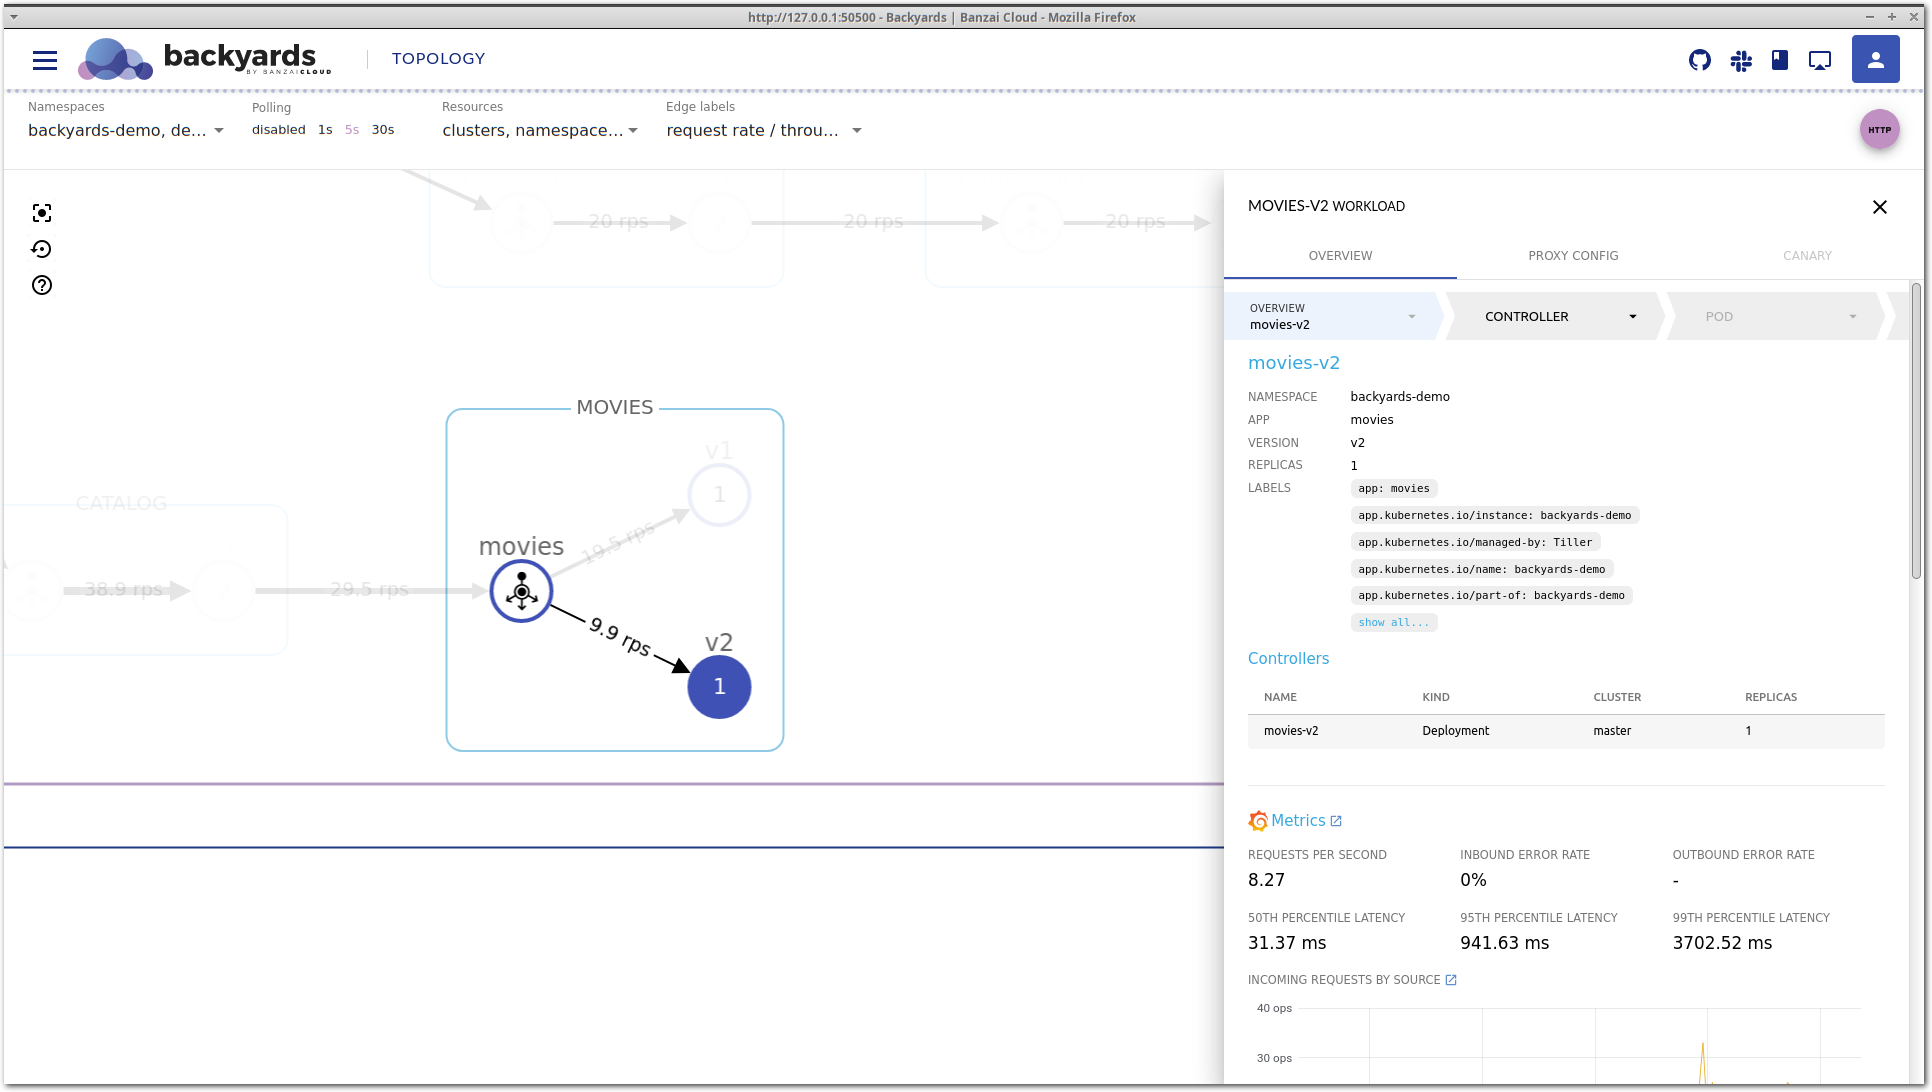
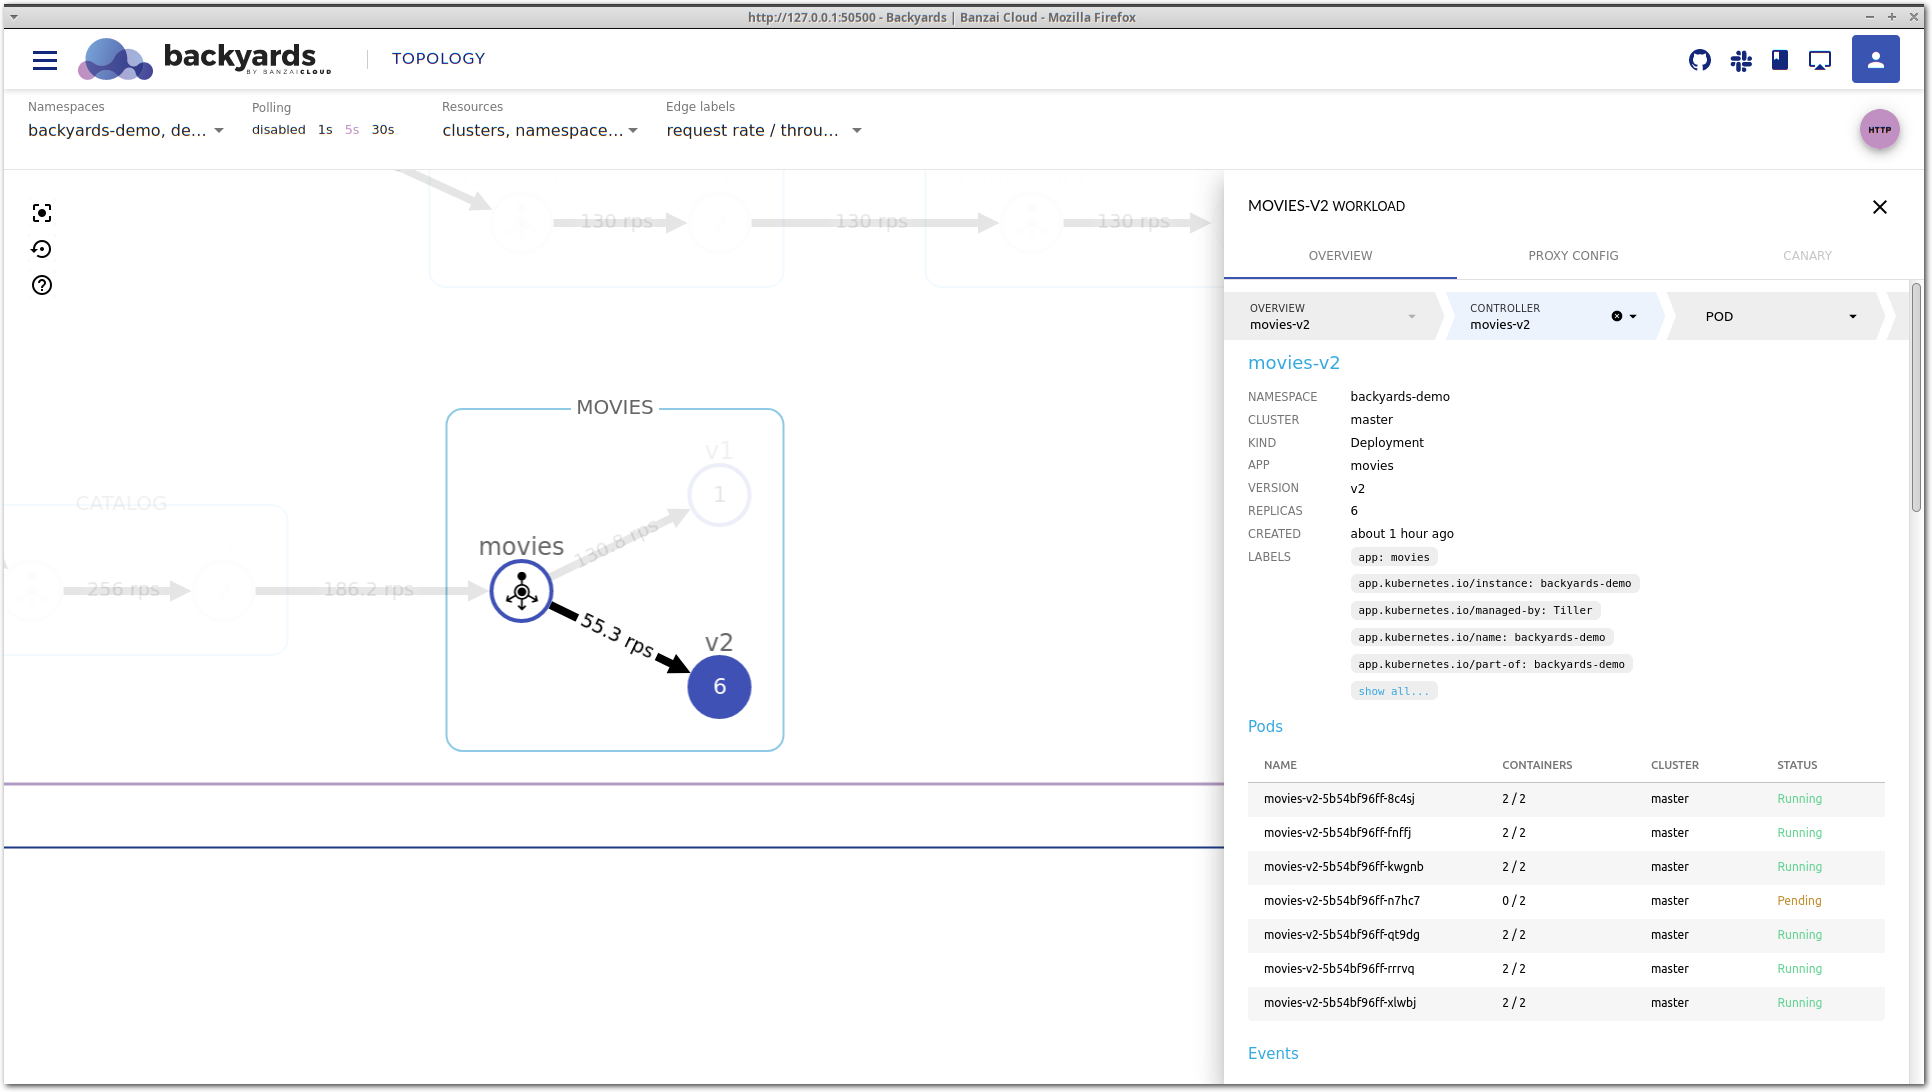
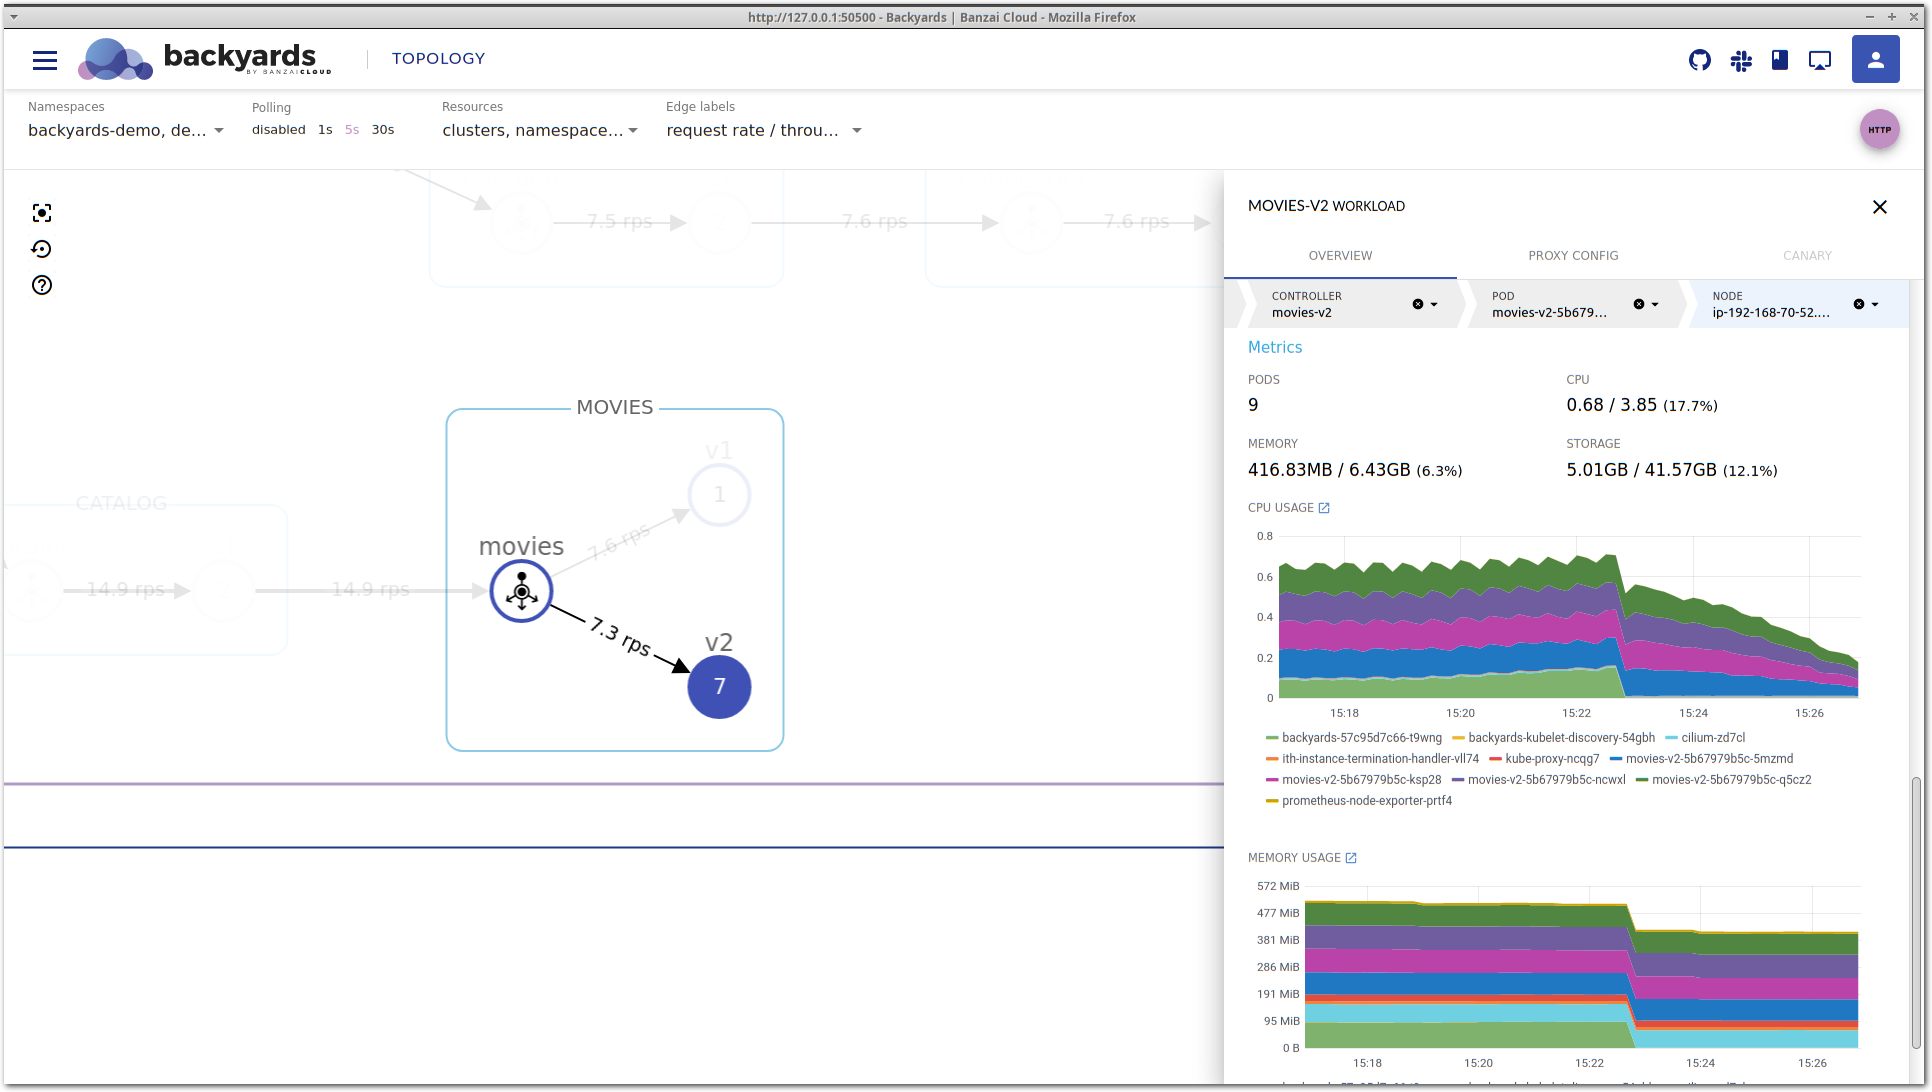
Let’s take a look around in Backyards (now Cisco Service Mesh Manager) for clues about what the problem might be. Clicking on the movies-v2 workload brings up the details view.
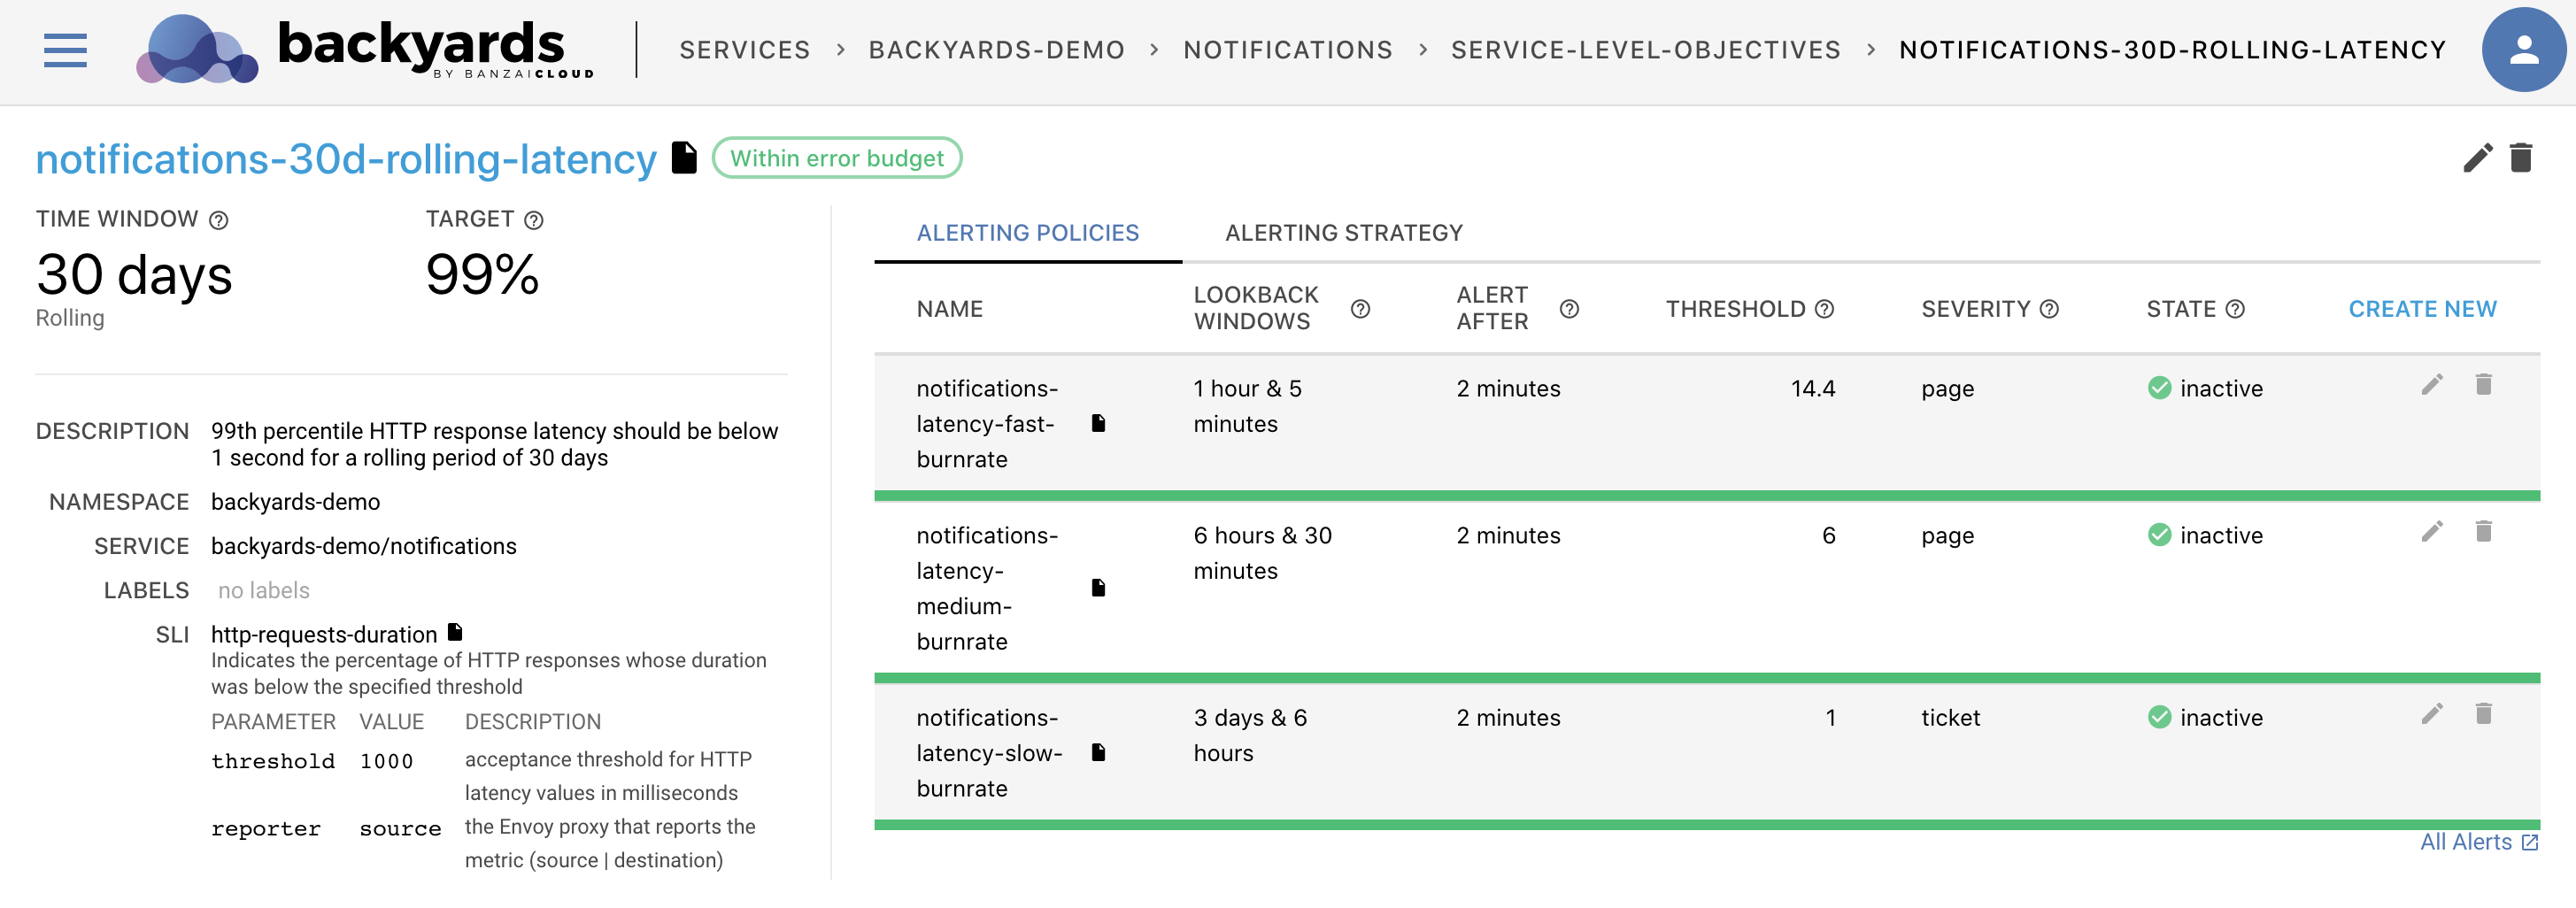
This is the service mesh layer of the drill-down view, that acts as our starting point. It contains the most important network level metrics, and an overview of the corresponding Kubernetes controllers.
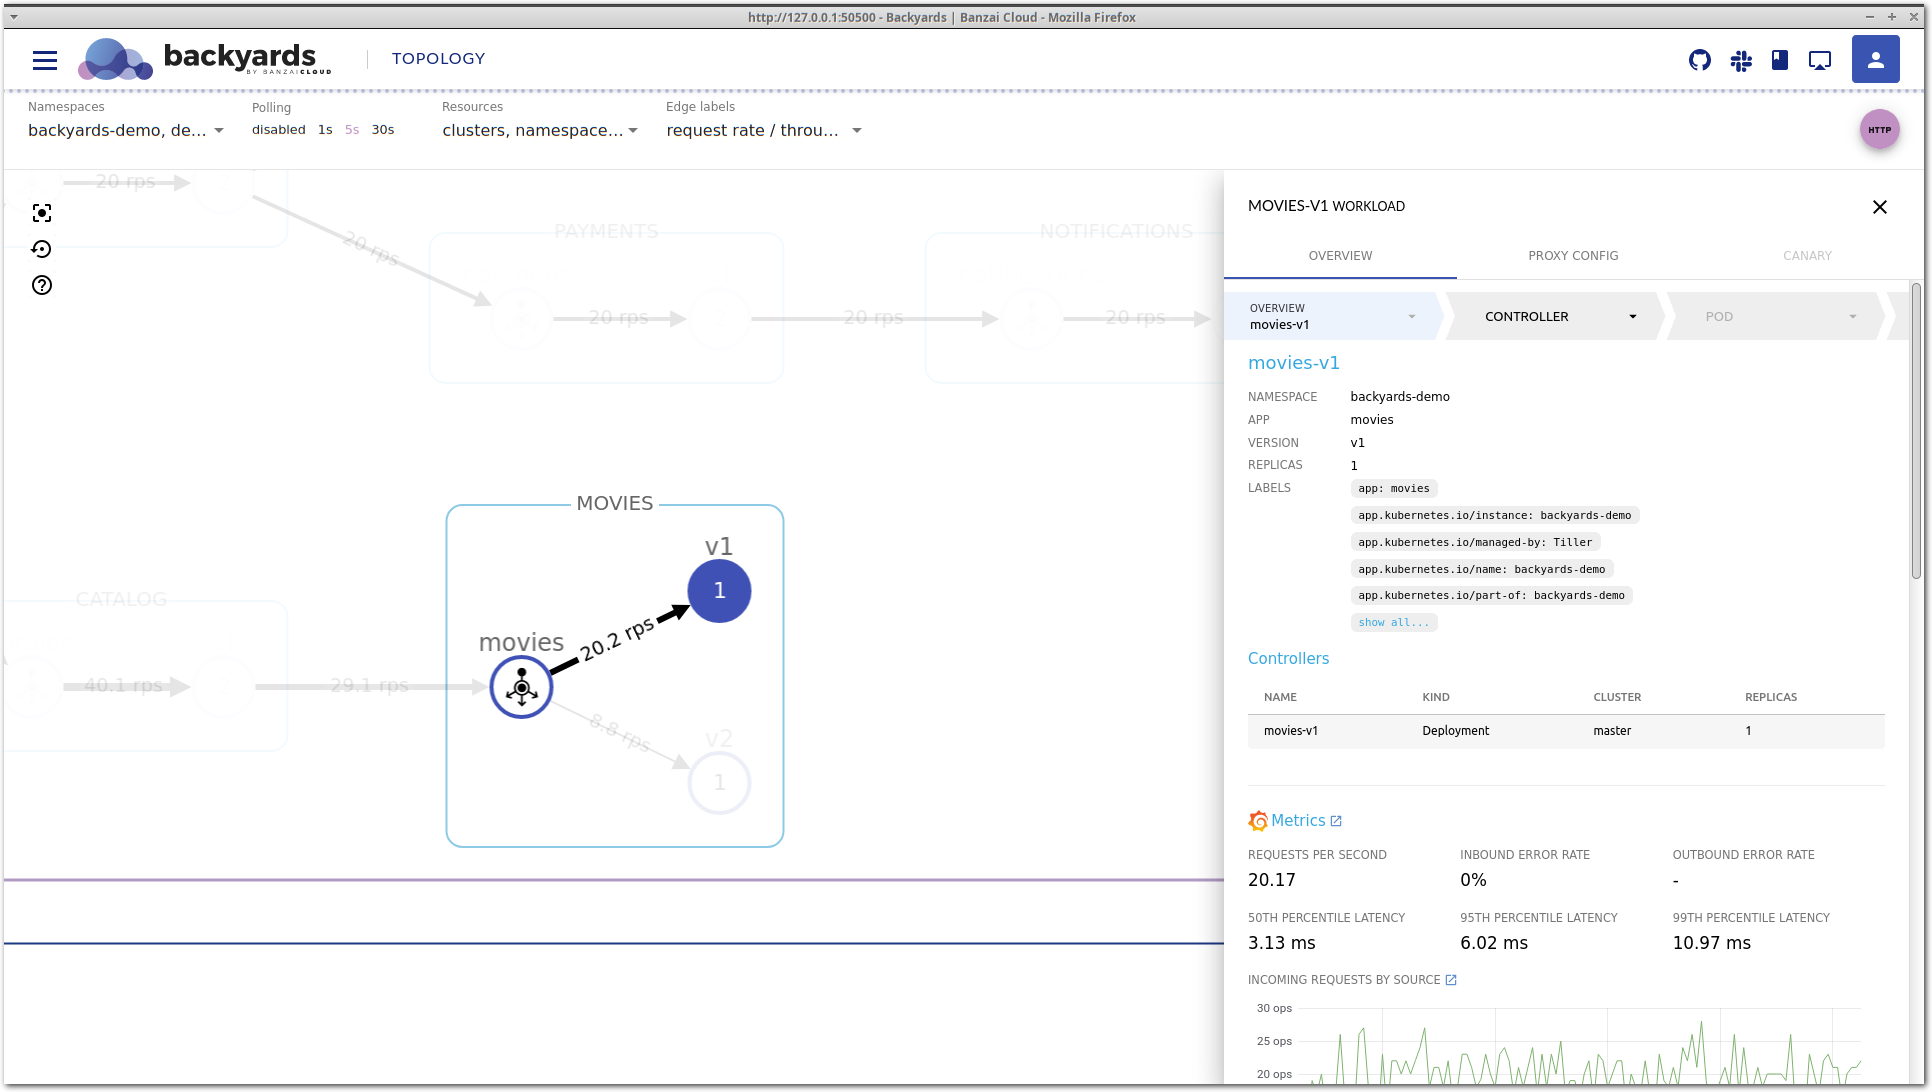
It seems that P95 latency is very high, and even P50 latency is much higher than that of movies-v1, so something is definitely wrong with this workload.
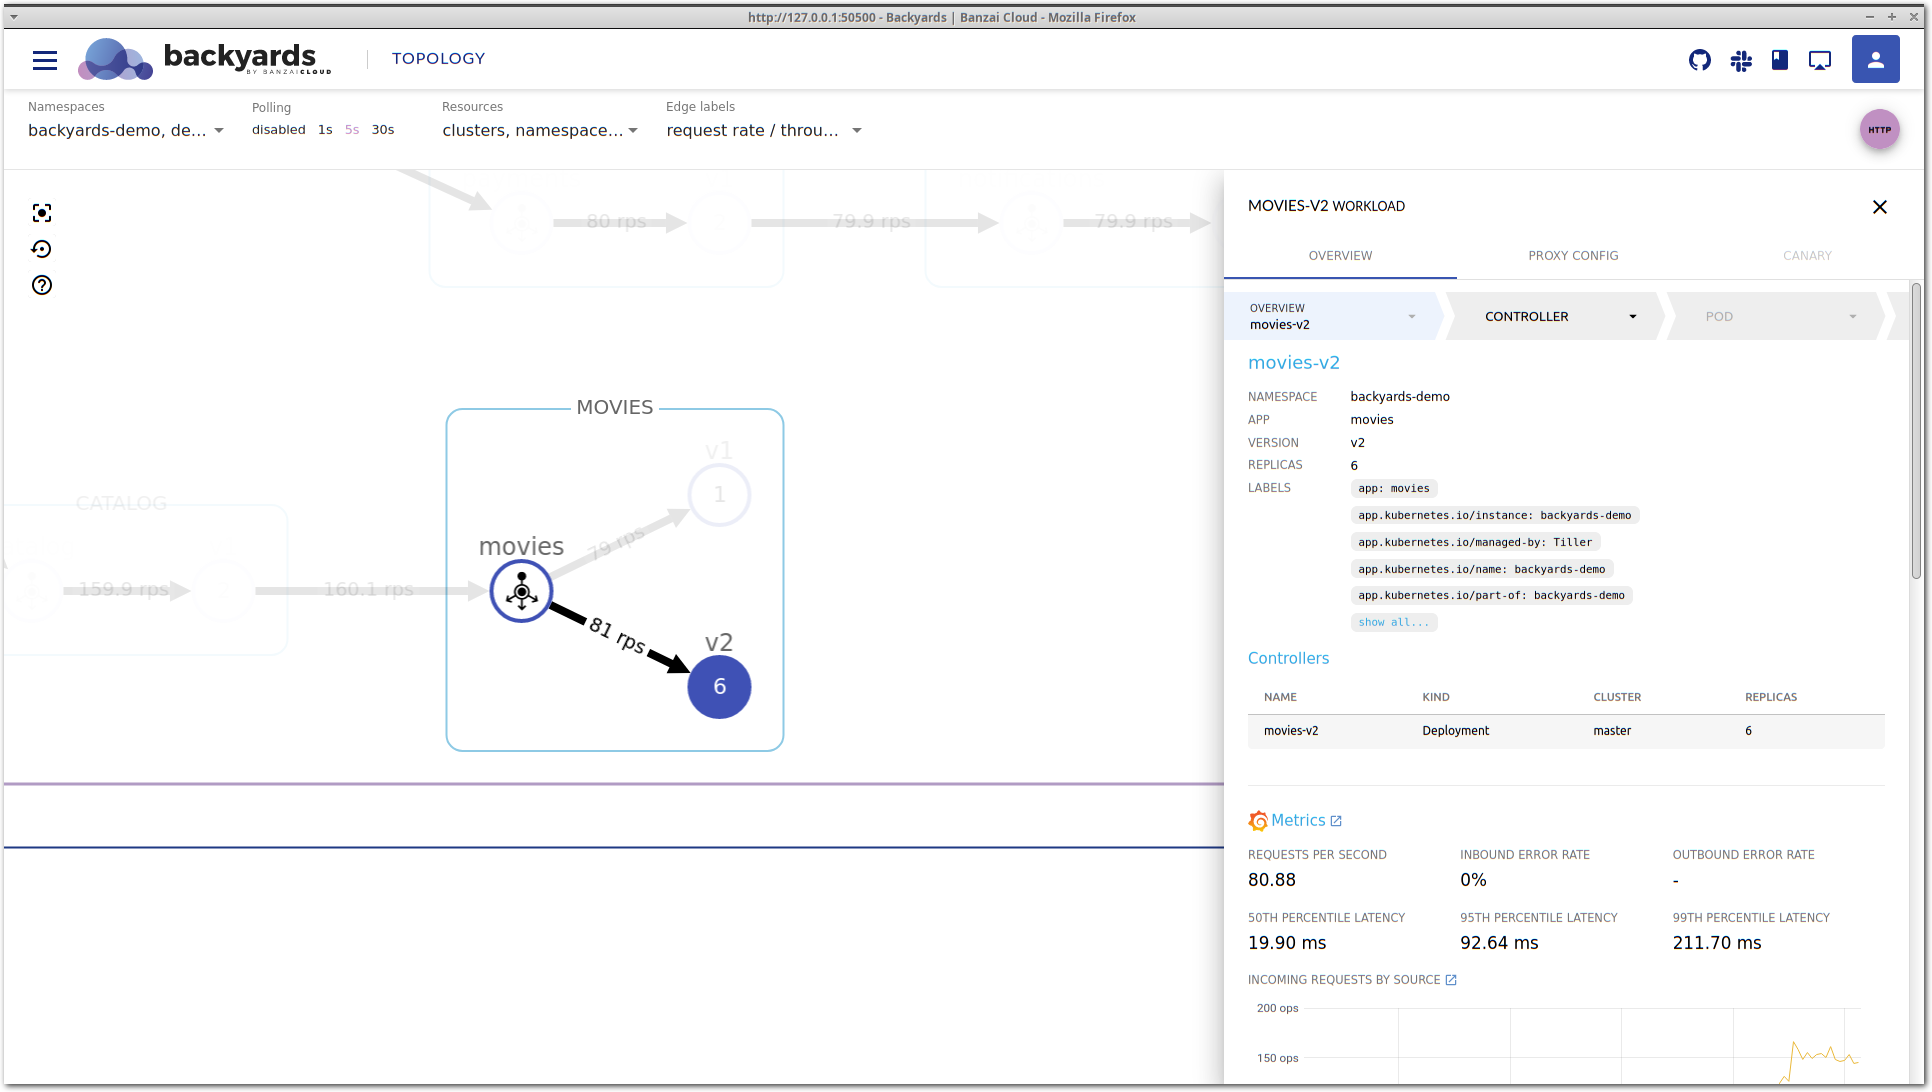
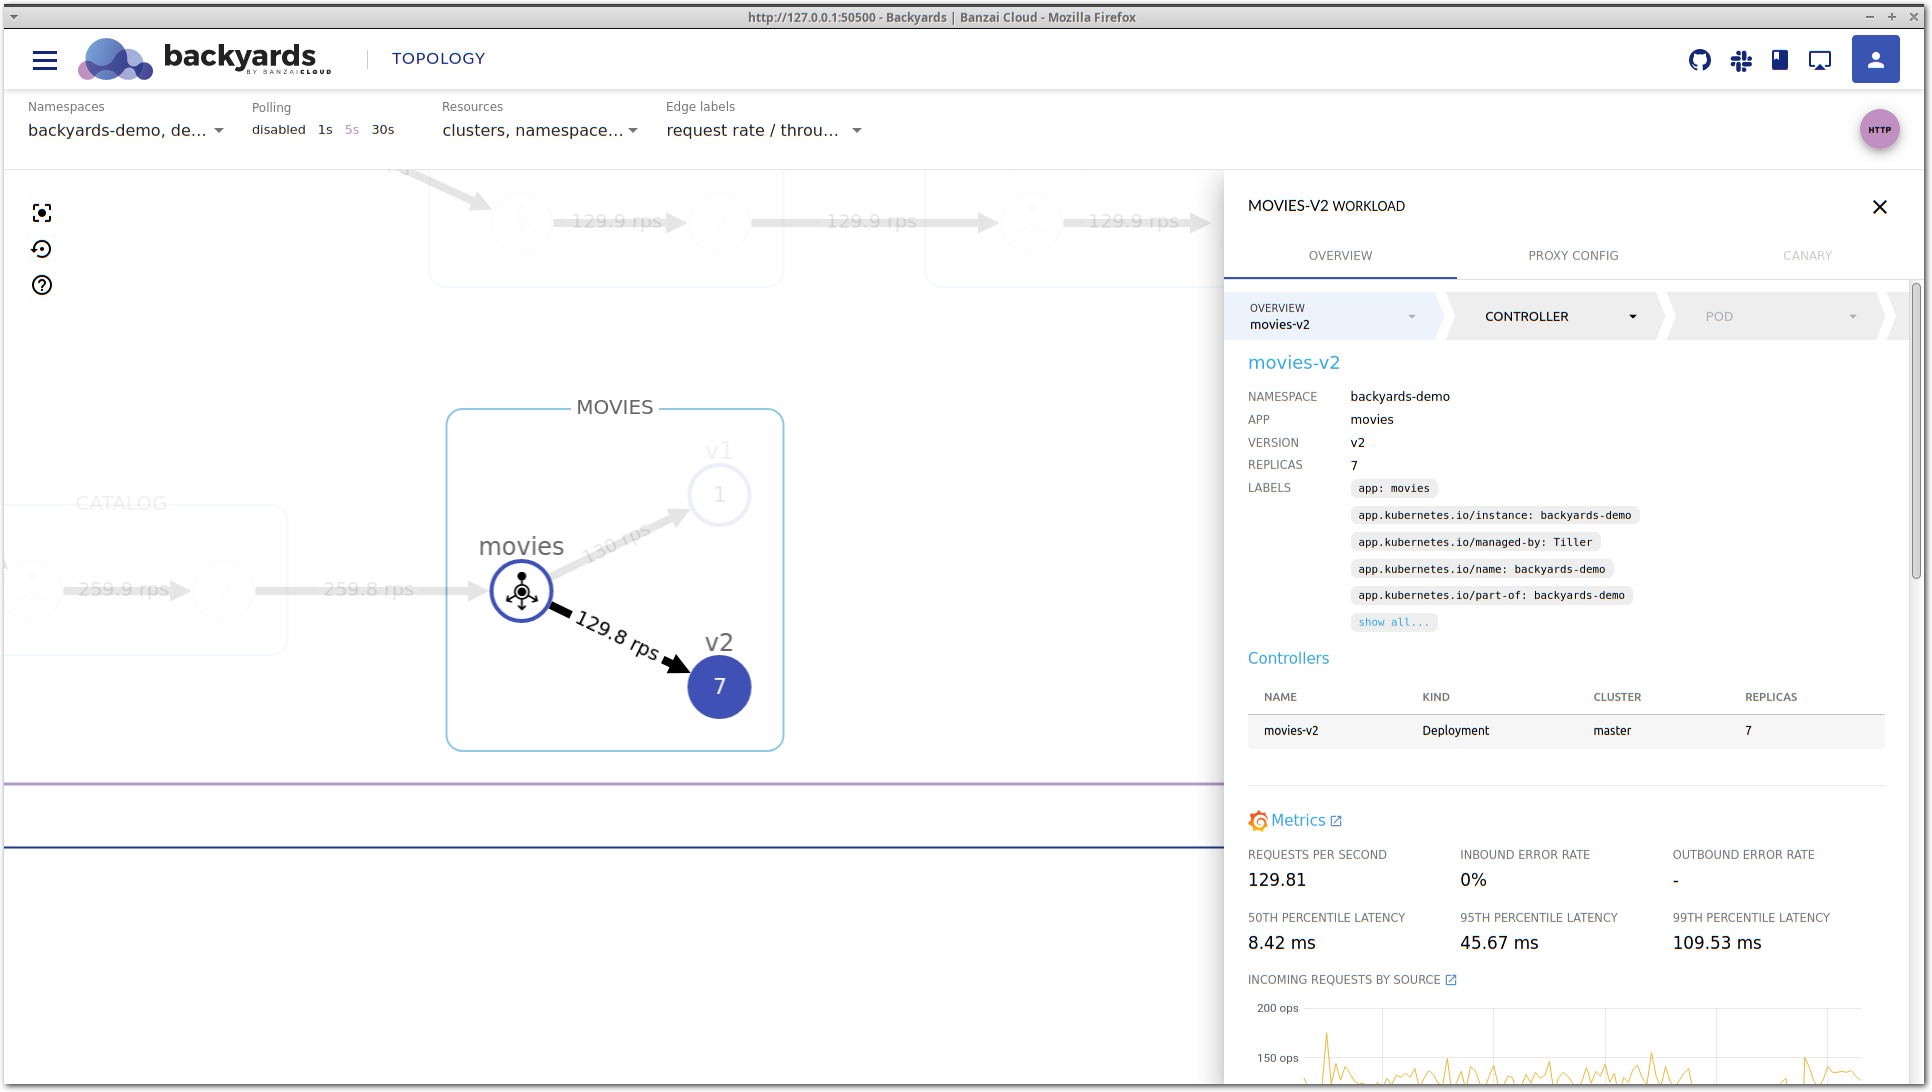
After some time, latency is decreasing again without any manual changes. If you take a close look at the Controllers section, you can see that the movies v2 deployment was scaled up to run more replicas. That’s expected, because we have a Horizontal Pod Autoscaler configured. But did it solve our problem? Well, latency is now back in the acceptable region and traffic is properly balanced. But what happens if we increase the load even more?
Let’s configure bombardier to send 130 requests/s to our microservices.
Unfortunately, after a while latency is increasing again and it doesn’t seem to be improving on its own as before.
We’ll need to dig deeper to see what’s happening.

Clicking on the movies-v2 deployment in the Controllers section takes you to the details view of the deployment itself.
You can also select the controller in the top, in the navigation bar of the details view.
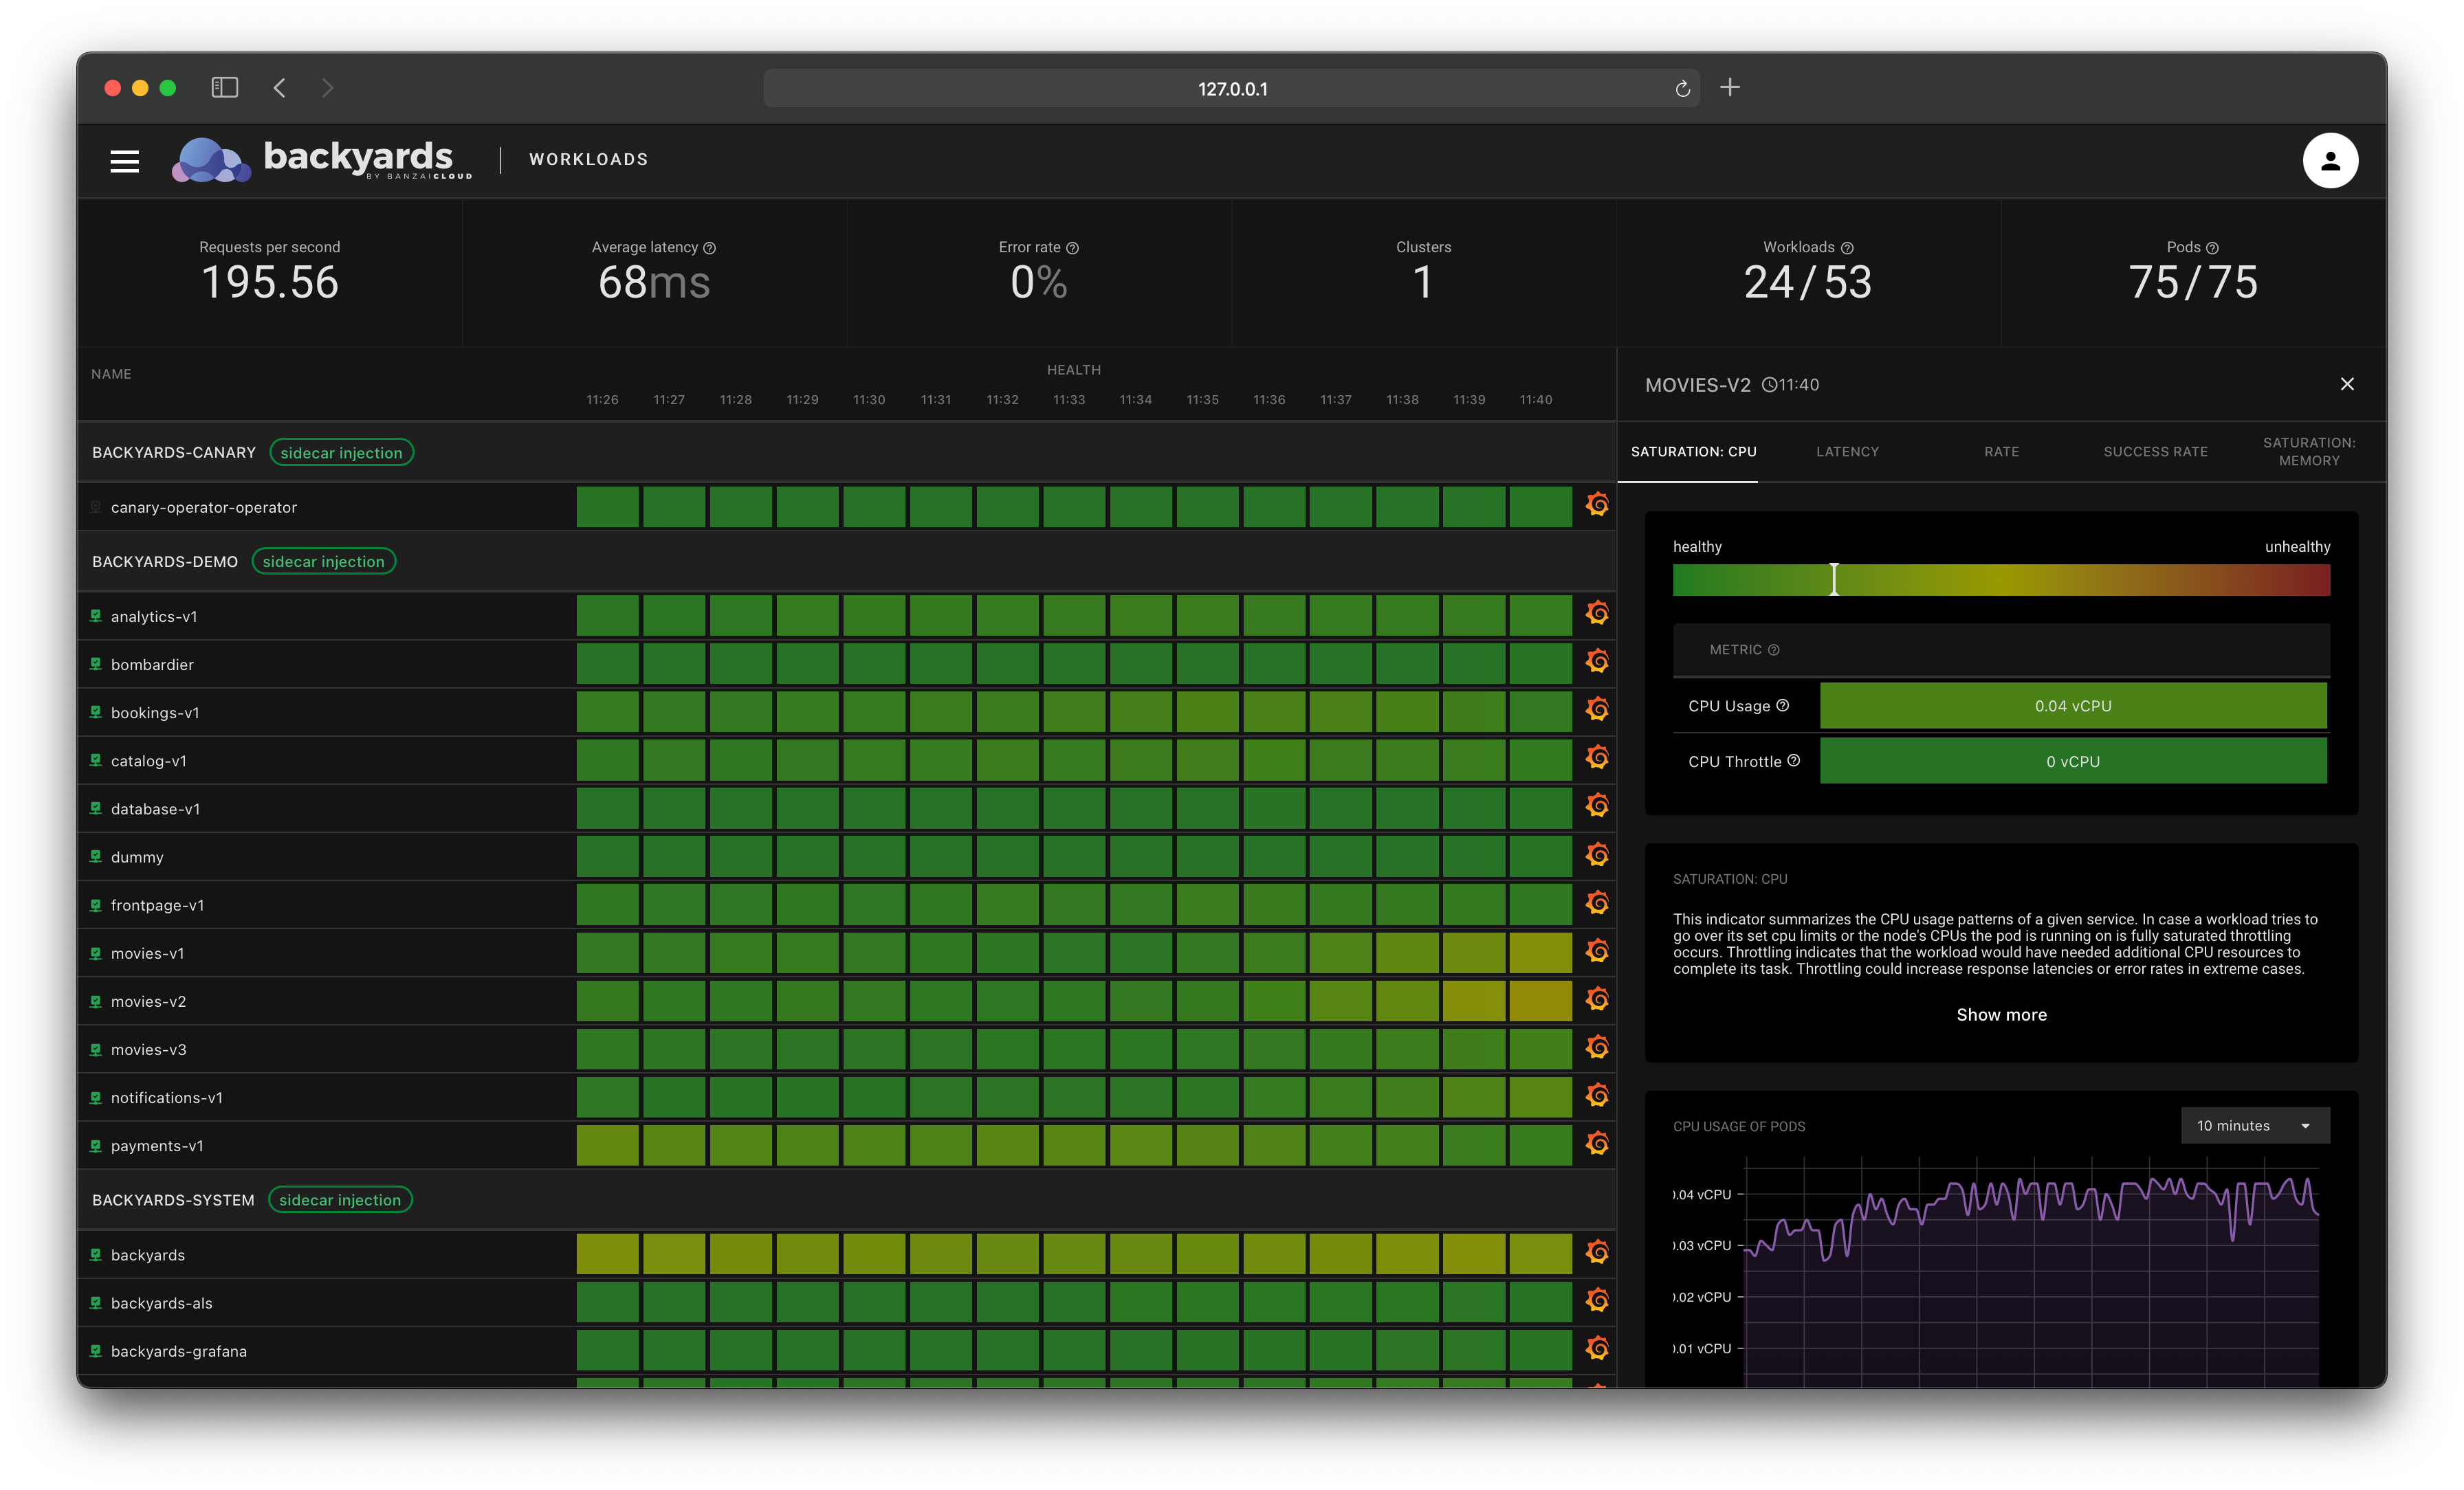
This view contains detailed information about the Kubernetes controller. It’s important to notice that this is a different level of information. While the service mesh layer displays network level metrics and an aggregated view of the corresponding controllers, this view focuses on CPU and memory metrics, and the Kubernetes resources, like related pods or events. It’s also possible that multiple controllers belong to the same service mesh entity, for example in a shared control plane multi-cluster scenario, when multiple clusters are running controllers that belong to the same logical workload.
Back to our example: on the controller view, you can see that there is a pending pod for the movies-v2 deployment.
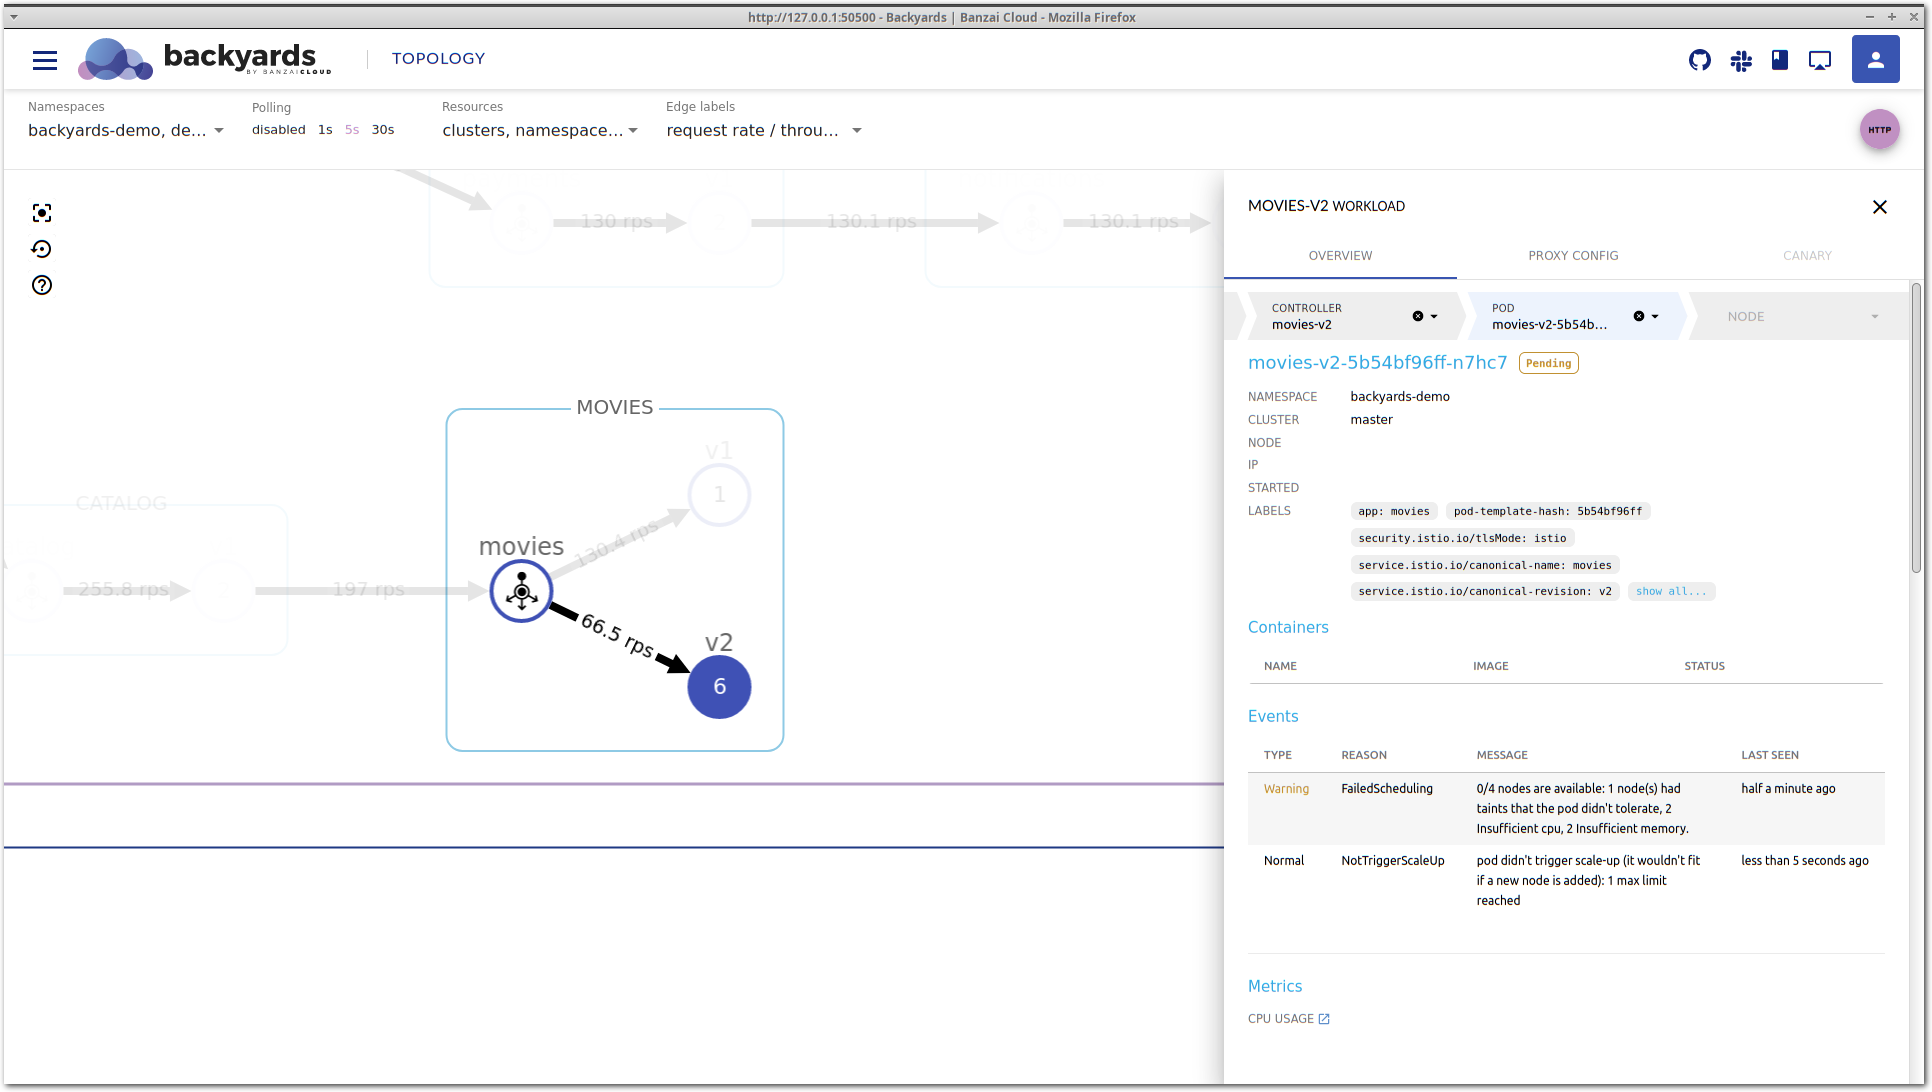
Let’s go deeper in the stack by clicking on the pending pod to see what’s happening to it.
The pod view is very similar to the controller view. It shows high-level CPU and memory metrics, and the Kubernetes status of a particular pod, along with containers that run inside, and corresponding Kubernetes events.
In the Events section of the pod view lies the answer for the high latency of the movies-v2 workload. Kubernetes could not schedule this pod on any of the nodes because no node is available in the cluster with enough CPU and memory to satisfy the resource requests of this pod. Also, no new node is being
started because all node groups in the cluster reached their maximum size. This is what max limit reached means in the message.
So, there you go: the movies-v2 workload would need more resources to properly handle the incoming traffic but Kubernetes could not provide it because there are no eligible nodes to schedule additional pods, and the cluster autoscaler reached its top limit of the node count.
Solve the problem 🔗︎
Note: let’s assume that
movies-v2is really a new application version that for some reason requires way more computing capacity than previous versions. Otherwise, increased resource usage could be caused by an application bug as well, and solving that problem would include shifting all traffic back tomovies-v1, fixing the bug, and restarting the blue-green deployment.
Considering the above assumption we’ll need to make room for the new pods in the cluster. We’ll do that by increasing the node count limit and let cluster autoscaler do its job. The method of how to do that depends on what environment your Kubernetes cluster is running in. In our case, the cluster was started using Pipeline, so I could easily adjust the limit and allow Kubernetes to add more nodes to the cluster.
Doing this resulted in the launch of a node where the pending pod could fit in, and now enough resources are allocated for the processing of the incoming traffic volume. This can be seen on both the topology and the workload details view: requests/s is about the same on both movies-v1 and movies-v2, and the latency is starting to normalize on movies-v2.
Checking node health 🔗︎
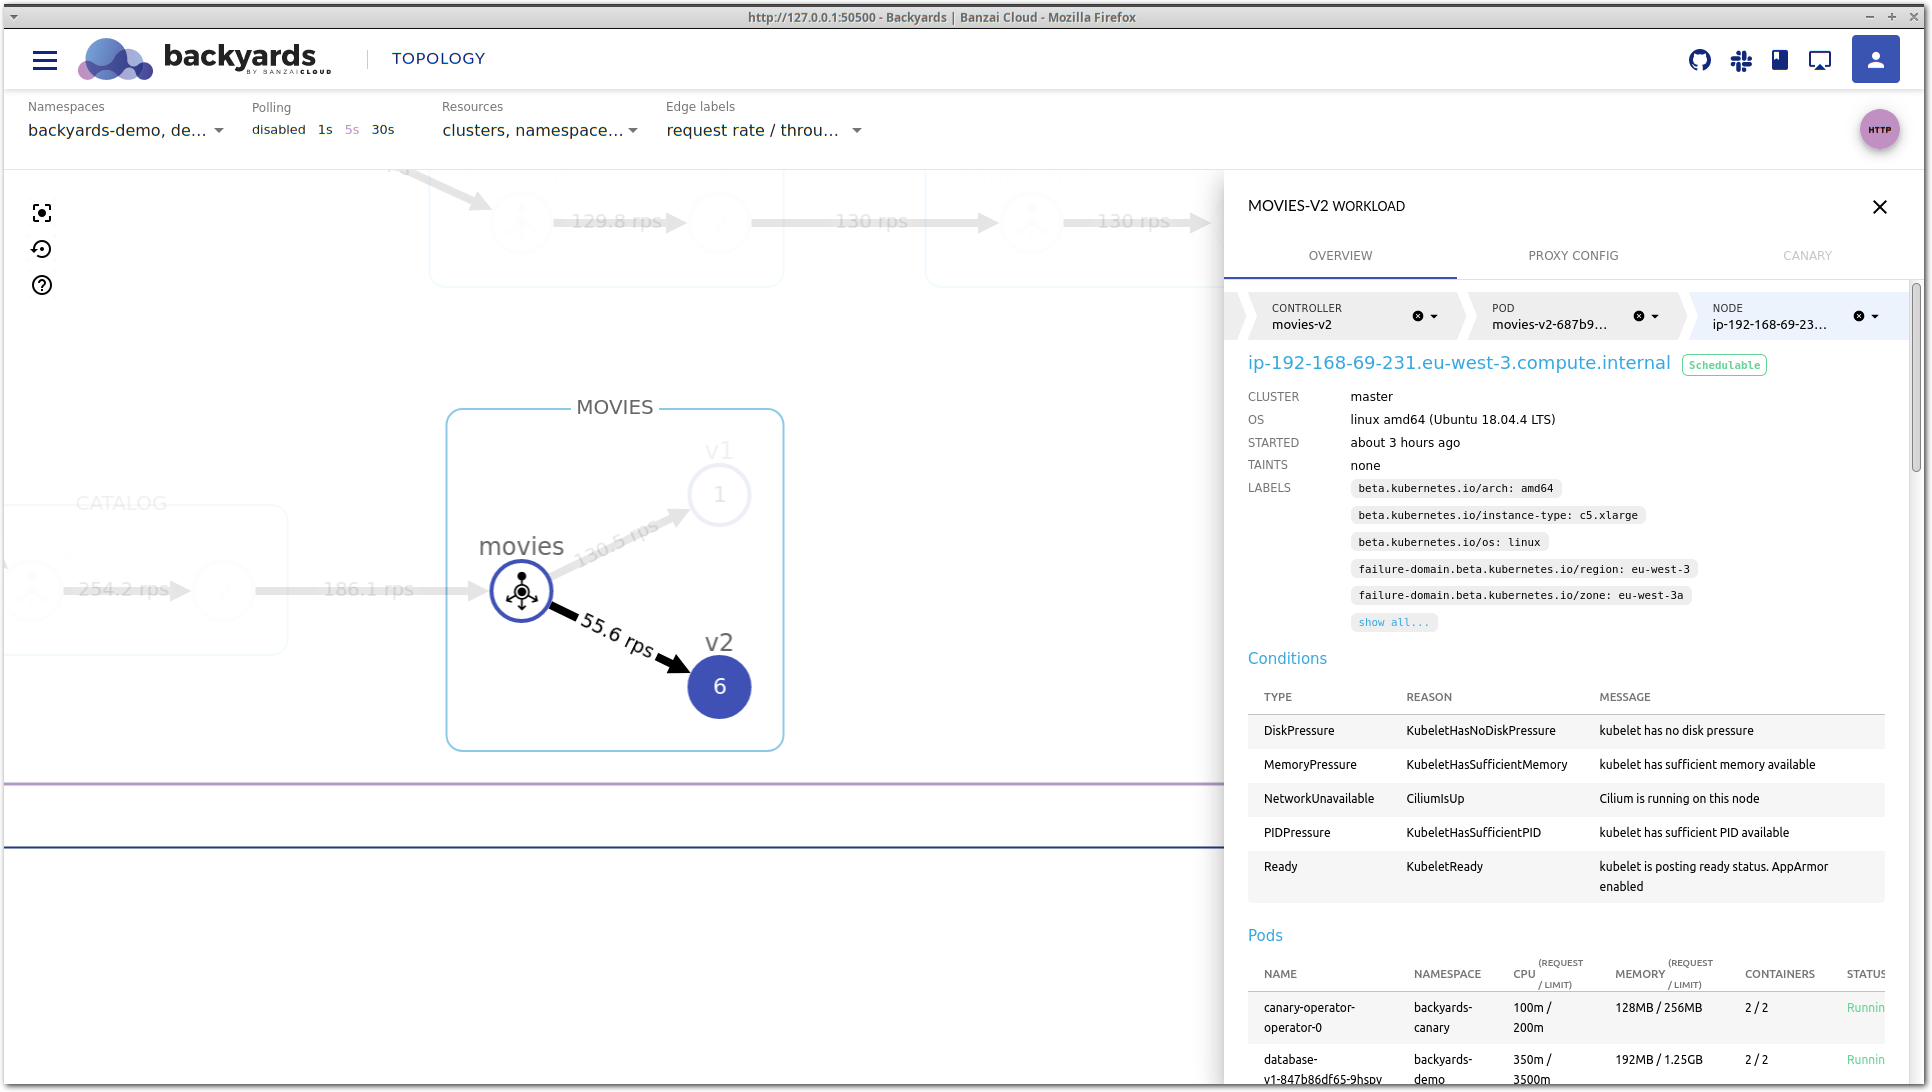
We could have also dug deeper from the pod details view, to see the details of the node a given pod is running on. This could provide insight into the health of a node. Perhaps the resource request is too low for a container, and the node gets too crowded for seamless handling of work? Or maybe the disk is getting full on the node? This and other problems could easily be identified on the node details view. In our case, there doesn’t seem to be any problem with the node.
The node view is the deepest layer of the drill-down view and holds information about a Kubernetes node. You’ll see the current status, taints, disk and memory pressure, or network and kubelet status along with a few other important conditions. And of course there are the pods that are currently running here and the most important CPU and memory metrics.
Wrap-up 🔗︎
With the drill-down feature, Backyards (now Cisco Service Mesh Manager) is a bit more than only a service mesh product and Istio distribution. It’s a more complete observability tool, that not only provides information based on the network metrics of the Istio service mesh, but includes other valuable telemetry, like the CPU and memory usage of pods or nodes. Drill-down is extensible with third party metadata and telemetry providers as well.
Check out Backyards in action on your own clusters!
Want to know more? Get in touch with us, or delve into the details of the latest release.
Or just take a look at some of the Istio features that Backyards automates and simplifies for you, and which we’ve already blogged about.