Here at Banzai Cloud we blog a lot about Prometheus and how to use it. One of the problems we have so far neglected to discuss is the inadequate long term storage capability of Prometheus. Luckily a new project called Thanos seeks to address this. If you are not familiar with Prometheus, or are interested in other monitoring related articles, check out our monitoring series, here:
Monitoring series:
Monitoring Apache Spark with Prometheus
Monitoring multiple federated clusters with Prometheus - the secure way
Application monitoring with Prometheus and Pipeline
Building a cloud cost management system on top of Prometheus
Monitoring Spark with Prometheus, reloaded
Thanos 🔗︎
Thanos was conceived with the goal in mind of extending Prometheus with archiving features. What does that mean? Thanos uses Prometheus’ immutable storage protocol to archive data that doesn’t change. In practice, it reads the chunks from the filesystem and backs them up to object storage with metadata information.
If you need a more in-depth explanation of what Thanos is, you can find that here, otherwise read on:
- Prom Meetup Slides understanding Thanos design.
- Introduction blog post a really good article about
Thanosprinciples.
Thanos is a highly available Prometheus setup with long term storage capabilities.
Components 🔗︎
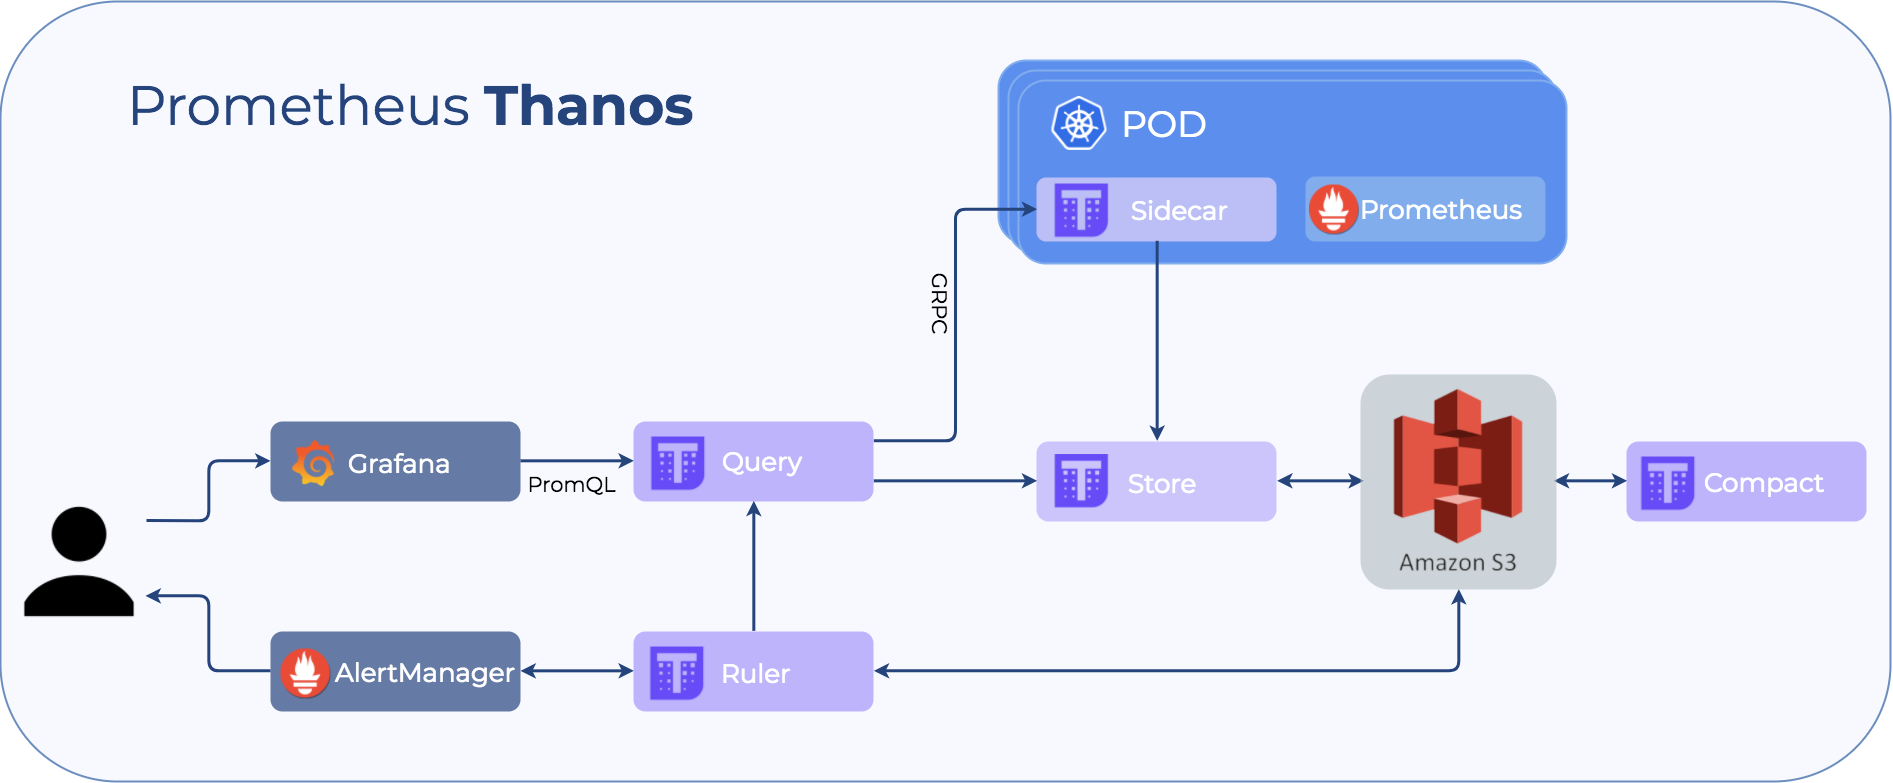
To understand how Thanos’ components work, we will go through them one by one:
-
Sidecar This is the main component that runs along Prometheus. It reads and archives data on the object store. Moreover, it manages Prometheus’ configuration and lifecycle. To distinguish each Prometheus instance, the sidecar component injects external labels into the Prometheus configuration. This component is capable of running queries on Prometheus servers’ PromQL interface. Sidecar components also listen on Thanos gRPC protocol and translate queries between gRPC and REST.
-
Store The Store service is able to read data and metadata from the object store. It listens to Thanos gRPC protocol.
-
Query The Query component listens on HTTP and translates queries to Thanos gRPC format. It aggregates the query result from different sources, and can read data from
SidecarandStore. In HA setup, it even deduplicates the result. -
Compact This service downsamples and compacts data on the object store.
-
Ruler Ruler basically does the same as thing as Prometheus’ rules. The only difference is that it can communicate with Thanos components.
Warning: no more than one compact service should run on a bucket. Running more than one may result in inconsistent data.
Try things out 🔗︎
Okay, so we have a cursory understanding of what Thanos does. Now we can set-up a complete Thanos deployment. As time of writing, Thanos supports GCP’s storage, so we’ll use that. AWS support is in beta/under development, but we hope to see more S3 compatible backends in the future. For starters, we need to create a GCP Storage bucket and a Service account for Thanos.
Creating a GCE service account 🔗︎
To create the GCE service account, follow these three steps.
It should be noted that we automate all these steps with Pipeline
Step 1 🔗︎
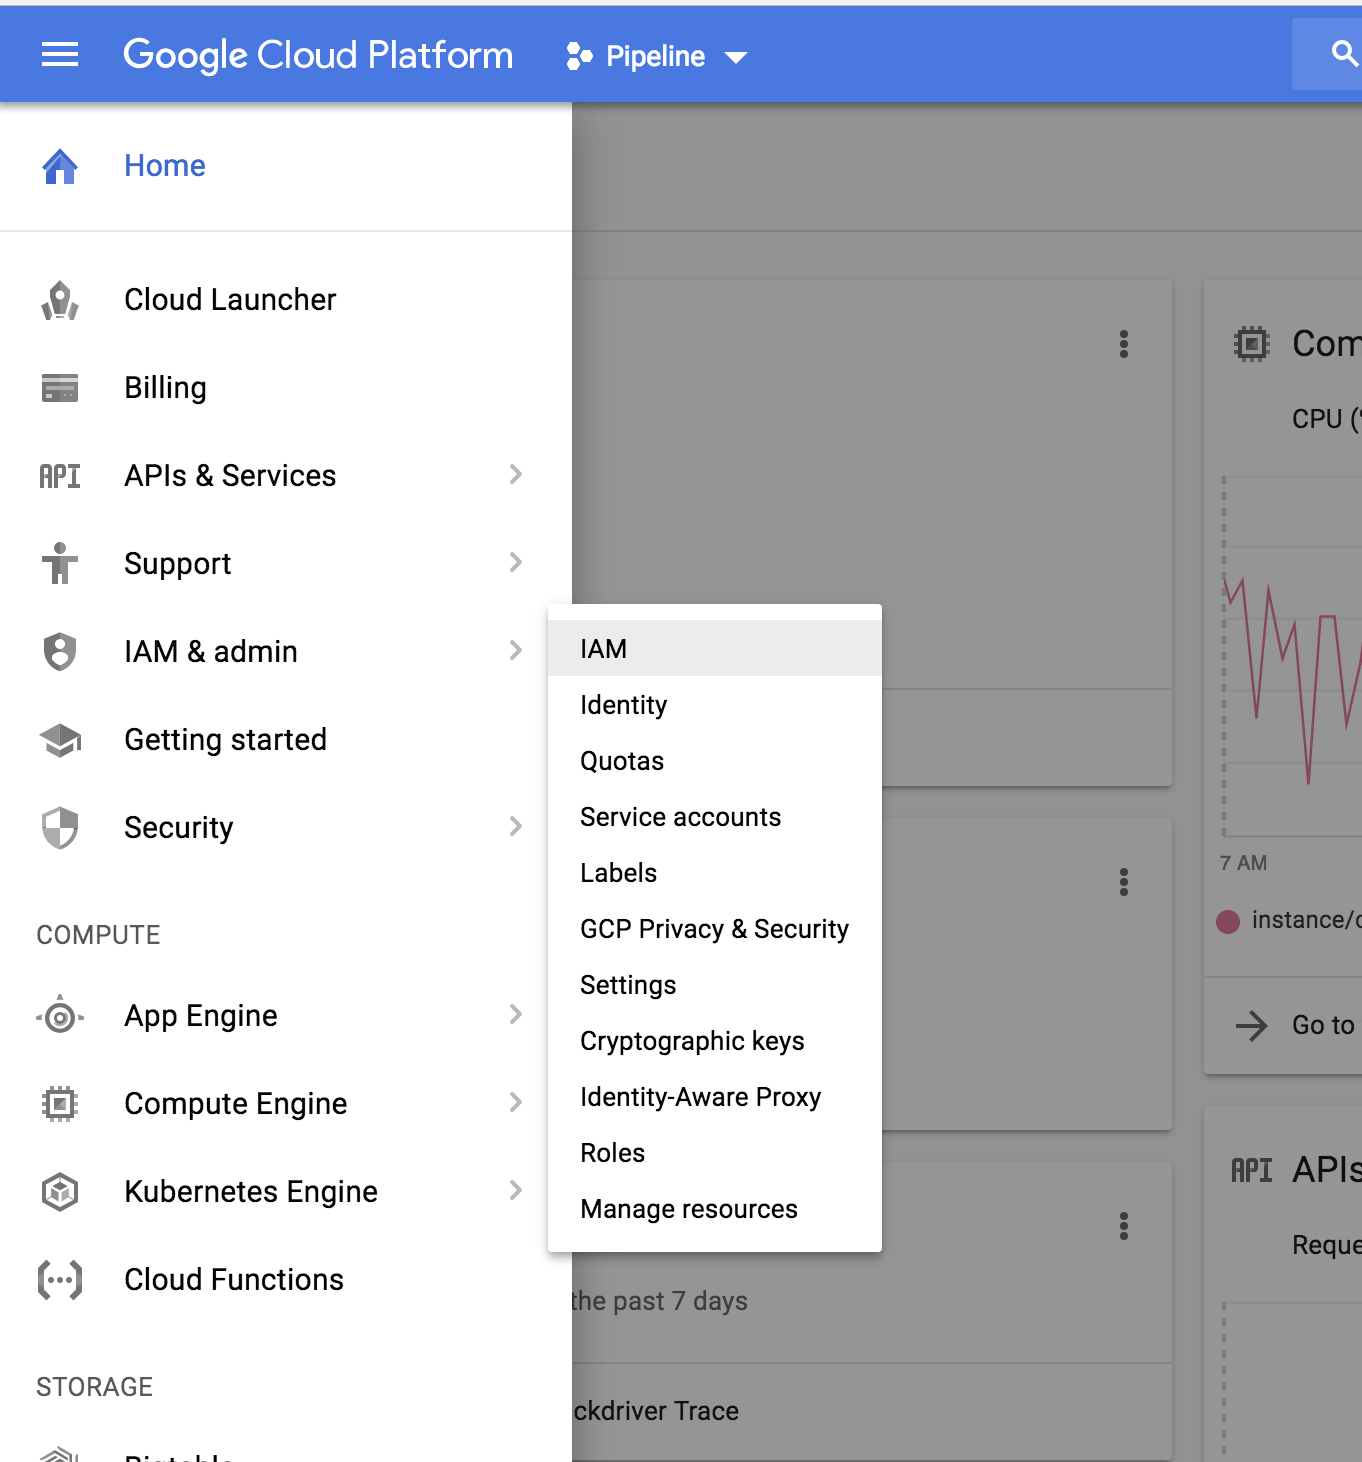
In the main menu select IAM configuration
Step 2 🔗︎
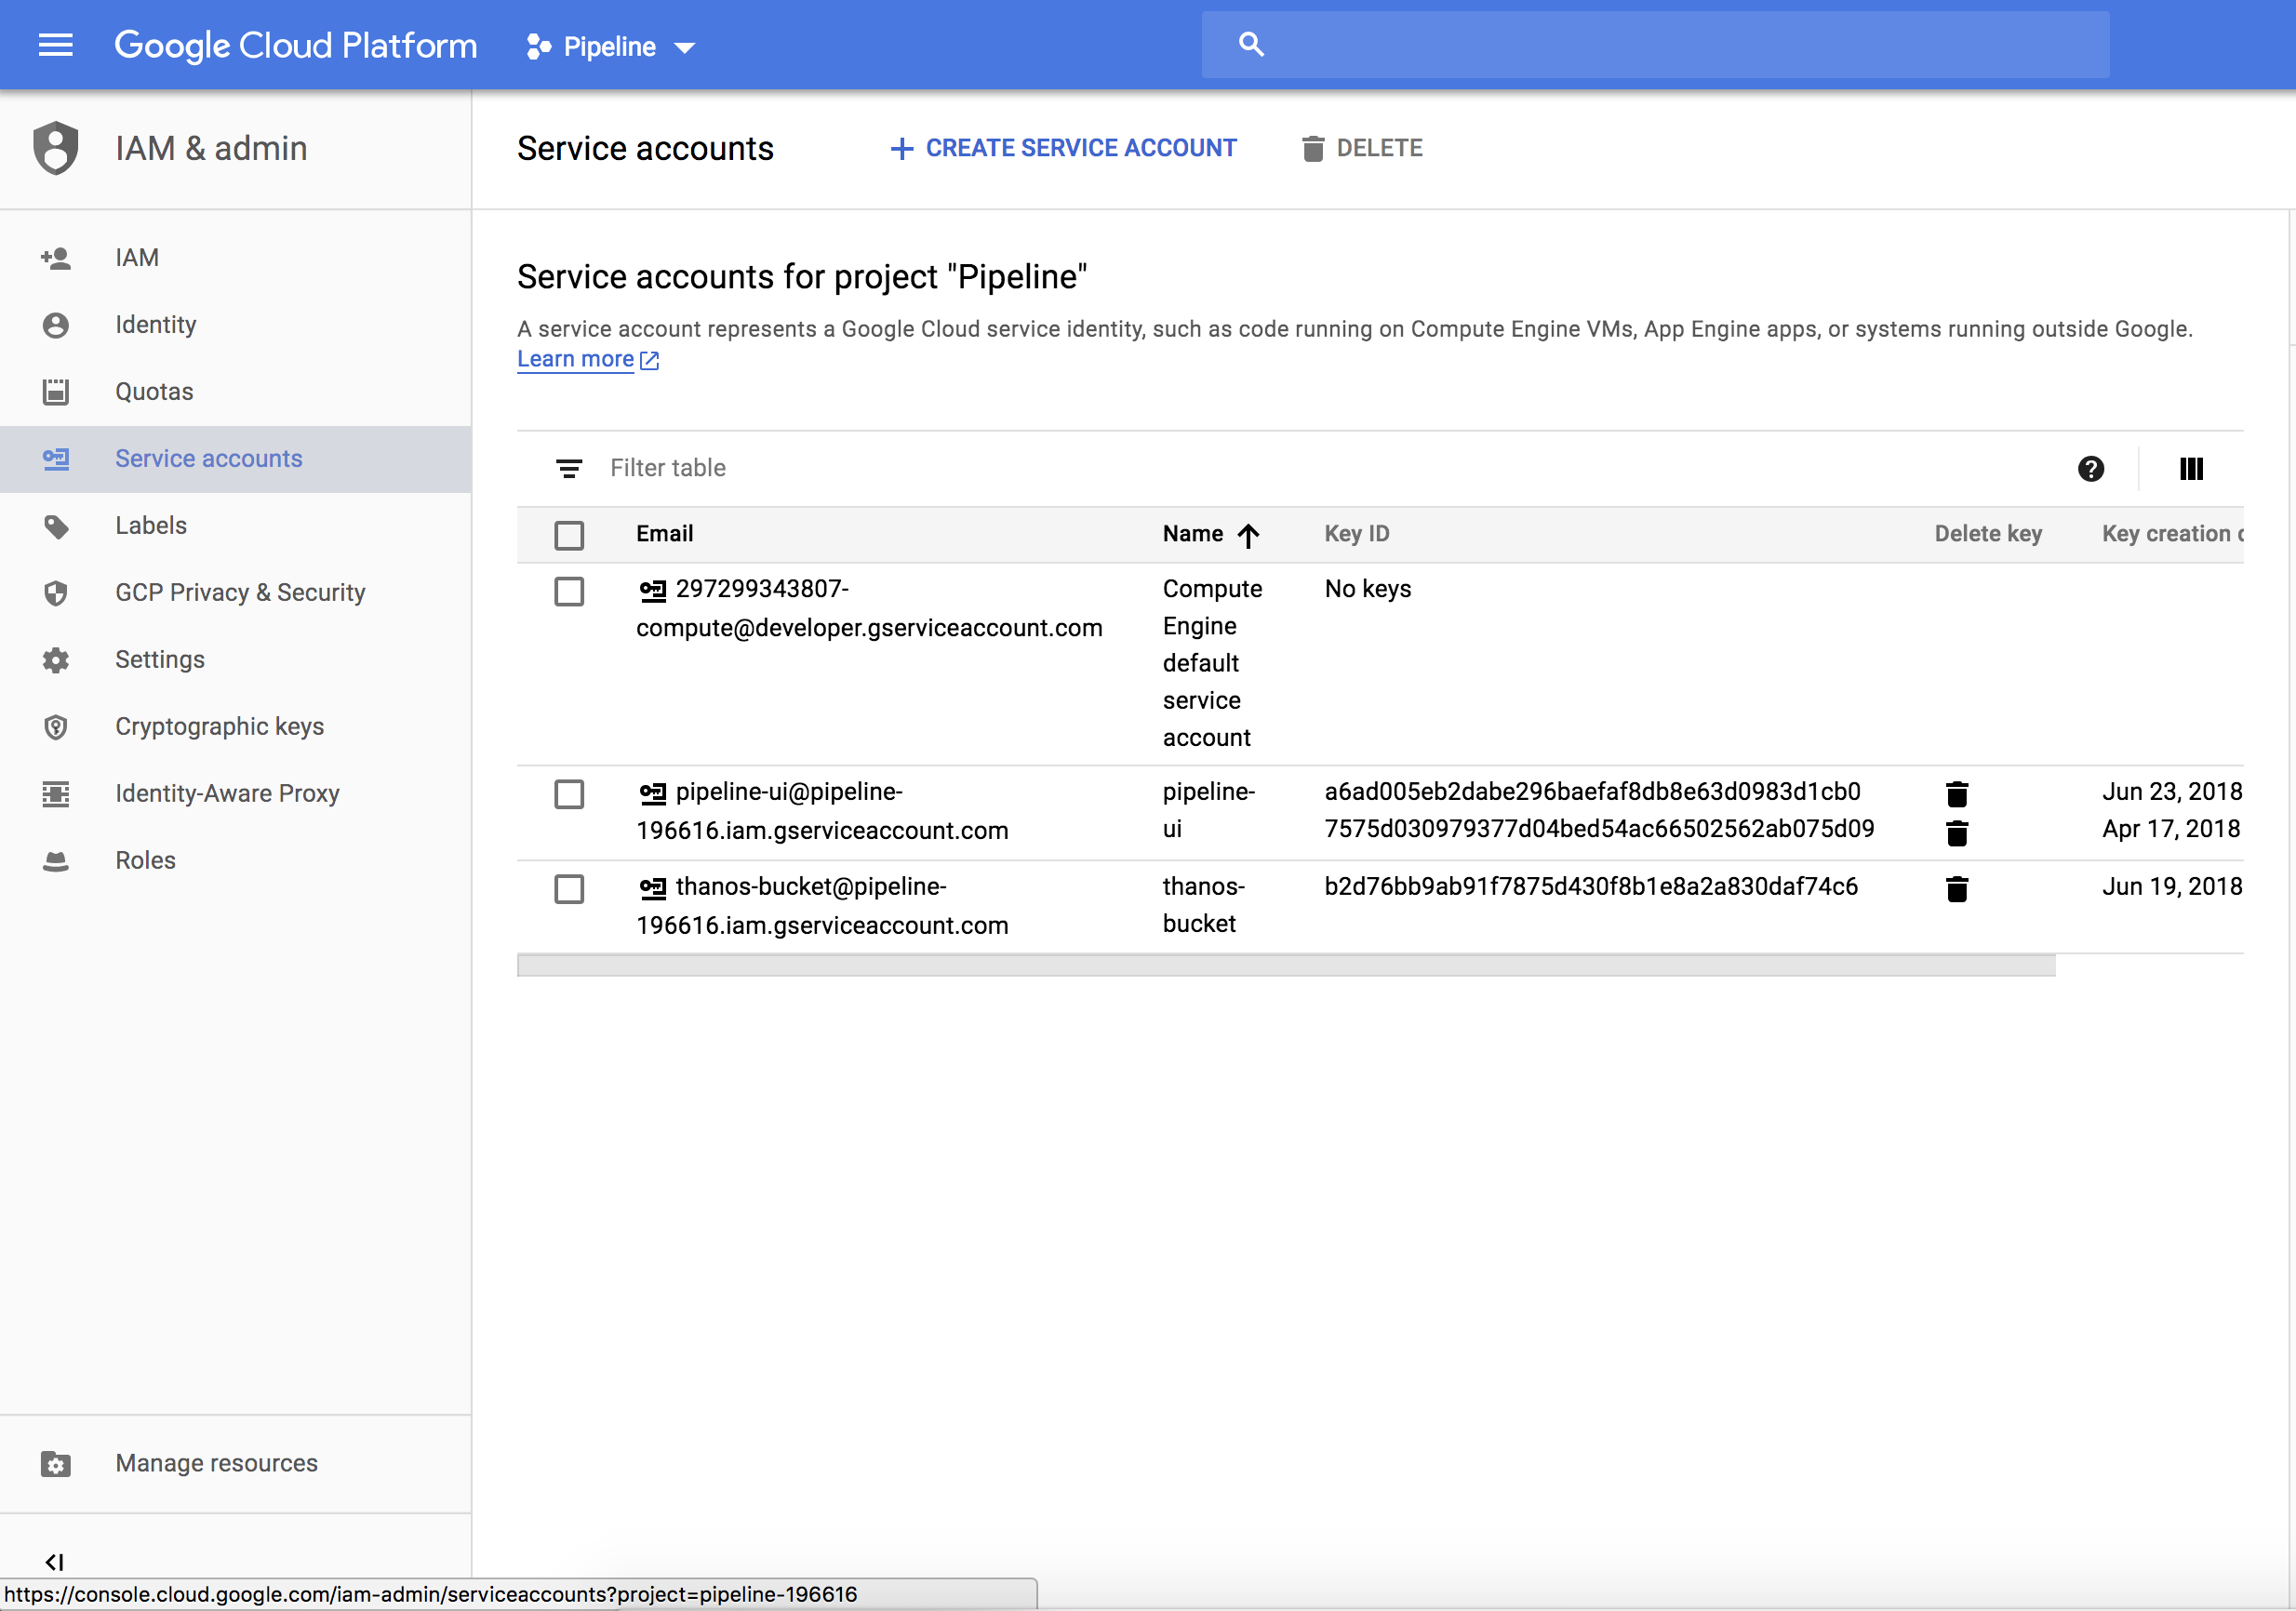
Choose service account, and click Create service account
Step 3 🔗︎
Select Storage option and create the service account.
- Roles for deployment: Storage Object Creator and Storage Object Viewer
- Roles for testing: Storage Object Admin to create and delete temporary buckets.
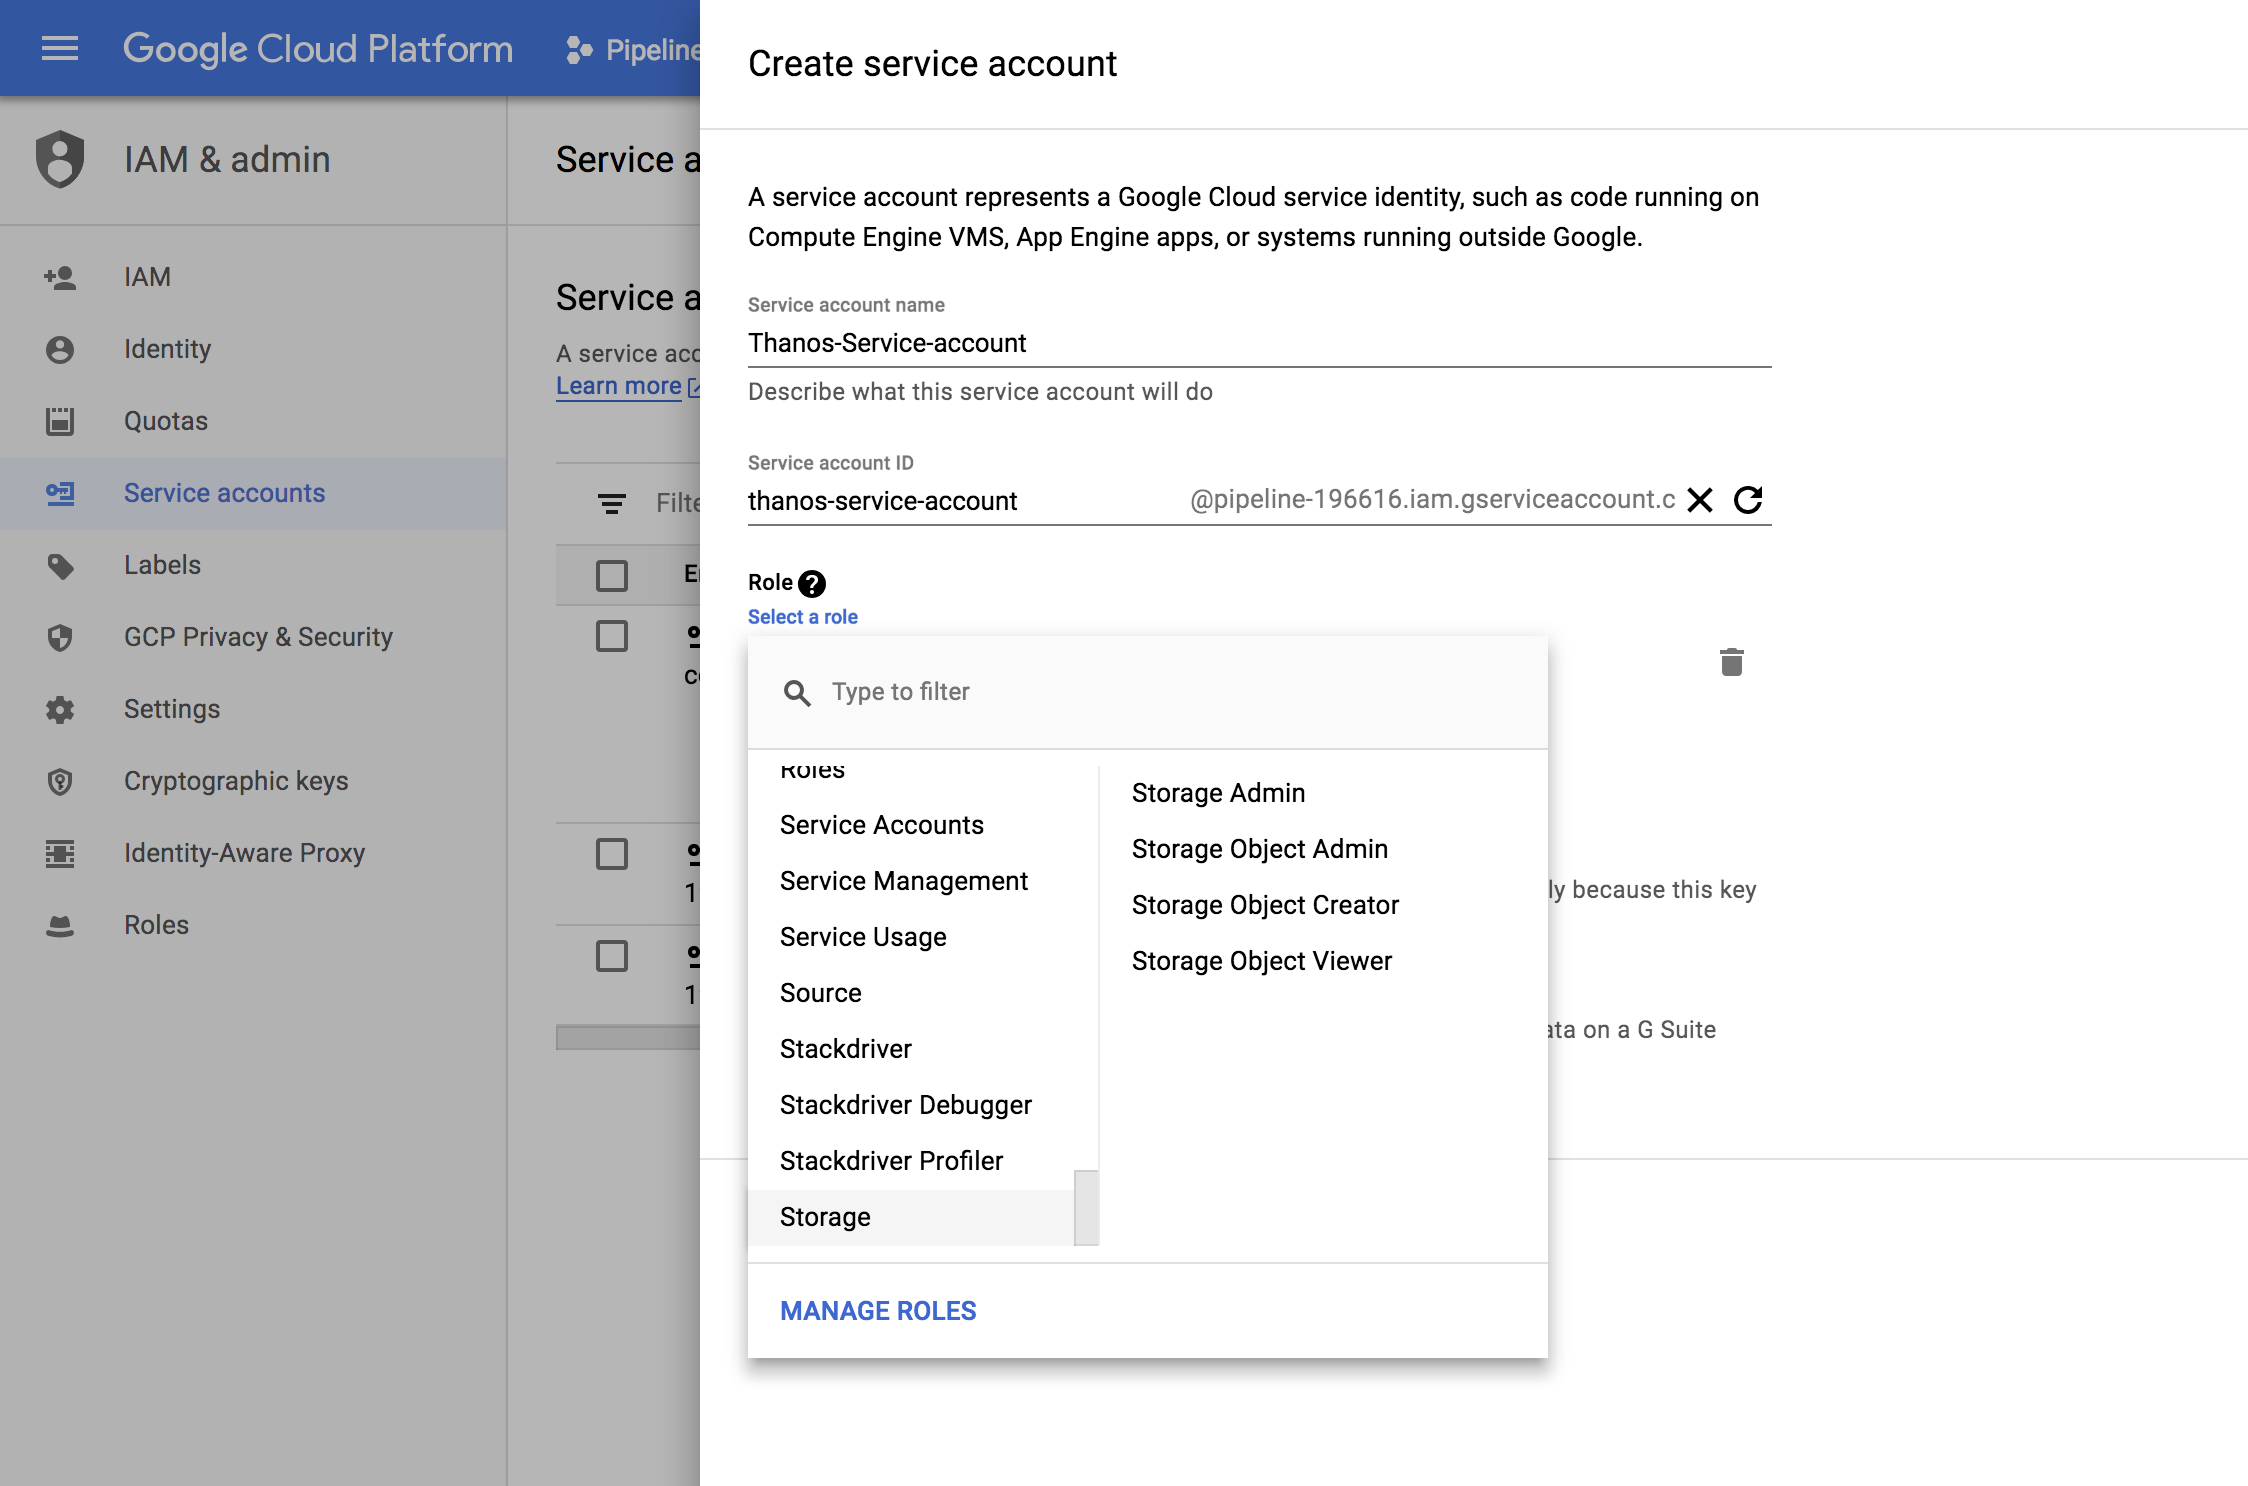
After successful creation, a JSON file will be downloaded. Now we need to create a Kubernetes secret from our GCS account.
$: kubectl create secret generic gcs-credentials --from-file=gcs-credentials.jsonNote: Don’t forget to rename the downloaded json gcs-credentials.json
Thanos sidecar configuration
 - "sidecar"
 - "--log.level=debug"
 - "--tsdb.path=/var/prometheus"
 - "--prometheus.url=http://127.0.0.1:9090"
 - "--cluster.peers=thanos-peers.default.svc.cluster.local:10900"
 - "--gcs.bucket={{ .Values.gcs.bucket }}"
 - "--reloader.config-file=/etc/prometheus/prometheus.yml.tmpl"
 - "--reloader.config-envsubst-file=/etc/prometheus-shared/prometheus.yml"
Explaining parameters:
| Name | Description | Value |
|---|---|---|
| --log.level | Setting the log-level | debug |
| --tsdb.path | Path to the Prometheus storage | /var/prometheus |
| --prometheus.url | URL for the Prometheus server | http://127.0.0.1:9090 |
| --cluster.peers | Service discovery for other Thanos components | thanos-peers.default.svc.cluster.local:10900 |
| --gcs.bucket | GCE bucket name | thanos-gce-bucket |
| --reloader.config-file | Pormetheus configuration file template (Go Template) | /etc/prometheus/prometheus.yml.tmpl |
| --reloader.config-envsubst-file | Target prometheus configuration (Template output) | /etc/prometheus-shared/prometheus.yml |
Installing 🔗︎
The project offers the basic Kubernetes manifest files required to install Thanos. You can check them out, here.
Since we deploy everything through Helm charts, it’s a good idea to create from them. This will soon be released into our master branch repository.
- banzaicloud-stable http://kubernetes-charts.banzaicloud.com/branch/master
$: helm install banzai-stable/thanosAfter a successfull set-up, and a few hours, the bucket will look like something this:
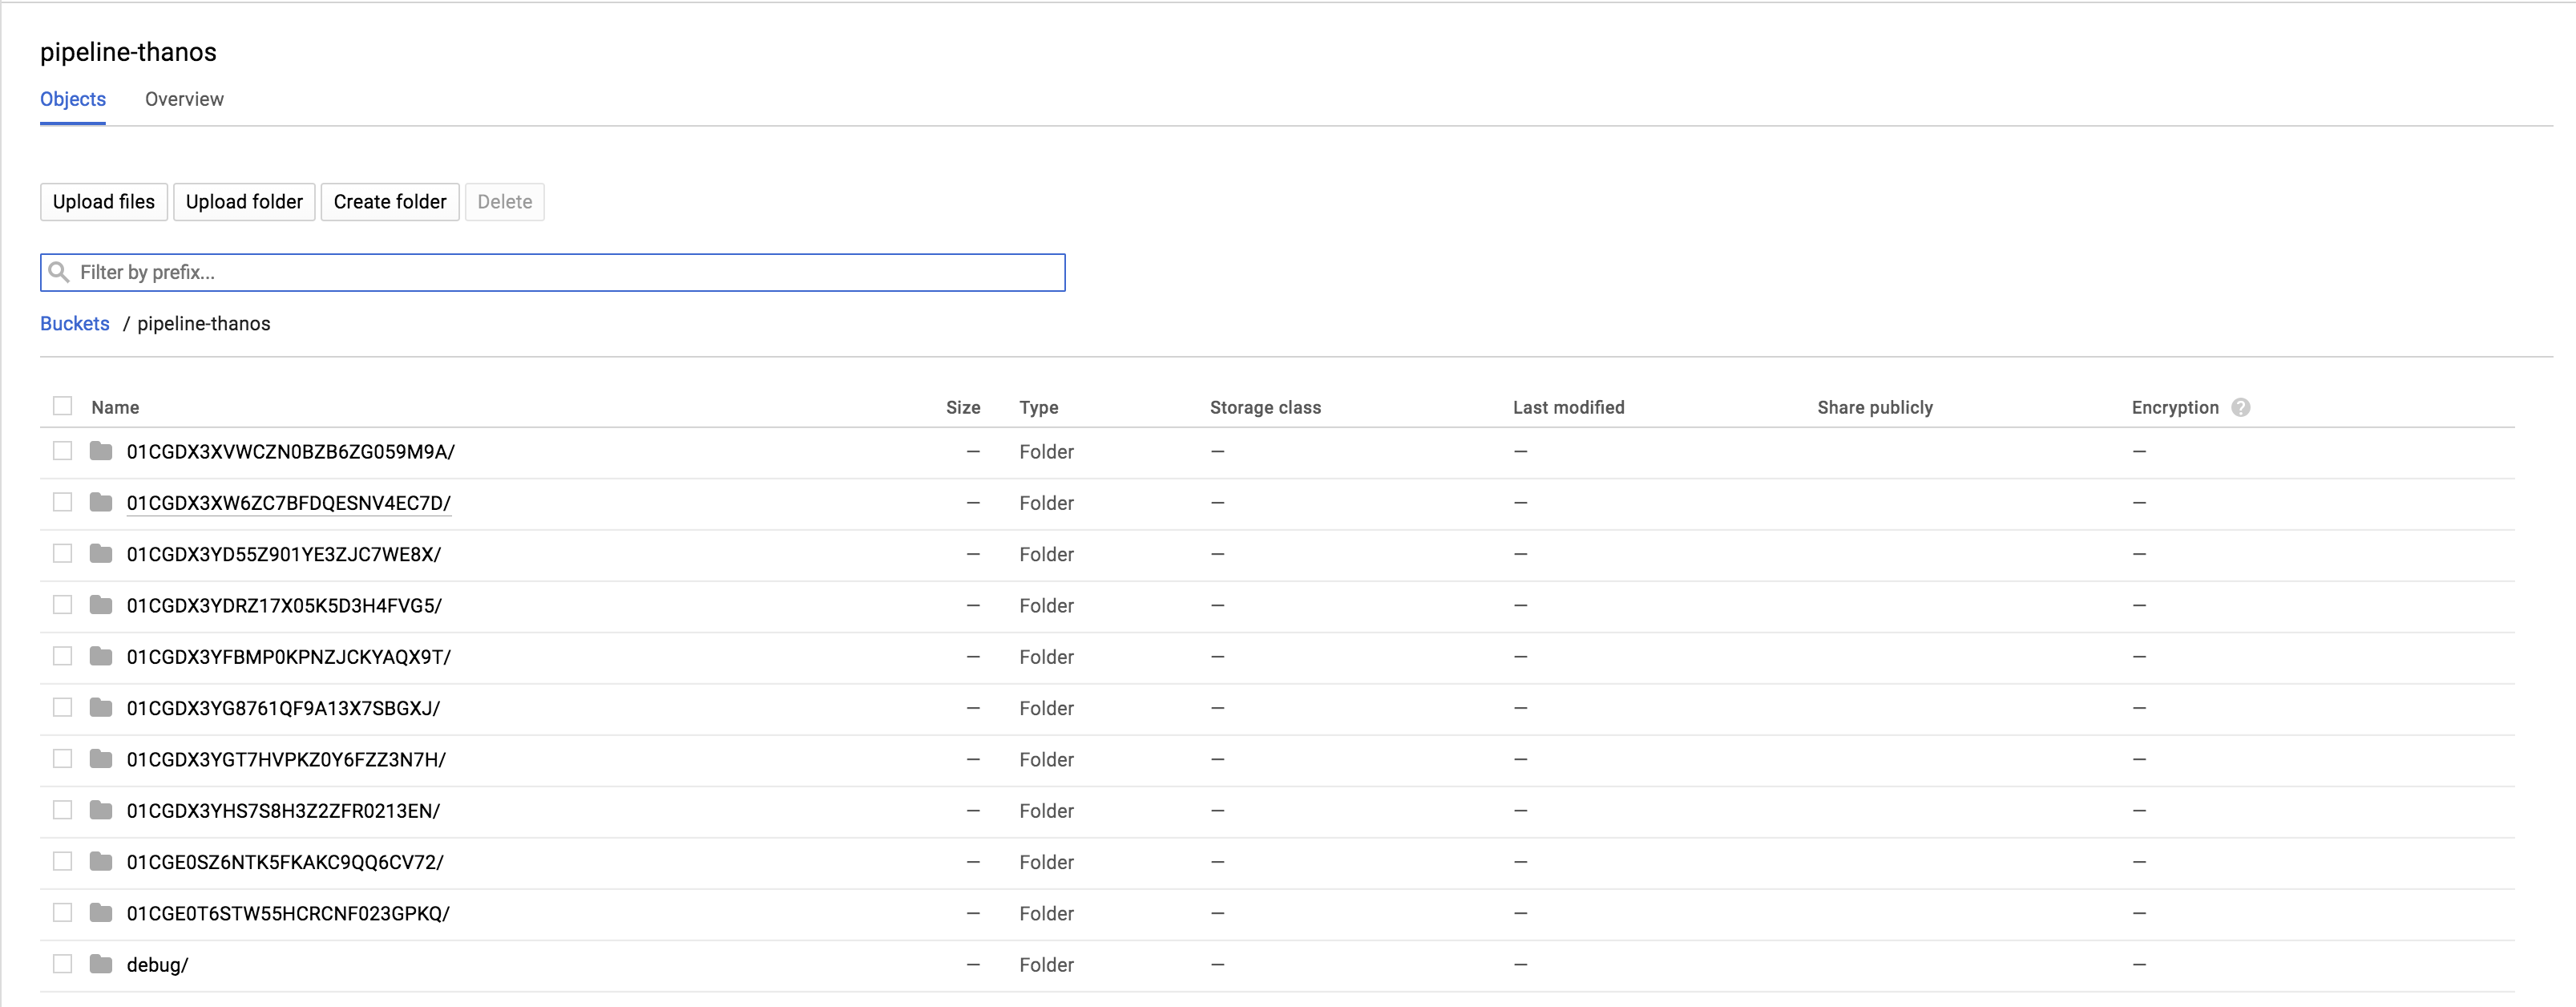
Now to use the Query service as your Grafana Prometheus endpoint.
Differences compared to a simple Prometheus deployment 🔗︎
Working with Thanos is like working with Prometheus, however there are some differences:
-
Prometheus instances must be unique, so, instead of deployment, Thanos uses stateful sets. This helps Thanos distinguish Prometheus instances for deduplication and query routing.
-
Prometheus’ configuration should be managed through Thanos. Thanos will handle reloading etc.
-
Grafana should be configured to query the
Queryservice that handles multiple Prometheus instances and time ranges.
Comming soon 🔗︎
Hopefully you should be well on your way to a basic understanding of Thanos. We will be sharing our experiences with Thanos, particular in regards to performance and stability, so stay tuned.


