


At Banzai Cloud we run and deploy containerized applications to our PaaS, Pipeline. Java or JVM-based workloads, are among the notable workloads deployed to Pipeline, so getting them right is pretty important for us and our users.
Java/JVM based workloads on Kubernetes with Pipeline Why my Java application is OOMKilled Deploying Java Enterprise Edition applications to Kubernetes A complete guide to Kubernetes Operator SDK Spark, Zeppelin, Kafka on Kubernetes
It’s important for us to size the containers correctly in our spotguides, in order to avoid underutilization of resources and also to provide the resources necessary for an application’s smooth performance. Underutilization is to be avoided, as it has a negative impact on costs. No one wants to pay for the time CPUs spend idle or for memory that’s never used. At the same time, we need to provide enough resources for an application, and to set the appropriate limits on resources, to achieve the desired quality of service. E.g. if the application tries to use an amount of memory that exceeds the limits of the container, it will be killed; low CPU limits downgrade performance.
In this blog we’ll discuss how to correctly size containers with regards to memory and CPU from the perspective of Java 10 applications on Kubernetes, and how we tackle these issues with Pipeline. Why Java 10? Well, there was a well-known issue with JVMs running inside a container, wherein the JVM saw the available memory of the machine instead of the memory available in the container. More details on this problem can be found in this blogpost. An experimental feature was added to Java 9 to better recognize container CPU and memory limits. Since this was an experimental feature in Java 9, it had to be explicitly enabled. Java 10 container limits are automatically recognized and enforced, so that’s one less thing to worry about.
Enough theory, let’s see this in action. We’re going to run a simple application on Java 10 and observe memory usage and the CPUs the application sees. This sample application
- loads classes into
Metaspaceto mimic what a ClassLoader would do, and produces native memory usage - creates objects to produce heap usage
The test application 🔗︎
We use javaassist library to generate new classes on the fly from a base class, DynClassBase, and to instantiate the generated classes using reflection:
/**
 * This class is used as the base from which we generate new classes.
 */
public class DynClassBase implements MemoryConsumer{
    private byte []data = null; // data stored on heap

    public void consumeSomeMemory(int amountInBytes) {
        data = new byte[amountInBytes];
    }
}
ClassPool pool = ClassPool.getDefault();
pool.insertClassPath(new ClassClassPath(DynamicClassGen.class));
try {
for (int i = 0; i < genClassCount; i++) {
// generate a new class from DynClassBase
String className = DynClassBase.class.getCanonicalName();
CtClass cc = pool.get(className);
cc.setName(className + i);
Class genClass = cc.toClass();
Class<?> []ctorPrms = null;
Constructor ctor = genClass.getConstructor(ctorPrms);
MemoryConsumer memConsumer = (MemoryConsumer)ctor.newInstance(null);
memoryConsumers.add(memConsumer);
System.out.println("Instantiated class " + memConsumer.getClass().getSimpleName());
}
} catch (Exception e) {
e.printStackTrace();
}The number of classes to be generated has to be specified through the DYN_CLASS_COUNT environment variable. The application instantiates each generated class and invokes the consumeSomeMemory method to allocate memory in the heap. Each call will allocate the amount of memory specified in the MEM_USAGE_PER_OBJECT_MB.
Dockerfile 🔗︎
We build and burn the application to a Docker image using:
FROM maven:3.5-jdk-10-slim as builder
ADD . /dynamic-class-gen
WORKDIR /dynamic-class-gen
RUN mvn package

FROM openjdk:10-slim
WORKDIR /opt/dynamic-class-gen/lib
COPY --from=builder /dynamic-class-gen/target/dynamicclassgen-1.0.jar .
COPY --from=builder /dynamic-class-gen/target/dependency/javassist-3.22.0-GA.jar .

CMD $JAVA_HOME/bin/java $JVM_OPTS -cp javassist-3.22.0-GA.jar:dynamicclassgen-1.0.jar com.banzaicloud.dynclassgen.DynamicClassGen
cd dynamic-class-gen
docker build -t banzaicloud/dynclassgen:1.0 .Kubernetes Pod 🔗︎
We are going to run this application on Kubernetes using the following Pod specification:
apiVersion: v1
kind: Pod
metadata:
  name: dyn-class-gen
spec:
  containers:
  - name: dyn-class-gen-container
    image: banzaicloud/dynclassgen:1.0
    env:
    - name: DYN_CLASS_COUNT
      value: "256"
    - name: MEM_USAGE_PER_OBJECT_MB
      value: "1"
    resources:
      requests:
        memory: "64Mi"
        cpu: 1
      limits:
        memory: "1Gi"
        cpu: 2
  restartPolicy: Never
The entire source code is available on GitHub.
Test runs 🔗︎
kubectl create -f pod.ymlThis will create a pod with a container running our application. The container has a limit of maximum 1GB memory. If the memory usage of the application exceeds this limit, the container will be OOMKilled by Kubernetes. The application is configured to generate and instantiate 256 (DYN_CLASS_COUNT) class definitions, and each instantiated object to allocate 1MB (MEM_USAGE_PER_OBJECT_MB) of heap space.
By default the JVM will set maximum heap size to 1/4 of the memory available to the container, which in this case is 1GB/4 = 256MB.
If we verify the Pod, we can see that it’s in an error state:
kubectl get po dyn-class-gen

NAME            READY     STATUS    RESTARTS   AGE
dyn-class-gen   0/1       Error     0          10m
Let’s see what can we find out from the Pod logs:
kubectl logs  dyn-class-gen

...
DynClassBase241 instance consuming 1MB
DynClassBase242 instance consuming 1MB
DynClassBase243 instance consuming 1MB
DynClassBase244 instance consuming 1MB
Exception in thread "main" java.lang.OutOfMemoryError: Java heap space
        at com.banzaicloud.dynclassgen.DynClassBase245.consumeSomeMemory(DynClassBase.java:25)
        at com.banzaicloud.dynclassgen.DynamicClassGen.main(DynamicClassGen.java:72)
What this shows us is that the application stopped due to java.lang.OutOfMemoryError: Java heap space after the 244th iteration of allocating memory on the heap. But why, when the memory limit is 1GB and the max heap space is 256MB?
The answer lies in the Java memory model. Each live java object has some memory overhead; the javaassist library has internal objects stored on the heap; interned strings are stored on the heap and so are stack variables referencing objects, etc.
We need more heap space. Let’s increase it by ~20% to 300MB and re-run the test application:
apiVersion: v1
kind: Pod
metadata:
  name: dyn-class-gen
spec:
  containers:
  - name: dyn-class-gen-container
    image: banzaicloud/dynclassgen:1.0
    env:
    - name: DYN_CLASS_COUNT
      value: "256"
    - name: MEM_USAGE_PER_OBJECT_MB
      value: "1"
    - name: JVM_OPTS
      value: "-Xmx300M"
    resources:
      requests:
        memory: "64Mi"
        cpu: 1
      limits:
        memory: "1Gi"
        cpu: 2
  restartPolicy: Never
kubectl create -f pod.ymlWe see that increasing the max heap size of the application helped with the OutOfMemoryError. There might be spikes in heap memory usage during the lifespan of our application for various reasons. The max heap size has to anticipate those needs as well. We recommend monitoring the application’s memory usage and adjusting max heap size as necessary.
Are we done with setting limits? Not yet. We also need to take into consideration native memory usage.
We have to set
limits:
memory: "1Gi"native memory, but, at the same time, low enough to quickly catch leaks that explode JVM native memory.
Monitoring 🔗︎
There is a tool called heapster that can be used for high level monitoring of the cluster. Let’s have a look at what the memory usage dashboard shows us about our test application.
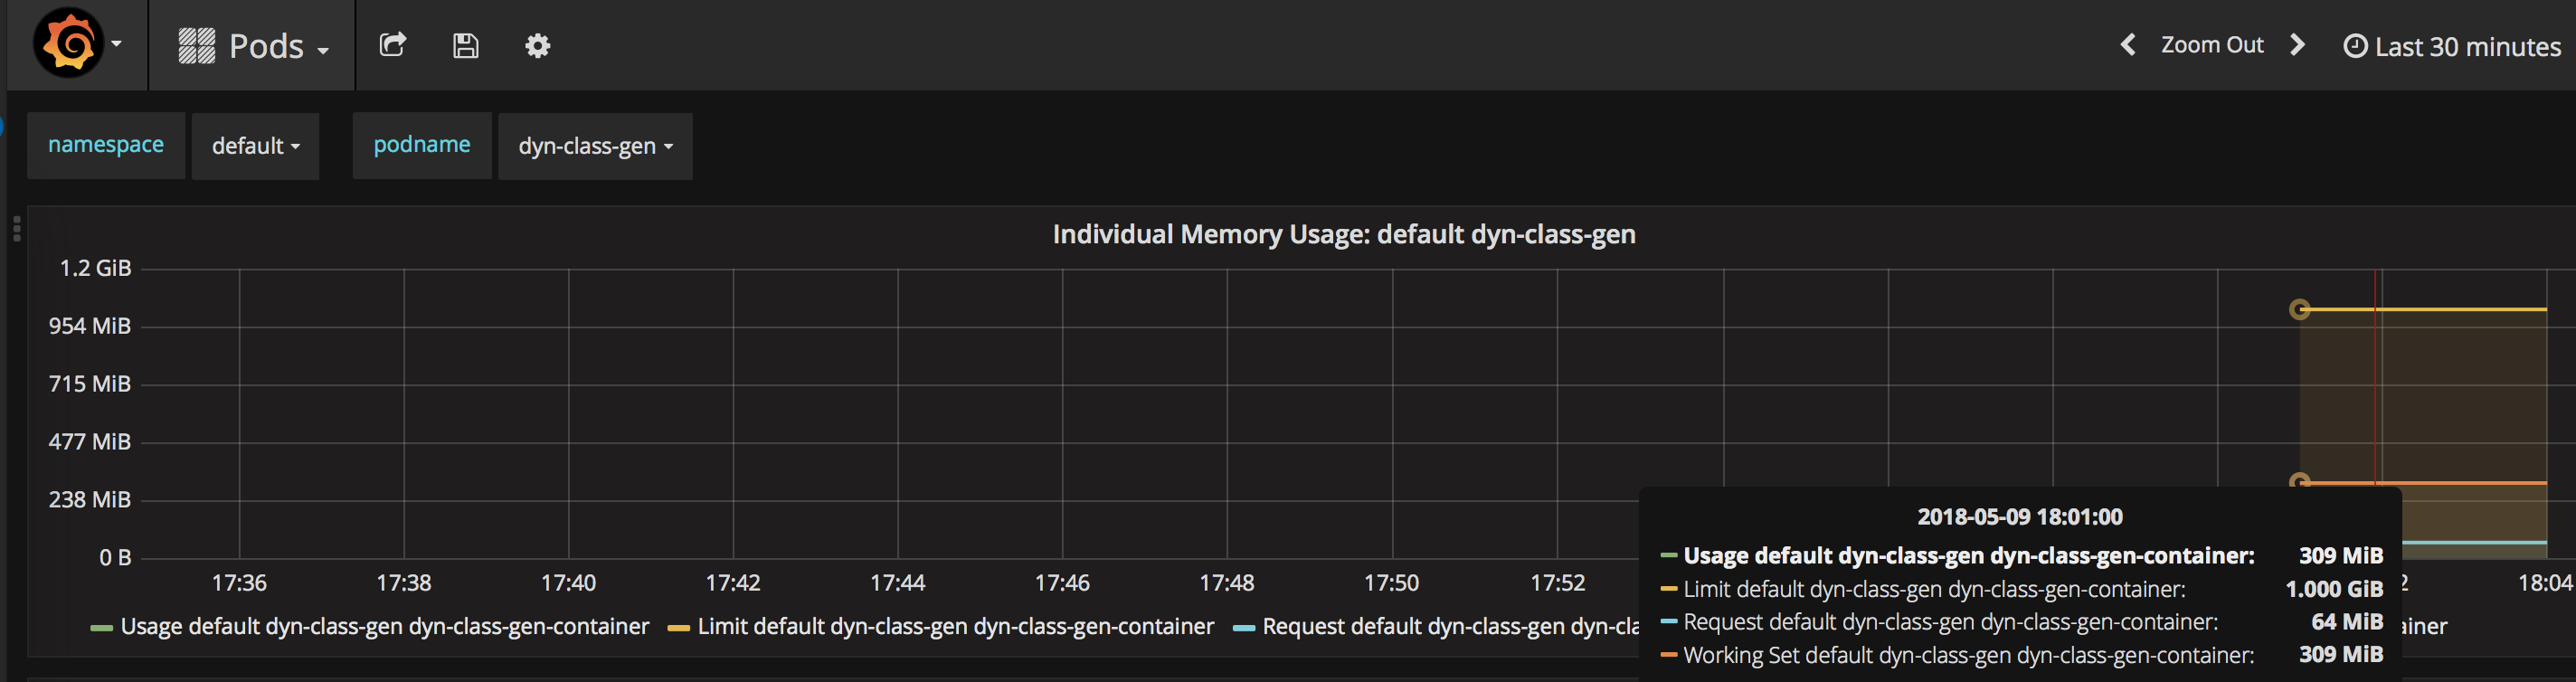 We can see that our test application uses 309MB of memory. This includes the 300MB allocated for heap space, but the rest is native memory. Based on this simple observation it makes sense for us to decrease the container memory limit from 1GB to 309MB + 20% = ~370MB
limits:
  memory: "370Mi"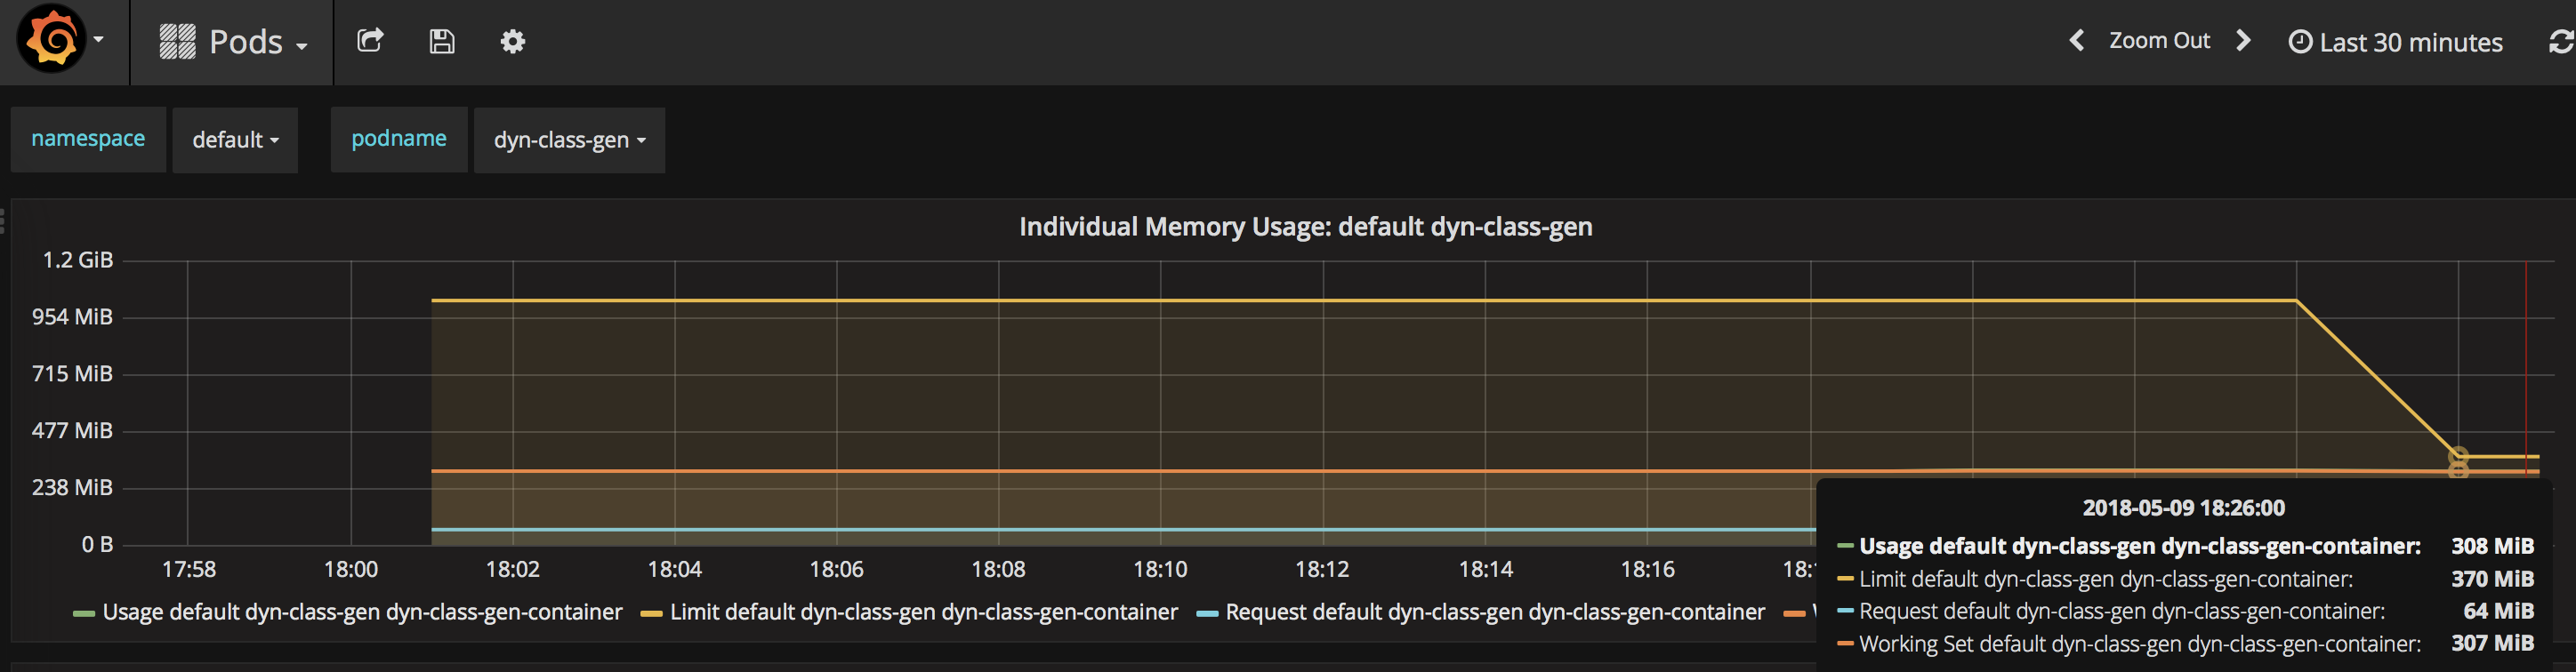
When operating enterprise applications, it’s imperative to monitor their resource usage at a granular level using application specific metrics. Check out our monitoring series to learn how we at Banzai Cloud implement application monitoring for applications deployed to Kubernetes.
Vertical Pod Autoscaler 🔗︎
Now that Java 10 automatically recognizes and enforces container limits, it’s been interesting to see how this process unfolds and interacts with Kubernetes vertical pod autoscaler. We are experimenting with this and will share our experiences and thoughts in a separate blog, so stay tuned.


