


In our last post about using Cadence workflows to spin up Kubernetes we outlined the basic concept of Cadence and walked you through how to use the Cadence workflow engine. Let’s dive into the experiences and best practices associated with implementing complex workflows in Go. We will use the deployment of our PKE Kubernetes distribution, from Pipeline to AWS EC2 as an example.
Of course, you can deploy PKE independently, but Pipeline takes care of your cluster’s entire life-cycle , starting from nodepool and instance type recommendations, through infrastructure deployment, certificate management, opt-in deployment and configuration of our powerful monitoring, logging, service mesh, security scan, and backup/restore solutions, to the scaling or termination of your cluster.
PKE deployment flow 🔗︎
Our first and most anticipated cloud infrastructure integration was for Amazon Web Services. To deploy a PKE cluster based on EC2 instances, we worked out the following high level sequence.
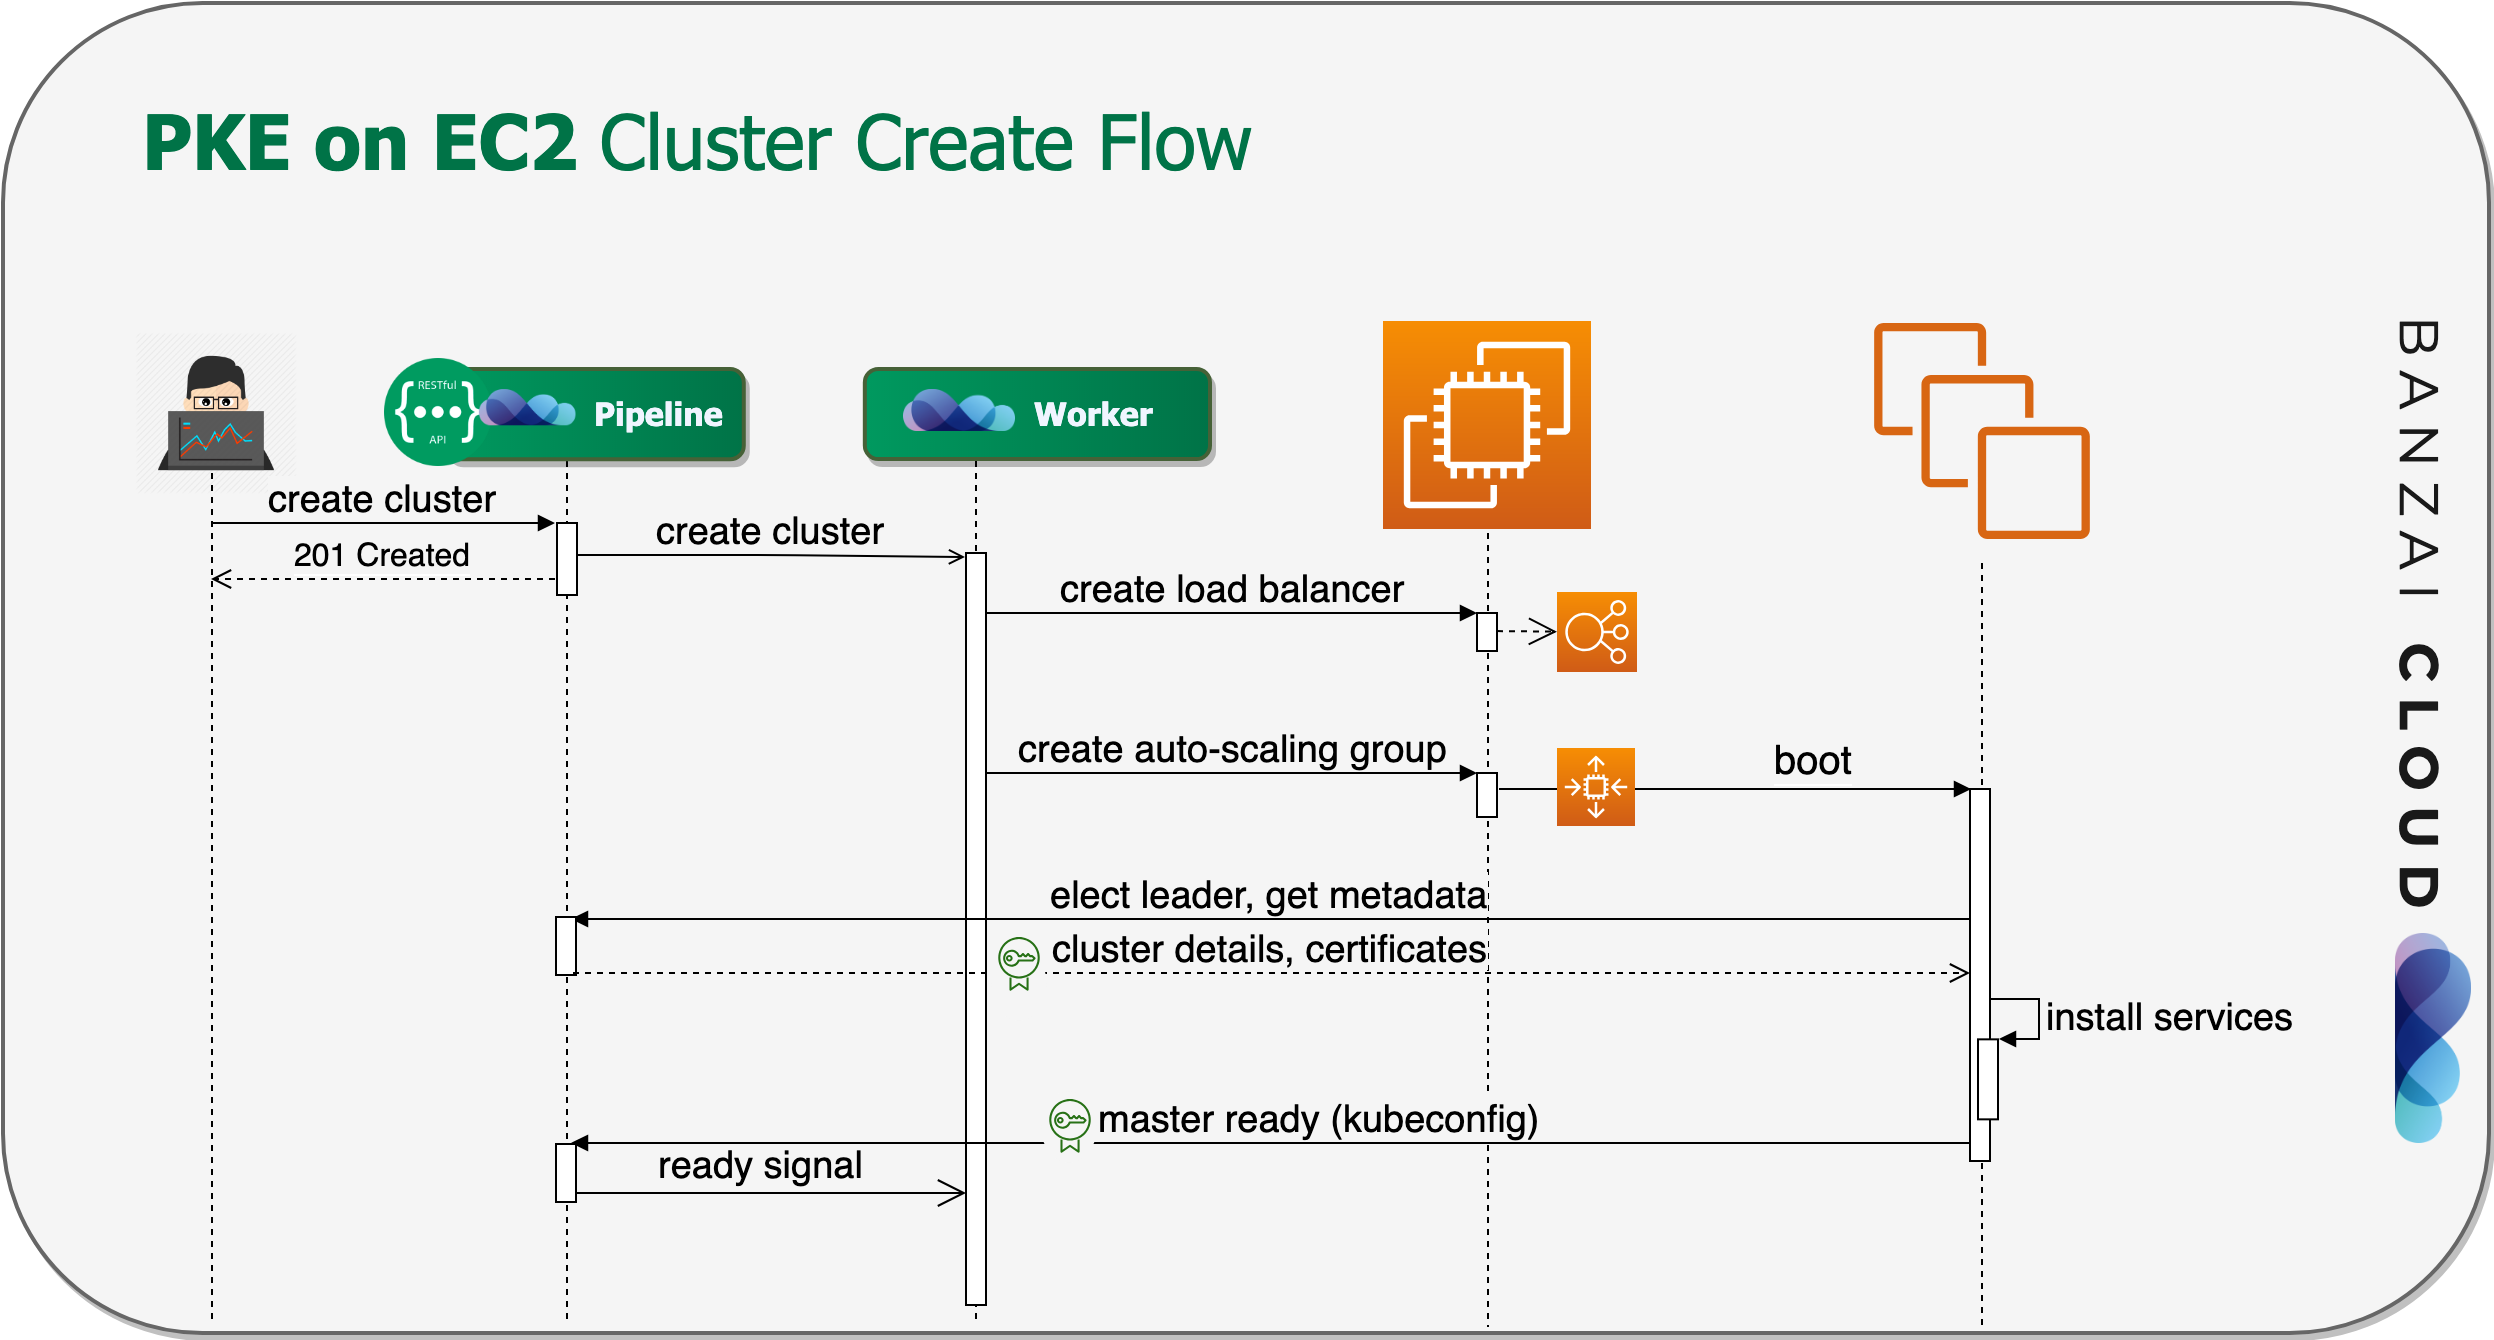
- First, we create a Network Load Balancer, or, in case of a single-master layout, an Elastic IP to provide the API server with a single, cost effective endpoint.
- Then we launch an Auto-scaling Group for the master node(s).
- The nodes recieve a user data script that contains the cluster’s basic information—the Pipeline instance endpoint they belong to, and a JWT token that lets them make authenticated API calls to Pipeline.
- After that, the master nodes boot up, and the PKE installation begins.
- The first instance that comes up automatically claims leader privileges.
- Each master node fetches metadata, and, more importantly, the certificates generated by Pipeline with bank-vaults.
- After that, the PKE components are installed and configured.
- When the lead Kubernetes Master is ready, it sends a node ready signal to Pipeline. The other Masters wait for this event to join the cluster.
- All other worker nodepools launch in a manner similar to Auto-Scaling Groups.
- Worker and follower master nodes boot up, and request ephemeral Kubernetes bootstrap tokens from Pipeline, then join the cluster.
Transition to Cadence 🔗︎
Because our customer base has expanded so rapidly, we’ve had to transition from our previous, relatively monolithic architecture to a more distributed approach. To help make the decision of whether to use Cadence for all of Pipeline’s workflows, we designed a proof of concept with PKE on AWS’s cluster creation flow at its core. This expedited our first steps toward understanding and adopting Cadence, while allowing us to gradually shift the whole process, and other operations, in this direction. We have already implemented the infrastructure mangement steps for PKE and the provider-independent parts of our cluster deployment flow via Cadence, and have plans for the near future to do it with all the cluster operations and a few repetitive background jobs as well. In the portion of this blog which follows, we’ll introduce some of the techniques and experiments we used during that development.
Signals 🔗︎
Signals are used to send data or notifications to a running workflow, when the data becomes available, or an event affecting the workflow occurs.
Do not confuse them with having the properties typical of OS signals; you won’t have to register asynchronous signal handlers, but you will get a channel from which you can read or Select.
We use this quality when our workflow launches master nodes, but has to wait until the first has initialized. It then sends the administrative kubeconfig for the next steps. This kubeconfig is stored in Pipeline’s secret storage, and is used later to, for example, create Kubernetes join tokens.
The implementation is as simple as waiting for the signal in the workflow:
signalChan := workflow.GetSignalChannel(ctx, signalName)
signalChan.Receive(ctx, nil)
workflow.GetLogger(ctx).Info("Received signal!", zap.String("signal", signalName))
And sending the signal when the master’s ready request arrives:
err := workflowClient.SignalWorkflow(ctx, workflowID, "", "master-ready", nil)Cadence also has the concept of pending results
or incomplete activities.
This concept is a bit less flexible, but can be used for similar signaling purposes.
If an activity returns an ErrResultPending error, its result won’t be ready until an approval arrives from a Cadence client in the form of a CompleteActivity call.
Logging 🔗︎
Cadence has a built-in history of the workflows and activities it’s executed, but the end result of those activities might not provide us with enough information to understand failures or reconstruct the context around an incident. This makes it essential that we use standard logging facilities to keep a reasonably detailed record of events.
Logging frameworks 🔗︎
Cadence uses Uber Engineering’s structured logging framework, called Zap.
Our code base, however, uses logrus, a logger implementation we did not want to replace.
We use Mark’s excellent logur package to adapt existing logger objects for use with Cadence.
It’s essentially a single function call that channels all Cadence logs into our usual logger framework.
import (
	"github.com/goph/logur"
	"github.com/goph/logur/integrations/zaplog"
)

// …
    zapLogger := zaplog.New(logur.WithFields(
        logger, map[string]interface{}{"component": "cadence-worker"}))
    worker, err := cadence.NewWorker(cadenceConfig, taskList, zapLogger)
Activity logs 🔗︎
Cadence gives us some easy-to-utilize structured logs that have to do with job execution, but you’ll probably also need to log events in your own activity code. You can accomplish this easily, by extracting the logger from its activity context. Logs are automatically annotated by Cadence with Workflow metadata.
The Zap logger has two manifestations: a plain manifestation and a sugared one. Using the latter may cause some performance degradation (which does not occur with our adapted logrus logger), but makes it possible, for example, to add extra fields. You can use the logger from the context of the activity with all its features:
func ExampleActivity(ctx context.Context, input ExampleActivityInput) {
	logger := activity.GetLogger(ctx).Sugar().With("clusterID", input.ClusterID)
        logger.Info("Hello Zap!")
}
In our setup, this eventually results in a log message like this:
level=info msg="Hello Zap!" Domain=pipeline TaskList=pipeline WorkerID=1@cp-pipeline-worker-6cf9c5875d-qtg4n@pipeline clusterID=1191 component=cadence-worker workflowID=410e7aab-da8c-48da-8d70-bff530b70747 workflowRunID=e87e6dc8-f58c-4e16-8fd3-c0b6285fa9af
Or, you can use workflow.GetLogger(ctx) as an analog in the workflow code.
Repetitive workflows 🔗︎
Cadence can also be used for running repetitive background tasks, like cleanup. It also has warranties that make it useful for more business-critical applications, like the daily accounting of certain metrics.
In addition to those warranties, Cadence has a mechanism which excludes concurrent executions of the same workflow run. This takes scheduled executions a step further, and makes them much more scalable than using background routines with a timer.
You can simply submit a workflow with
- a static run
ID, which ensures that multiple submissions won’t cause more frequent or concurrent executions of the same job, and - a crontab-like description: as in every 5 minutes:
*/5 * * * *.
workflowClient.StartWorkflow(ctx, client.StartWorkflowOptions{
    ID:           "my_cron_job",
    CronSchedule: "*/5 * * * *",
})
Troubleshooting 🔗︎
The Cadence team has authored several tools to help you troubleshoot your workflows.
cadence-web 🔗︎
Cadence-web is a good place to start, because it visualizes the state and history of your Cadence workflow. You can track different domains and tasks, and investigate executed workflows and their activities, one by one. The UI provides easy access to recorded inputs, outputs and errors. A timeline allows you to check how activities were executed relative to each other. If you need to dig into the logs, you can fetch workflow and run IDs from this interface.
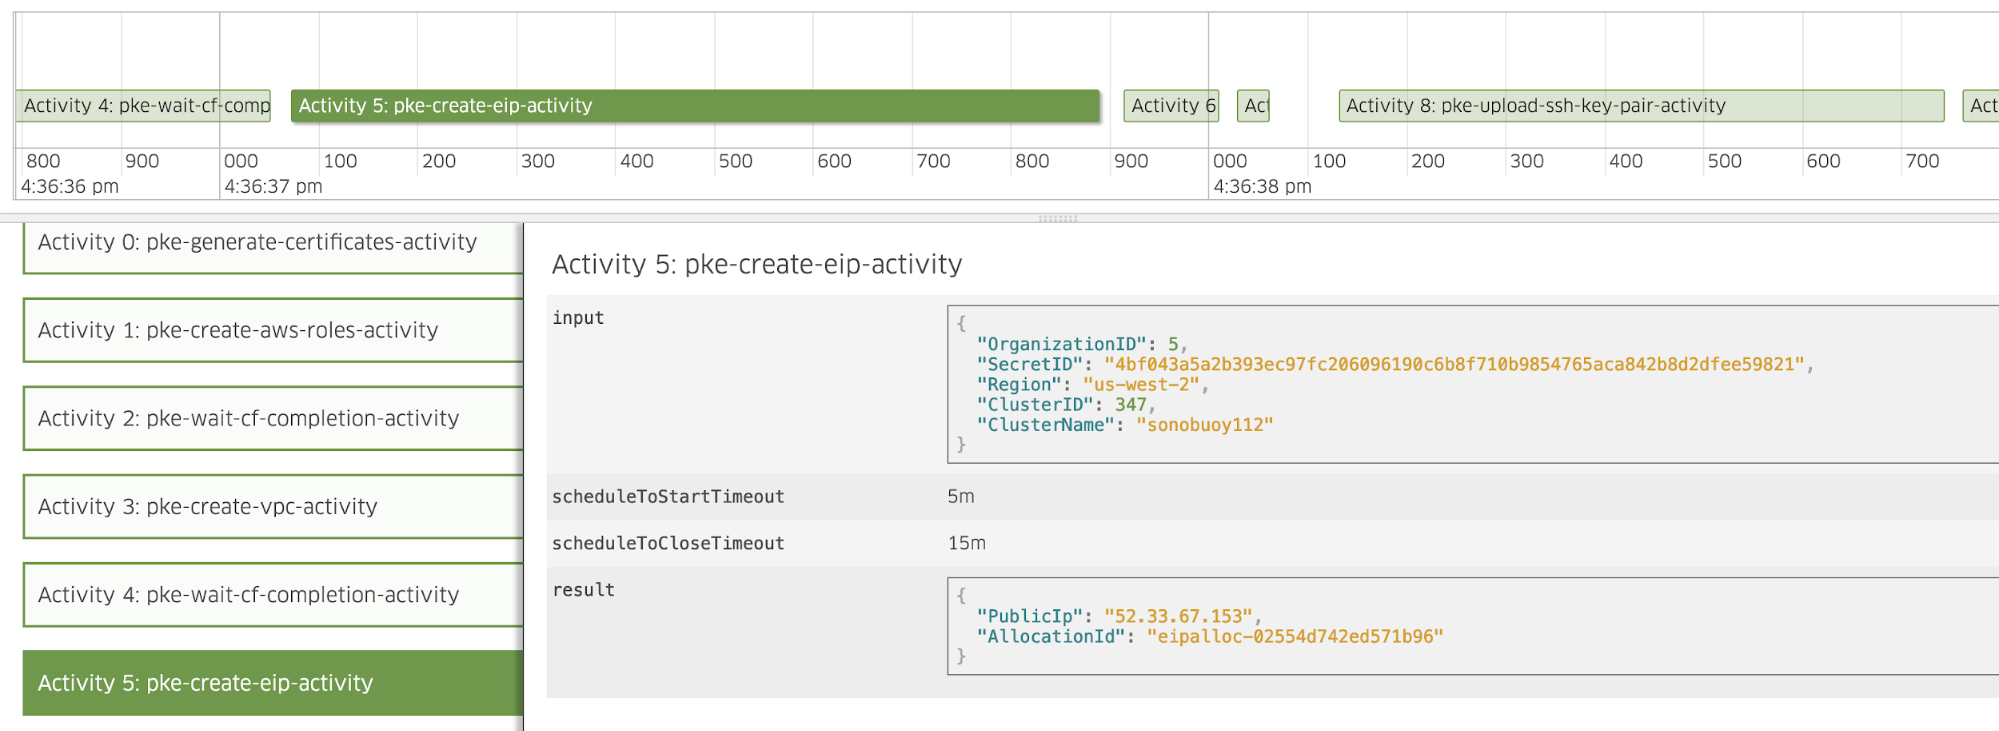
Workflow name serves as a workflow definition’s unique identifier. The actual execution has a workflow id that identifies a specific workflow submission, and, for example, its input parameters. A workflow ID can be used to retrieve an actual run, which has another unique identifier, the run ID. A workflow run identified by its run ID has status, result, etc. There is typically one run per workflow submission, but failures or repetitive workflows trigger further runs.
Cadence CLI 🔗︎
Rerun a workflow 🔗︎
You can rerun your (possibly failed) workflow with the command line tool packaged together with Cadence, which is super-useful during development.
This feature works only with API v2.
./cadence workflow reset -w <workflow-id> -r <run-id> --event_id <decision_finish_event_id> --reason "some_reason"
You can get all the IDs you need for the command from the UI (or from the CLI). If you want to restart the entire workflow, use the first event’s event ID, which is called a decision task.
Signal, Cancel, Terminate 🔗︎
You can also use the CLI to send a signal manually, if you want to, for example, mock an event during development.
./cadence workflow signal -w <wid> -r <rid> -n <signal-name> -i '"signal-value"'
You can also cancel or terminate a workflow.
./cadence workflow cancel -w <wid> -r <rid>

./cadence workflow terminate -w <wid> -r <rid> --reason
Conclusions 🔗︎
In this post we shared some of our experiences while using Cadence for cloud resource management tasks, and gave you some examples of concrete use cases for Cadence and its features. We’re happy to hear your thoughts and feedback, and any ideas about topics you think we should have touched on or might touch on in the future.
About Banzai Cloud Pipeline 🔗︎
Banzai Cloud’s Pipeline provides a platform for enterprises to develop, deploy, and scale container-based applications. It leverages best-of-breed cloud components, such as Kubernetes, to create a highly productive, yet flexible environment for developers and operations teams alike. Strong security measures — multiple authentication backends, fine-grained authorization, dynamic secret management, automated secure communications between components using TLS, vulnerability scans, static code analysis, CI/CD, and so on — are default features of the Pipeline platform.


