Finding a root cause can be hard. You need to collect data from several (usually disparate) sources. Often, when we debug a cluster, we need the output of its logging Flows to validate the consistency of its Logging stack. The idea in such cases is to peek into the messages transported by fluentd. Let’s take a look at how we might accomplish that.
If you’re not familiar with the Logging Operator, please check out our earlier posts.
The trivial solution 🔗︎
In simple cases, we can use an stdout filter. This solution works well for low traffic flows. Here’s an example of how it’s done:
apiVersion: logging.banzaicloud.io/v1beta1
kind: Flow
metadata:
 name: debug-flow
spec:
 filters:
   - parser:
       remove_key_name_field: true
       reserve_data: true
       parse:
         type: json
   - stdout:
       output_type: json
 selectors: {}
 localOutputRefs:
   - null-output
After the configuration goes live, we can tail the fluentd logs.
$ kubectl exec -it logging-demo-fluentd-0 cat /fluentd/log/out

2020-09-09 09:37:45 +0000 [info]: #0 starting fluentd worker pid=15 ppid=6 worker=0
2020-09-09 09:37:45 +0000 [info]: #0 [main_forward] listening port port=24240 bind="0.0.0.0"
2020-09-09 09:37:45 +0000 [info]: #0 fluentd worker is now running worker=0
2020-09-09 09:37:45 +0000 [info]: Hello World!
Pros:
- easy to implement
Cons:
- high traffic flows can flood the stdout
- it may have side effects on the main flow
- you need to handle multiple fluentd instances (can be troublesome)
A more reliable solution 🔗︎
Another way to check a Flow output is to direct the output to a known destination. Our first thought was to use a fluentd instance and save everything to an output file. The architecture is simple. We set up a fluentd pod with a service, then we exec into that pod. Although it sounds easy, there are a few things we have to make sure of.
- Create a fluentd configuration (a configmap)
- Create a fluentd pod (with config reloader or you’ll need to kill the pod to reload it)
- Create a service pointing to the Pod
- Exec into the Pod and tail the file
We decided not to go with this solution. We would have had to create a lot of resources to make it work, and it was still not as convenient as we hoped it would be.
Pros:
- separate debug fluentd from the main logging flow
Cons:
- changes are made through configmap
- container should have other tools like: grep, bash
Transport logs to a local machine 🔗︎
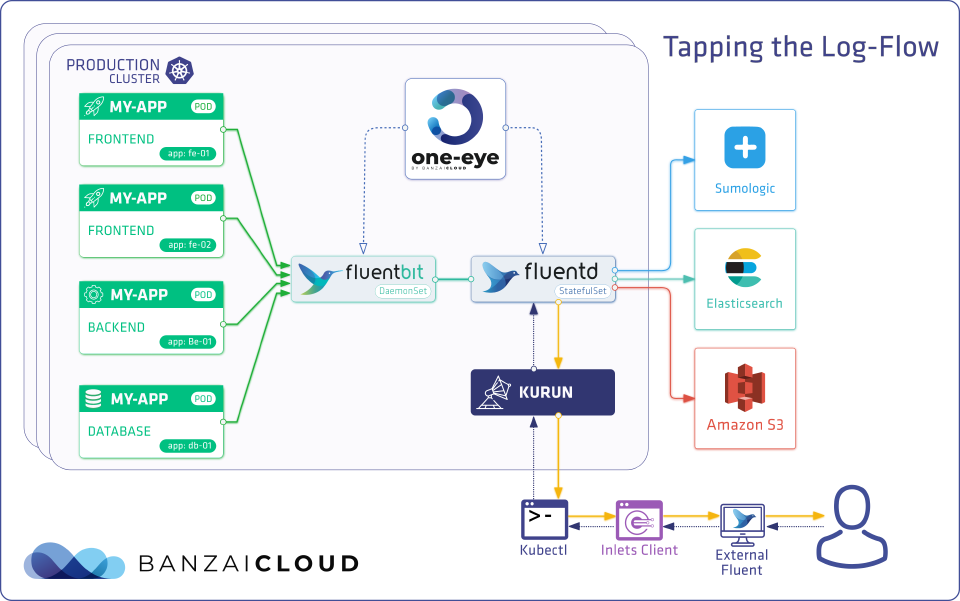
The approach we are most comfortable with is to tail the logs on your local computer. And that’s not actually that hard. You may be familiar with our open source project kurun. It utilizes inlets to create a tunnel between your local machine and the Kubernetes cluster.
The idea is to start a fluentd container on your local computer and connect the Logging Operator with fluentd.
First attempt, using fluentd’s forward-protocol 🔗︎
Fluentd has a built-in protocol to transport logs between fluentd instances. Now put together the stack.
We start with a kurun command to establish a connection between the Kubernetes cluster and the local machine
kurun port-forward --servicename fluentd-debug --serviceport 24222 localhost:24222
We create a fluentd.conf with a forward input configuration that prints out all messages on standard output.
<source>
  @type forward
  port 24222
</source>
<match **>
  @type stdout
</match>
We can start the local fluentd container listening on the port defined earlier in the kurun command.
docker run -p 24222:24222 -v $PWD/fluentd.conf:/fluent/fluent.conf --rm banzaicloud/fluentd:v1.11.2-alpine-2 -c /fluent/fluent.conf
After that, we can create an Output configuration pointing to our kurun service.
apiVersion: logging.banzaicloud.io/v1beta1
kind: Output
metadata:
  name:
spec:
  forward:
    servers:
      - host: fluentd-debug
        port: 24222
    buffer:
      timekey: 10s
      timekey_wait: 3s
      timekey_use_utc: true
The last step is to alter the Flow and add forward-output-debug to localOutputRefs
apiVersion: logging.banzaicloud.io/v1beta1
kind: Flow
metadata:
  name: flow-sample
  namespace: default
spec:
  filters:
    ...
  localOutputRefs:
    - ...
    - forward-output-debug
  match:
    ...
There was only one problem, that kurun only transports HTTP traffic: bummer.
From TCP to HTTP 🔗︎
After we discovered this little design flaw we changed the forward protocol to http.
Setting the local source to http.
<source>
  @type http
  @id http_input
  port 24222
  <parse>
    @type json
  </parse>
</source>
<match **>
  @type stdout
</match>
And changed the Output definition to http.
apiVersion: logging.banzaicloud.io/v1beta1
kind: Output
metadata:
  name: http-output-debug
spec:
  http:
    endpoint: http://kurun:24224
    buffer:
      flush_interval: 10s
      timekey: 5s
      timekey_wait: 1s
      flush_mode: interval
    format:
      type: json
Unfortunately, this doesn’t work, since HTTP input was designed to receive logs from applications sending batches of logs through http. Like in the following example:
curl -X POST -d 'json={"foo":"bar"}' http://localhost:9880/app.log
The built-in fluentd HTTP output sends new line delimited JSON like this:
{"timestamp": "2020-09-09 09:37:45", "log":"Hello World!"}
{"timestamp": "2020-09-09 09:37:45", "log":"Hello World!"}
{"timestamp": "2020-09-09 09:37:45", "log":"Hello World!"}
So we needed to tweak the configuration to send the log batches in a big array. We just need to set the json_array variable to true.
apiVersion: logging.banzaicloud.io/v1beta1
kind: Output
metadata:
  name: http-output-debug
spec:
  http:
    endpoint: http://kurun:24224
    json_array: true
    buffer:
      flush_interval: 10s
      timekey: 5s
      timekey_wait: 1s
      flush_mode: interval
    format:
      type: json
Finally, we have a working set-up. We can use grep or just edit the fluentd configuration locally to add some additional features to our debug flows.
Pros:
- separate debug fluentd from the main logging flow
- all tools are on you computer easier to manage
Cons:
- you need to pull traffic from your cluster
+1 using msgpack 🔗︎
Another interesting fact is that it’s possible to use msgpack format over HTTP.
To do this, you need to set format to msgpack.
<match **>
  @type http
  endpoint http://some.your.http.endpoint:9882/your-awesome-path
  <format>
    @type msgpack
  </format>
  <buffer>
    flush_interval 2s
  </buffer>
</match>
Then, on the receiving side, you need to parse the message as msgpack.
<source>
  @type http
  port 9882
  bind 0.0.0.0
  <parse>
    @type msgpack
  </parse>
  <format>
    @type json
  </format>
</source>
The takeaway here is that, with powerful building blocks, it’s easy to set up more complex systems. You can combine the Logging Operator’s powerful match mechanism with your local terminal grep and coloring extensions. Pretty cool, huh?


