


It’s been a while since we published a new release of One Eye. That doesn’t mean we haven’t been working on it, quite the opposite! We’ve been busy making lots of improvements and adding features. This blog will highlight the many changes made since version 0.3.
Let’s start with some great news! Logging Operator (responsible for the One Eye logging sub-system) is now the official logging backend of Rancher. We love to see open source projects work together to provide an improved experience to end-users. And, as long as we’re on the subject, let’s take a look at some of the improvements made in the Logging Operator.
Improvements in the Logging Operator 🔗︎
Naturally, more users means more issues. As you can probably imagine, they have made tons of feature requests. We gathered the most popular questions and errors and made improvements that make our Logging Operator easier to use.
Flow and Output status 🔗︎
The more complex the configuration the harder it is to debug problems. Beginning with Logging Operator 3.8 all custom resources have a Status and a Problems field. What are they good for? Let’s see. In a healthy system, the output of a clusteroutput resource should look like something like the following.
$ kubectl get clusteroutput -A
   NAMESPACE   NAME      ACTIVE   PROBLEMS
   default     nullout   true
The ACTIVE column indicates that the ClusterOutput has successfully passed the configcheck and presented it in the current fluentd configuration. When no errors are reported the PROBLEMS column is empty.
Take a look at another example, in which we have an incorrect ClusterFlow.
$ kubectl get clusterflow -o wide
NAME ACTIVE PROBLEMS
all-log true
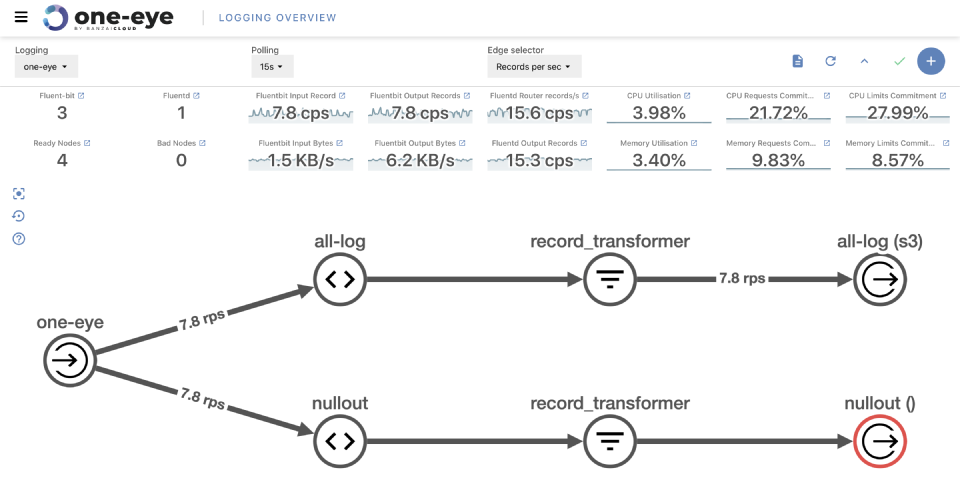
nullout false 1
You can see that the nullout Clusterflow is inactive and there is 1 problem with the configuration.
In order to dig a little deeper we need only to check the status field of the object.
$ kubectl get clusterflow nullout -o=jsonpath='{.status}' | jq
{
  "active": false,
  "problems": [
    "dangling global output reference: nullout2"
  ],
  "problemsCount": 1
}
The problem is trivial; there is no nullout2 ClusterOutput present on the cluster.
New default S3 object key format 🔗︎
In our previous blog Warm Up Logs from Cold Storage we noted how important it is to have a proper S3 object key format. To avoid misconfiguration of that crucial attribute we introduced the oneeye_format parameter. You can read more about Logging operator S3 output in the Logging operator documentation.
Updated fluentbit, fluentd, and plugins 🔗︎
Several bug fixes and improvements have been published since the latest release of the Logging Operator. We updated and tested many of the plugins to provide a seamless experience during logging.
Updated core components
- Fluentbit version from
1.5.4to1.6.4 - Fluentd version from
1.11.2to1.11.5
Updated Fluentd Plugins
- fluent-plugin-cloudwatch-logs from
0.11.0to0.11.1 - fluent-plugin-grafana-loki from
1.2.14to1.2.16 - fluent-plugin-kinesis from
3.2.3to3.3.0 - fluent-plugin-webhdfs from
1.2.5to1.3.1 - fluent-plugin-elasticsearch from
4.1.2to4.2.2 - fluent-plugin-kafka from
0.14.2to0.15.2 - fluent-plugin-logdna from
0.3.1to0.4.0 - fluent-plugin-newrelic from
1.1.8to1.1.10 - fluent-plugin-prometheus from
1.8.3to1.8.4
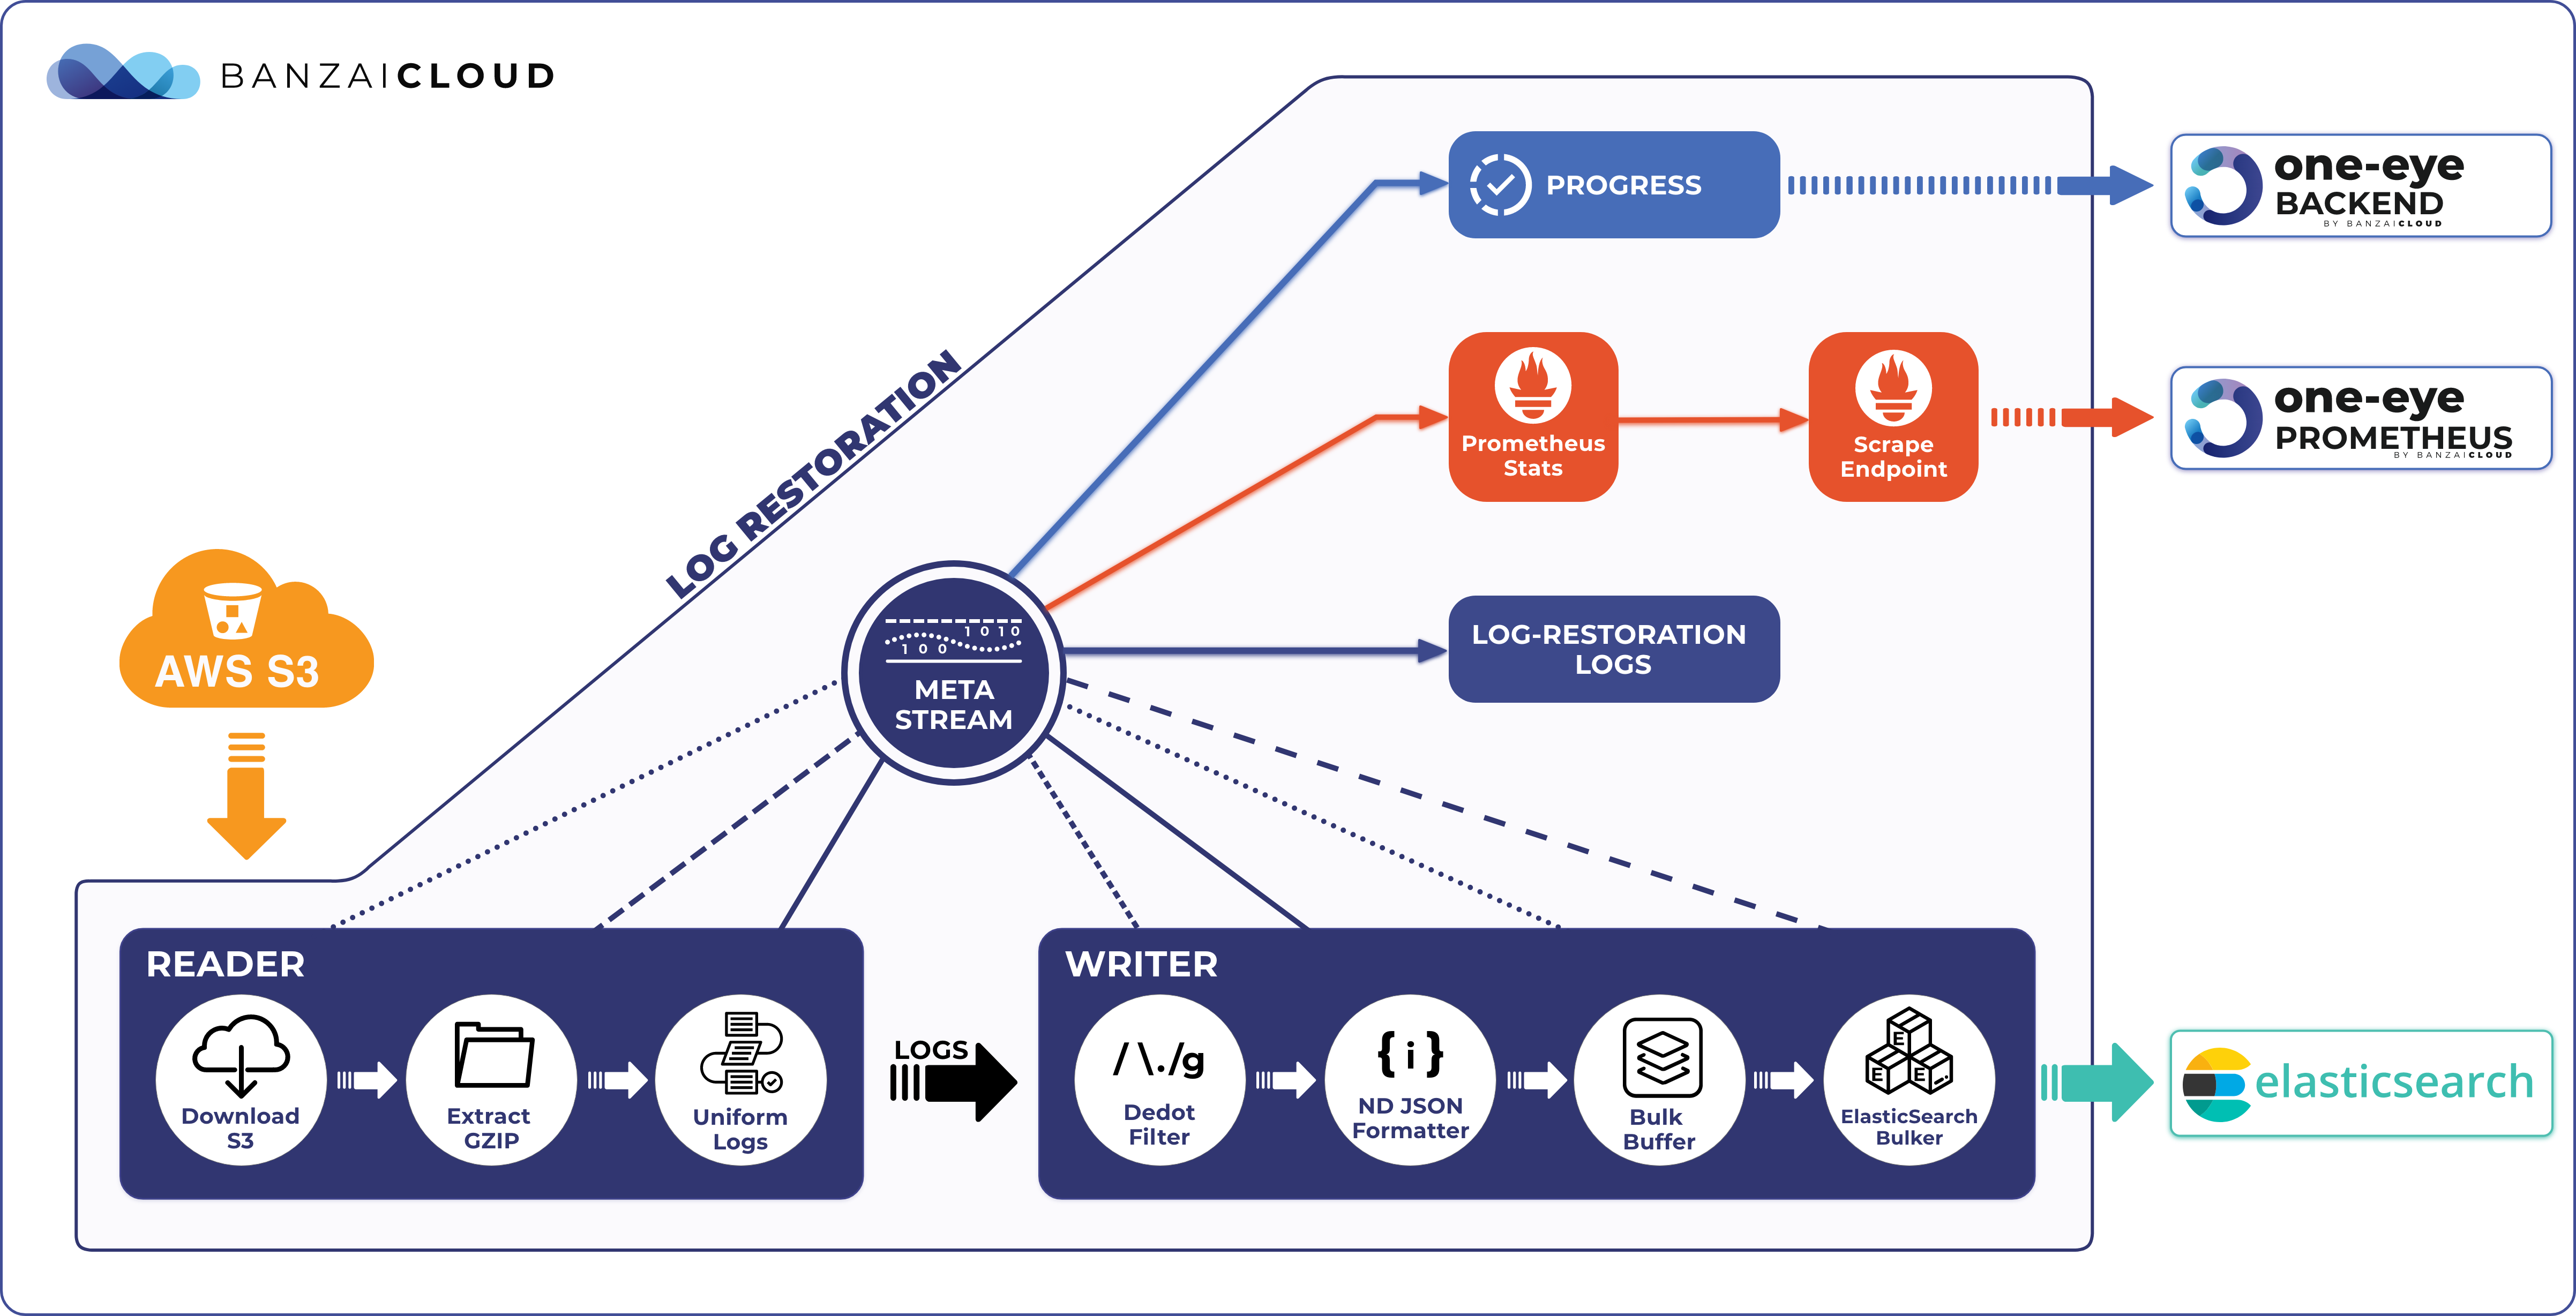
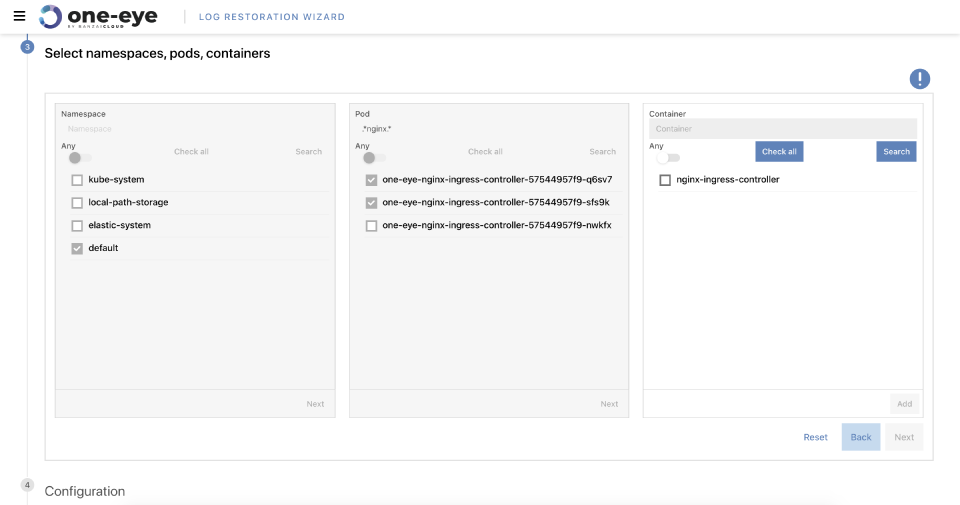
General accessible Log Restoration feature 🔗︎
This new feature automates the loading of archive logs into Elasticsearch. We peeked into this feature in a recent blog post, Warm Up Logs from Cold Storage. Now you can try it out!

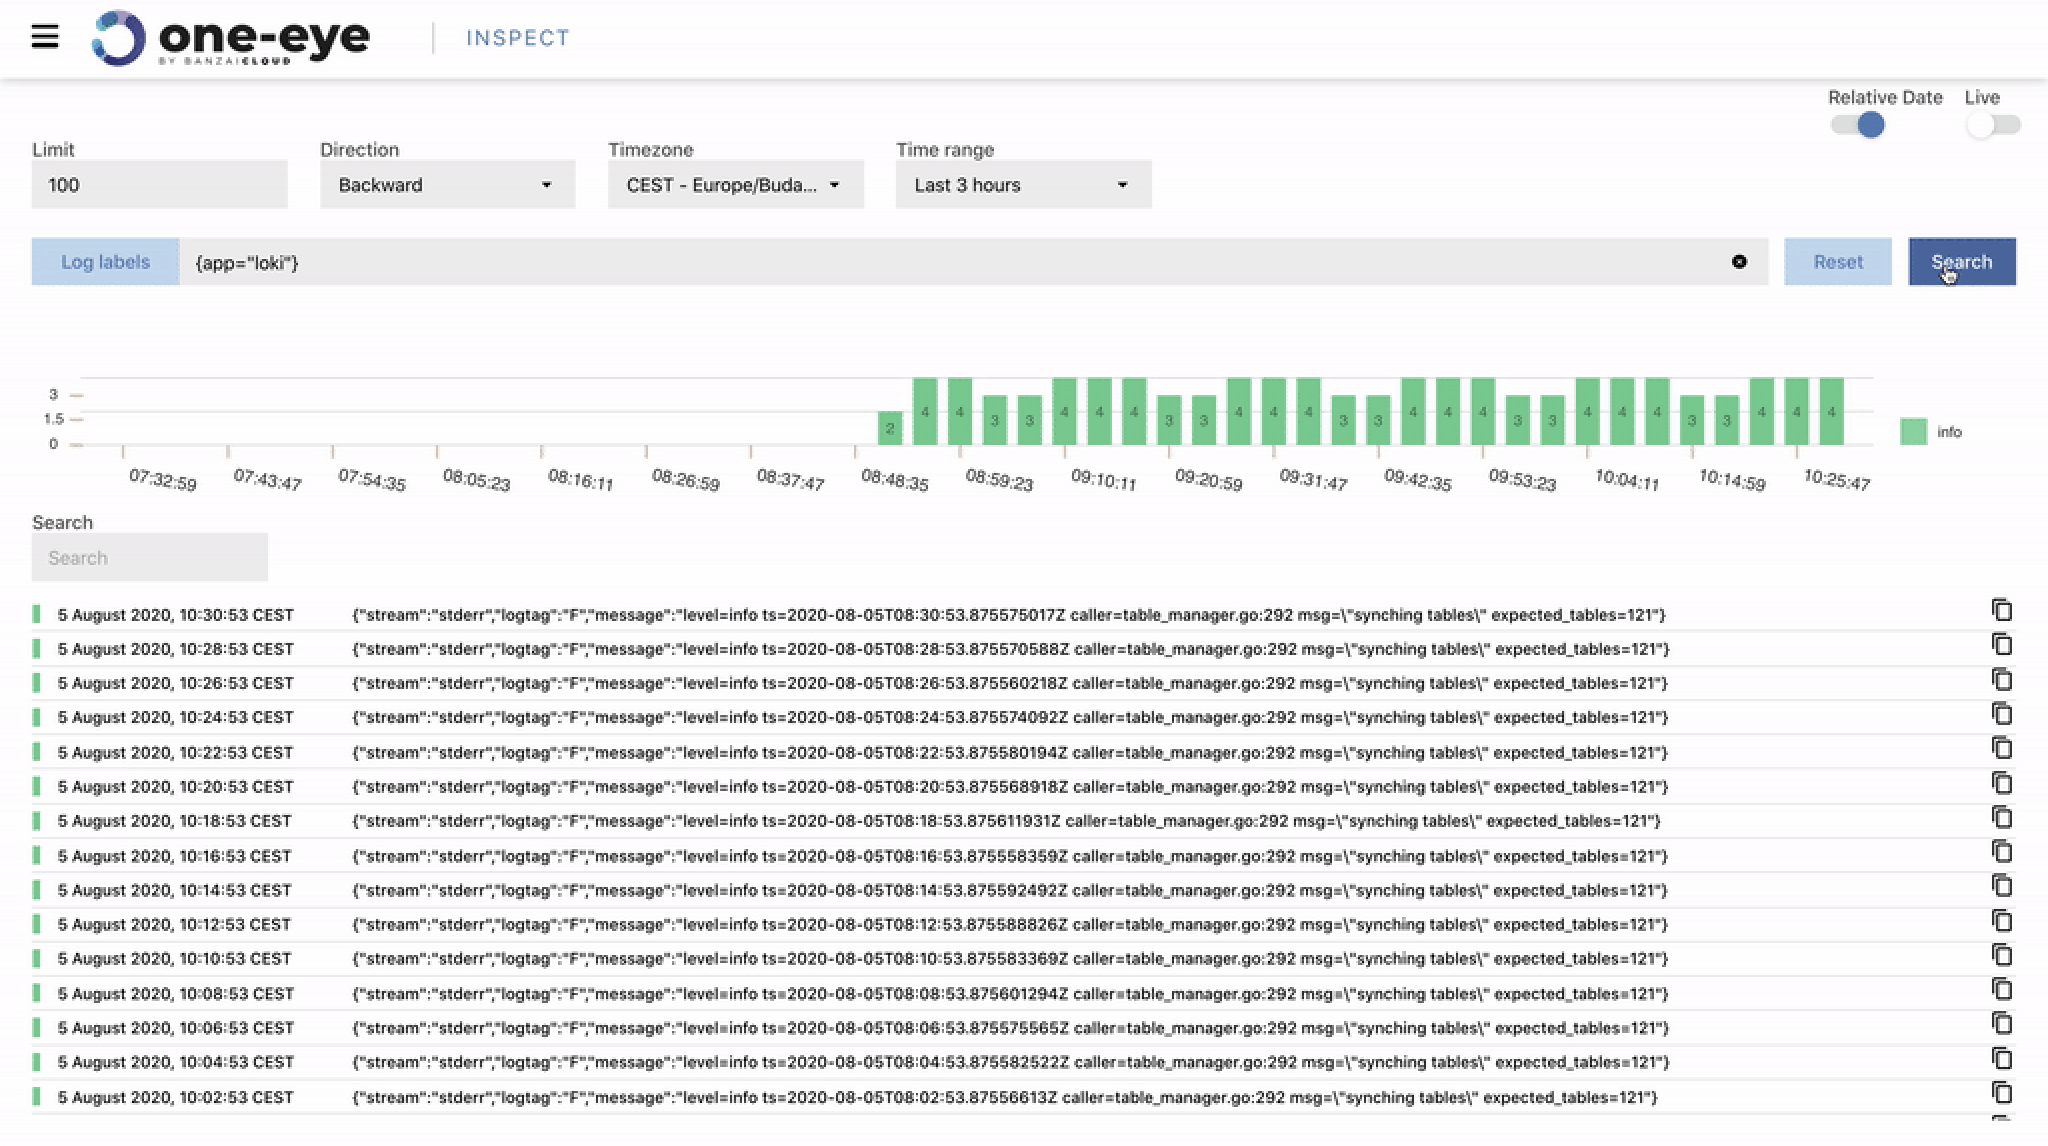
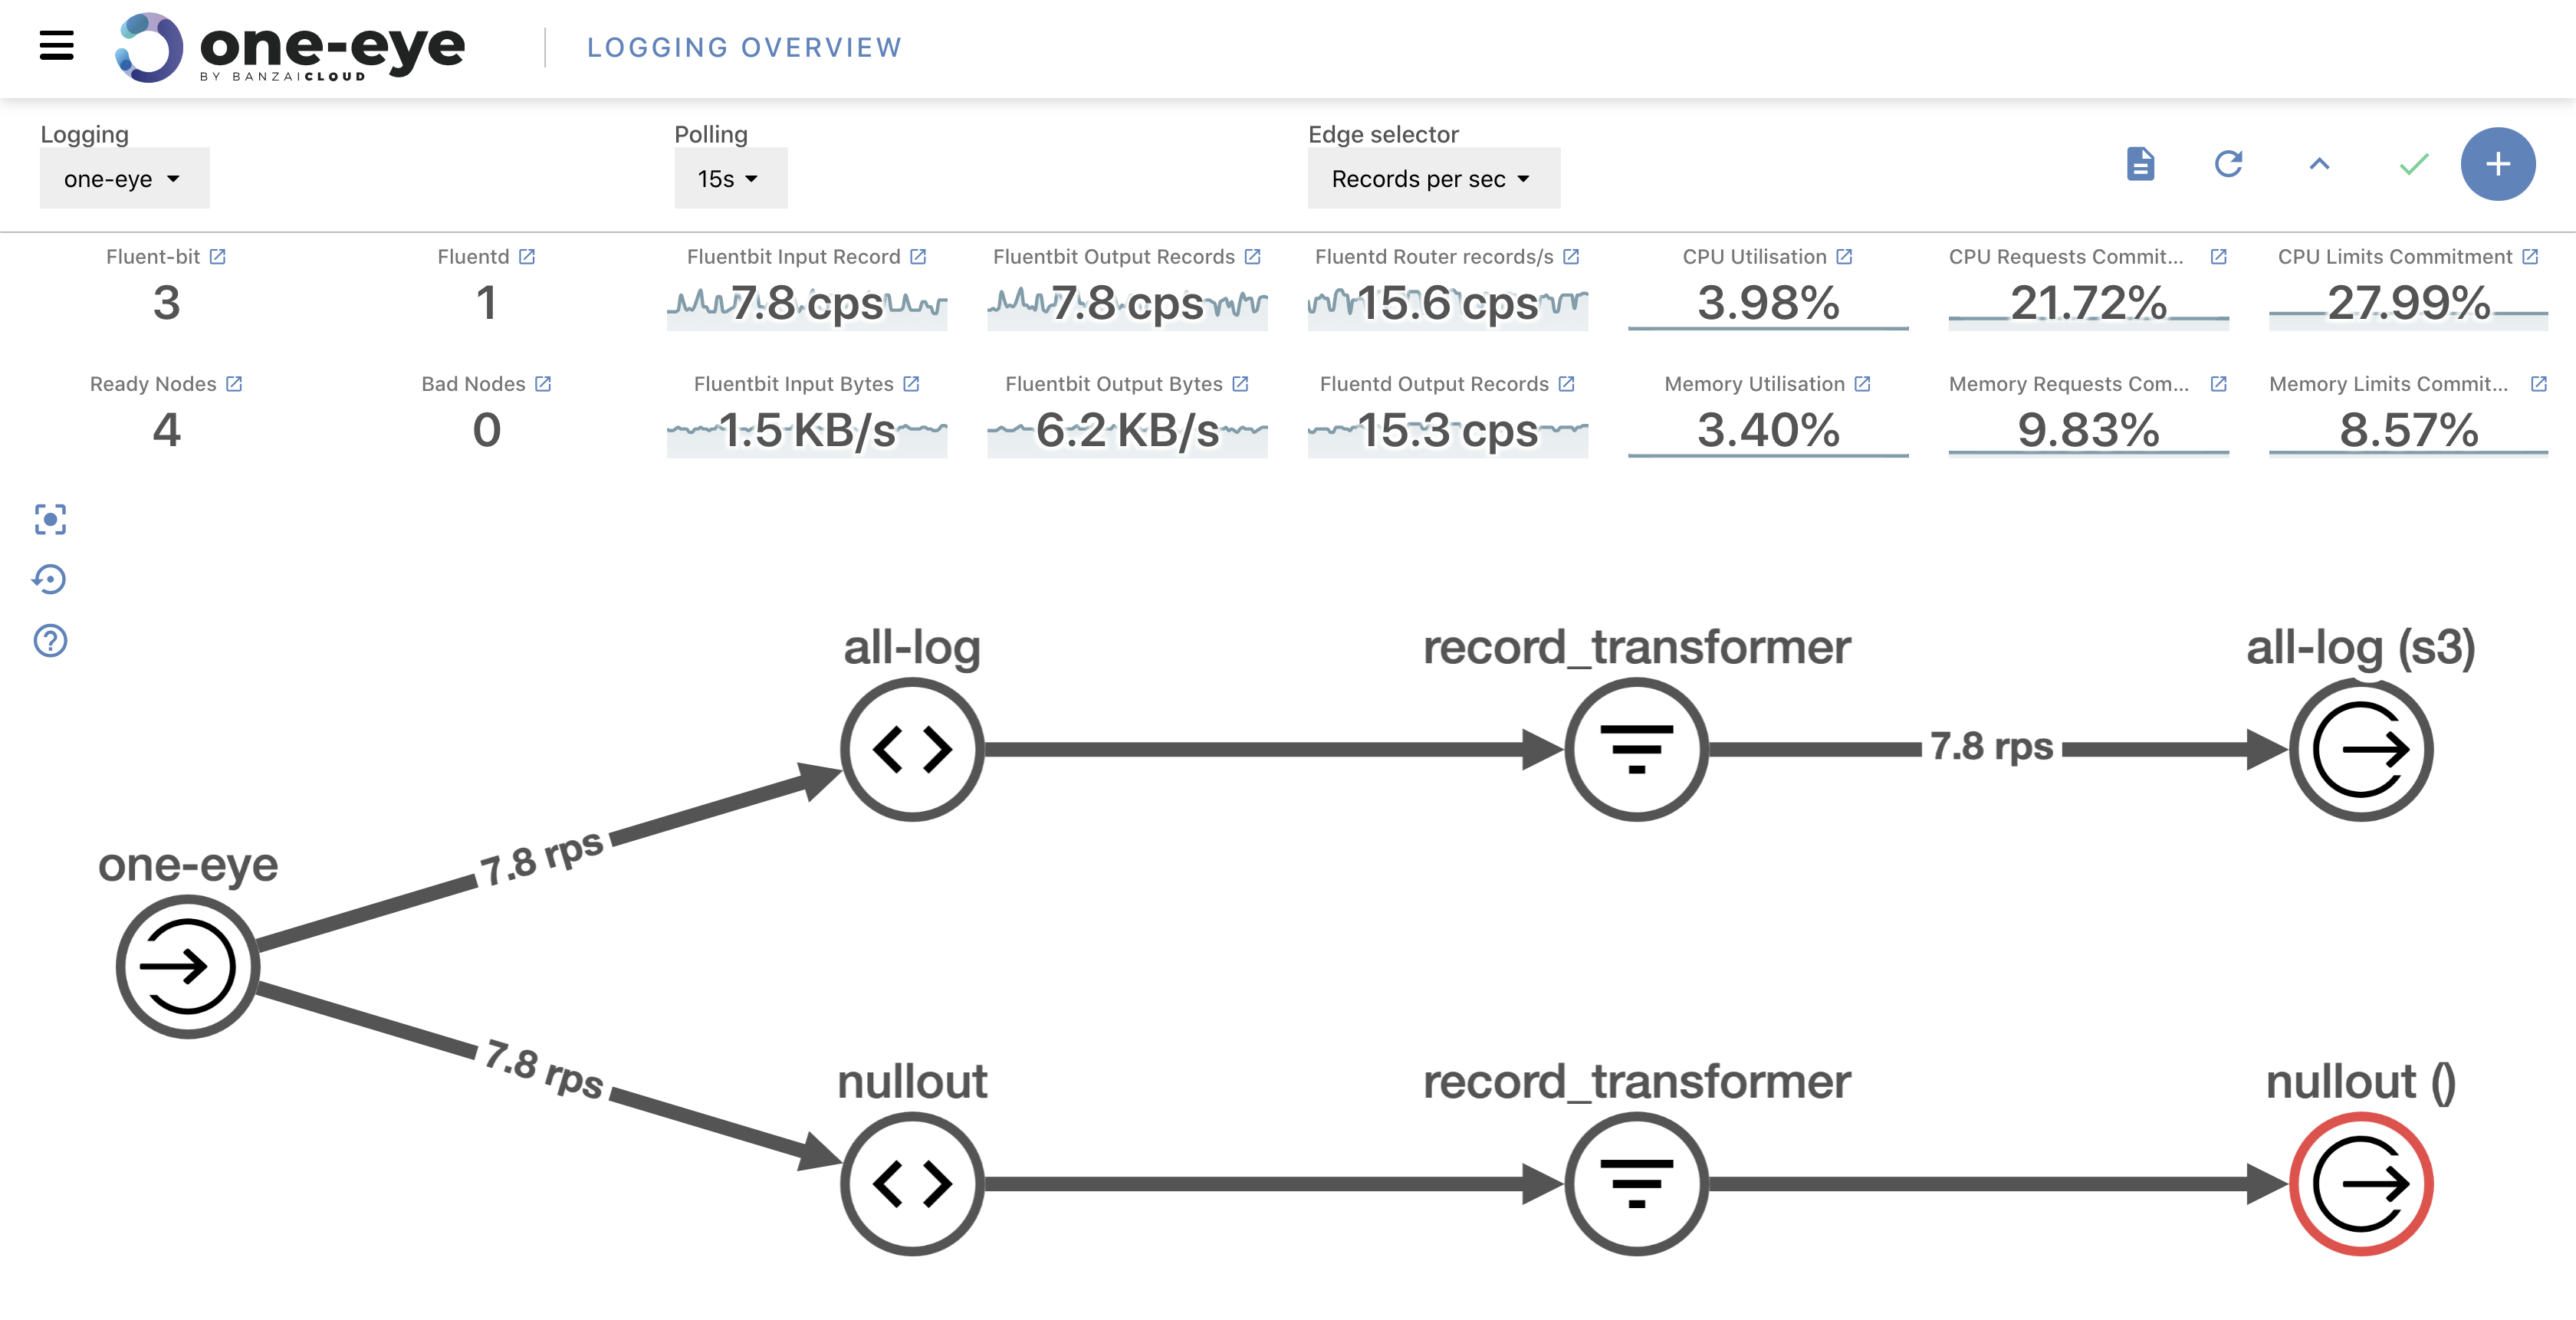
Improved UI 🔗︎
One Eye is a relatively young project with a function orientated roadmap. However, to use an observability tool effectively, you need a fast and responsive UI. Embedding grafana dashboards is the fastest way to provide charts for the user, out-of-the-box, but we struggled with the loading times of such dashboards. From version 0.4 onward, many of the embedded dashboards will be native graphs. I’m sure you’ll notice the difference in performance!
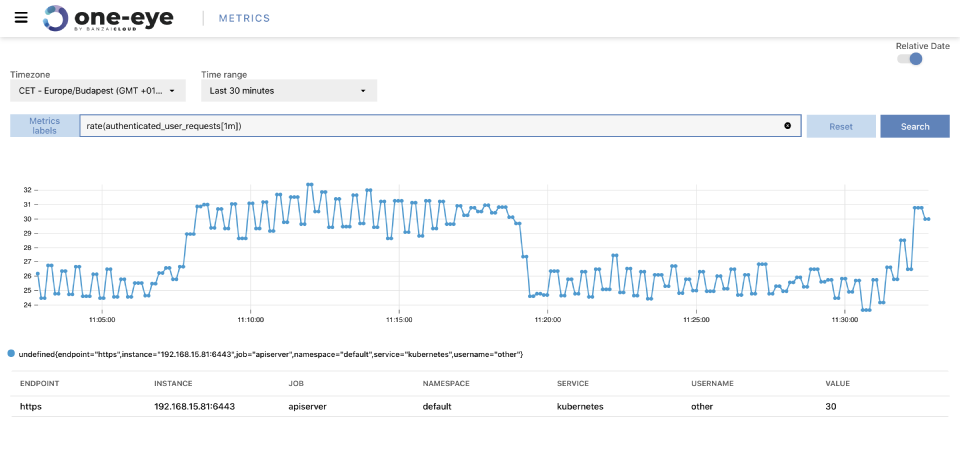
Metrics view 🔗︎
As we’ve been working towards a functional correlation UI, we’ve been implementing components one by one. From version 0.4 on, you can use metrics view to query your Prometheus metrics. This is a simplified way of quickly accessing Prometheus datapoints.

Added Promtail support 🔗︎
Since fluentd and fluentbit have trouble ingesting logs into Loki, we added support for simple Promtail installation. As a result of its architecture, fluentd can’t guarantee message ordering so a lot of messages are dropped by Loki. fluentbit recently published improvements to its transport logs. Moreover, they published the official version of Loki. There are still some improvements that have to be made, like those to its retry logic. Until fluentbit Loki output is stable enough, feel free to use Promtail. After that, we will likely to drop Promtail support and add a configuration for fluentbit Loki output.
Grafana Operator for more dynamic configuration 🔗︎
To provide you with more freedom when customizing different parts of the system, we switched from a Grafana Helm chart to a Grafana operator. The operator gives you more freedom when it comes to you dynamically adding data sources or dashboards. You can now enjoy all the features Grafana Operator makes available.
New install command 🔗︎
As the stack grows more complex, even the installation flow has begun to take considerable time. We introduced a simple install command to install all necessary components for an out-of-the-box monitoring solution. Because configuration depends heavily on the Infrastructure you’re using, we’ll introduce profiles to handle different environments. This configuration includes different alerting rules etc…
New log workload generator function 🔗︎
Last but not least we added a log generator. This feature is better for testing and test automation, but hardly worth mentioning. For now, it is essentially the same log-generator we already wrote to generate Nginx access in log format. If you are new to One Eye, this is a great tool to test different filters, outputs etc.
$ one-eye log-generator install
? Select the namespace for your output default
? Generator replica count 1
? Maximum interval between log messages (s) 1
? Minimum interval between log messages (ms) 100
? The amount of log message to emit/s 3
✓ crds ❯ resource is in sync name=observers.one-eye.banzaicloud.io, apiVersion=apiextensions.k8s.io/v1beta1, kind=CustomResourceDefinition
? Please confirm to update component! Yes
New Standalone explain command for the Observer 🔗︎
It can be challenging to document a project as big as One Eye. To ease this burden, Kubernetes has an explain command. However, our observer complexity would mean that we’d generate CRDs that included the documentation, but were too large. That is why we ported the explain command into our binary.
$ one-eye observer explain spec
KIND:     Observer
VERSION:  one-eye.banzaicloud.io/v1alpha1

RESOURCE: spec <Object>

DESCRIPTION:
     ObserverSpec defines the desired state of Observer

FIELDS:
   certmanager <Object>
     CertManager component descriptor

   clusterName <string>
     Custom name for cluster
...
Under the hood changes 🔗︎
As you can see, we’re taking this opportunity to expose our users to many new features. However, we also made a lot of improvements under the hood.
We moved our image build from Docker to Github 🔗︎
Since Dockerhub announced it’s “pull rate-limiting” for open source containers, we moved our image repositories to Github. If you hardcoded old image versions, please be careful and update the repository as well.
Operator tools changes 🔗︎
If you are interested in what’s going on under the hood, there is one more big change. We moved from the Helm chart release process to use our own Helm templating and release solution. What does that mean? From now on, we don’t use Helm releases to track versions of a deployment. One Eye (both CLI and Operator) renders Helm templates and uses our own objectmatcher tool. In practice, reconcile loops won’t cause Helm release updates, which will only apply to resources that differ from their earlier versions. One more benefit is that we can automatically update CRD resources, as well (which Helm 3 couldn’t do).
As of this release, a new logging engine will be put in place. If you are familiar with Backyards (now Cisco Service Mesh Manager), our great istio toolset, the same interactive grouped logging is available in One Eye!