


A couple of weeks have passed since the release of One Eye version 0.3, which introduced some powerful UI and backend improvements. Our goal with One Eye is to provide a singular vantage point from which you can see what’s happening inside your Kubernetes cluster, centralizing our observability tools into one place and onto one dashboard. However, we’re not trying to reinvent the wheel by re-implementing observability, but to organize and configure existing tools to create a seamless experience. Ideally, One Eye should be able to assist in Day-0, Day-1, and Day-2 operations without much effort from you, the user. We’ve been working hard to make this a reality, so let’s see what’s changed since the previous release.
Logging Overview changes 🔗︎
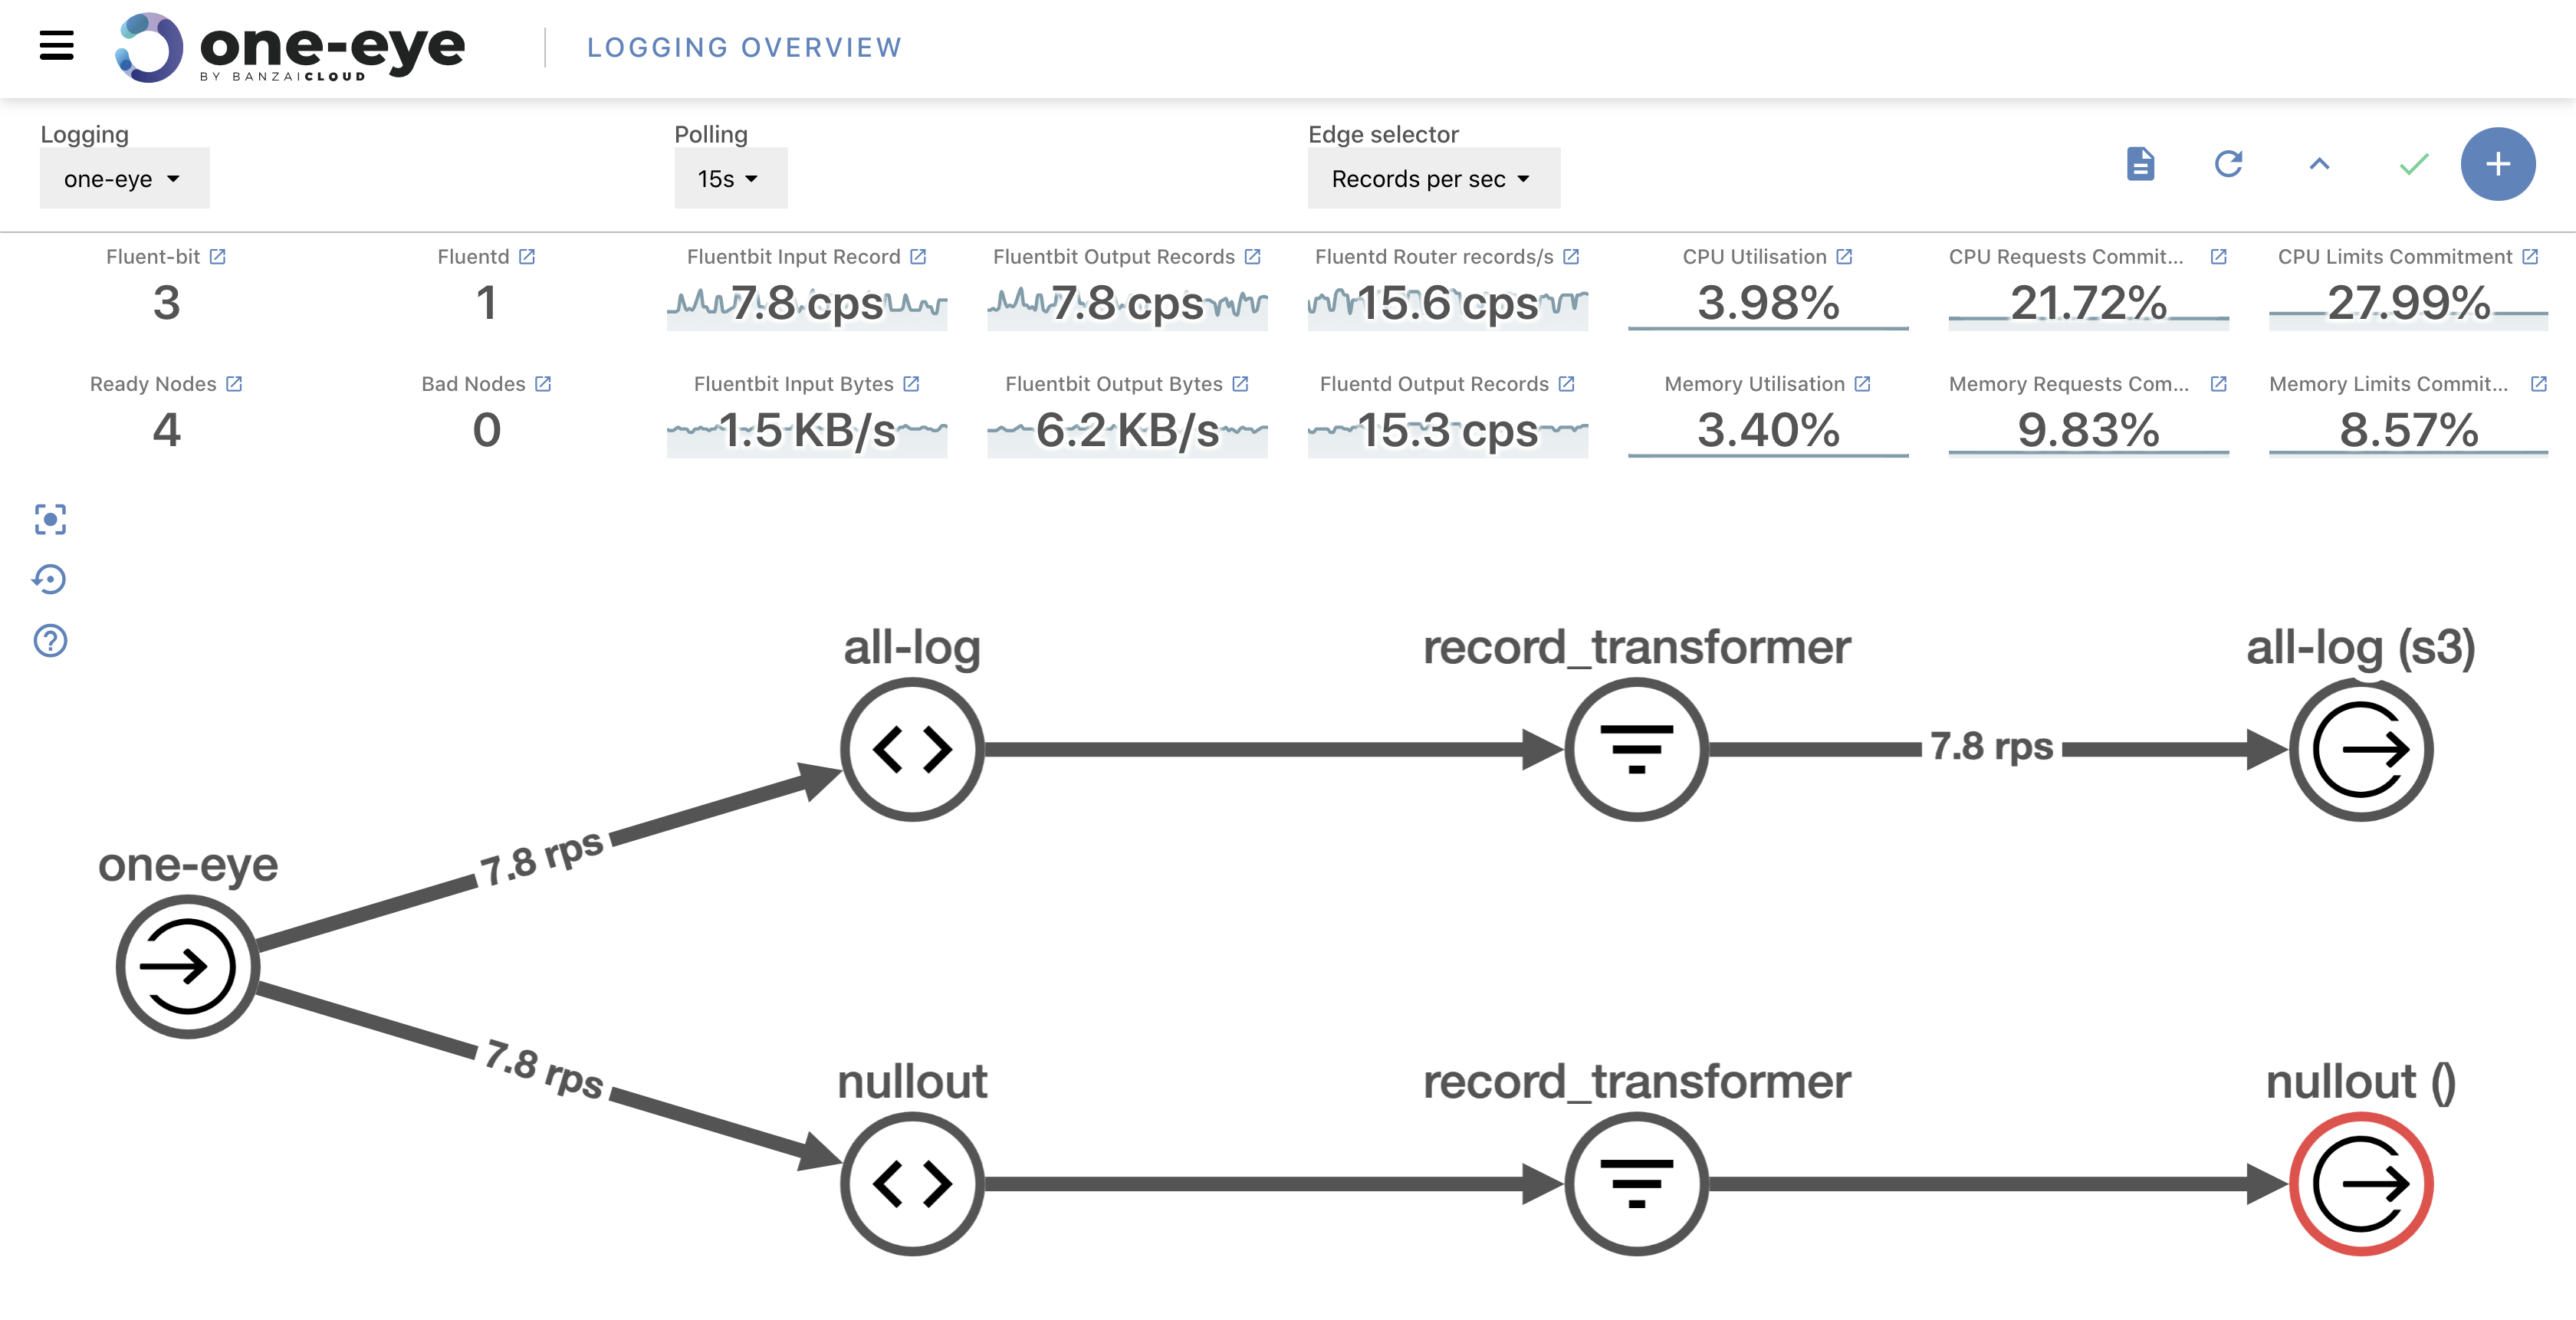
To help prototype faster logging flows, the One Eye UI (in addition to the usual CLI or declarative CRD-based) now supports logging resource management. Resources such as Logging, Flow, Output, ClusterFlow and ClusterOutputs can now be created, edited, or deleted from the UI. We redesigned the information view of the graph’s nodes and match nodes to look cleaner. And, to better handle larger Kubernetes clusters, matching pods are now lazy-loaded upon request. Different views (metrics, configuration, etc.) can now be found in different tabs.
Cluster Events 🔗︎
Kubernetes’ most important communication channel is events. Those events can come from any Kubernetes resource or process. You can track successful and failed processes, and, when an anomaly is detected, the first thing people usually check are said events. Access to those events has been place at our fingertips with the One Eye dashboard. We can filter, order, and search events to immediately identify the relevant changes on our cluster.
Alerts 🔗︎
To reduce the MTTR (meantime to repair) of issues, we reduced the navigation required between different tools. In the alert section, all Prometheus alerts are now visible. Furthermore, One Eye detects relevant labels (like Pod, App, etc…) to connect alerts with their corresponding Kubernetes workloads. No more copy-pasting information having to do with alerts. Sounds nice, doesn’t it? But we didn’t stop there. The development of an alertmanager configuration is already in progress. What does this mean? It means we’ll be able to add/remove notification endpoints, alert levels and much more from our dashboard, so stay tuned!

Query the logs from the UI 🔗︎
We introduced Loki integration with a previous version of One Eye, but this time we took it one step further. With this release, we can browse logs directly from the One Eye UI, as well as access all the Loki features from the same dashboard, so you never have to leave or switch between UIs or tools.
Coming in future releases 🔗︎
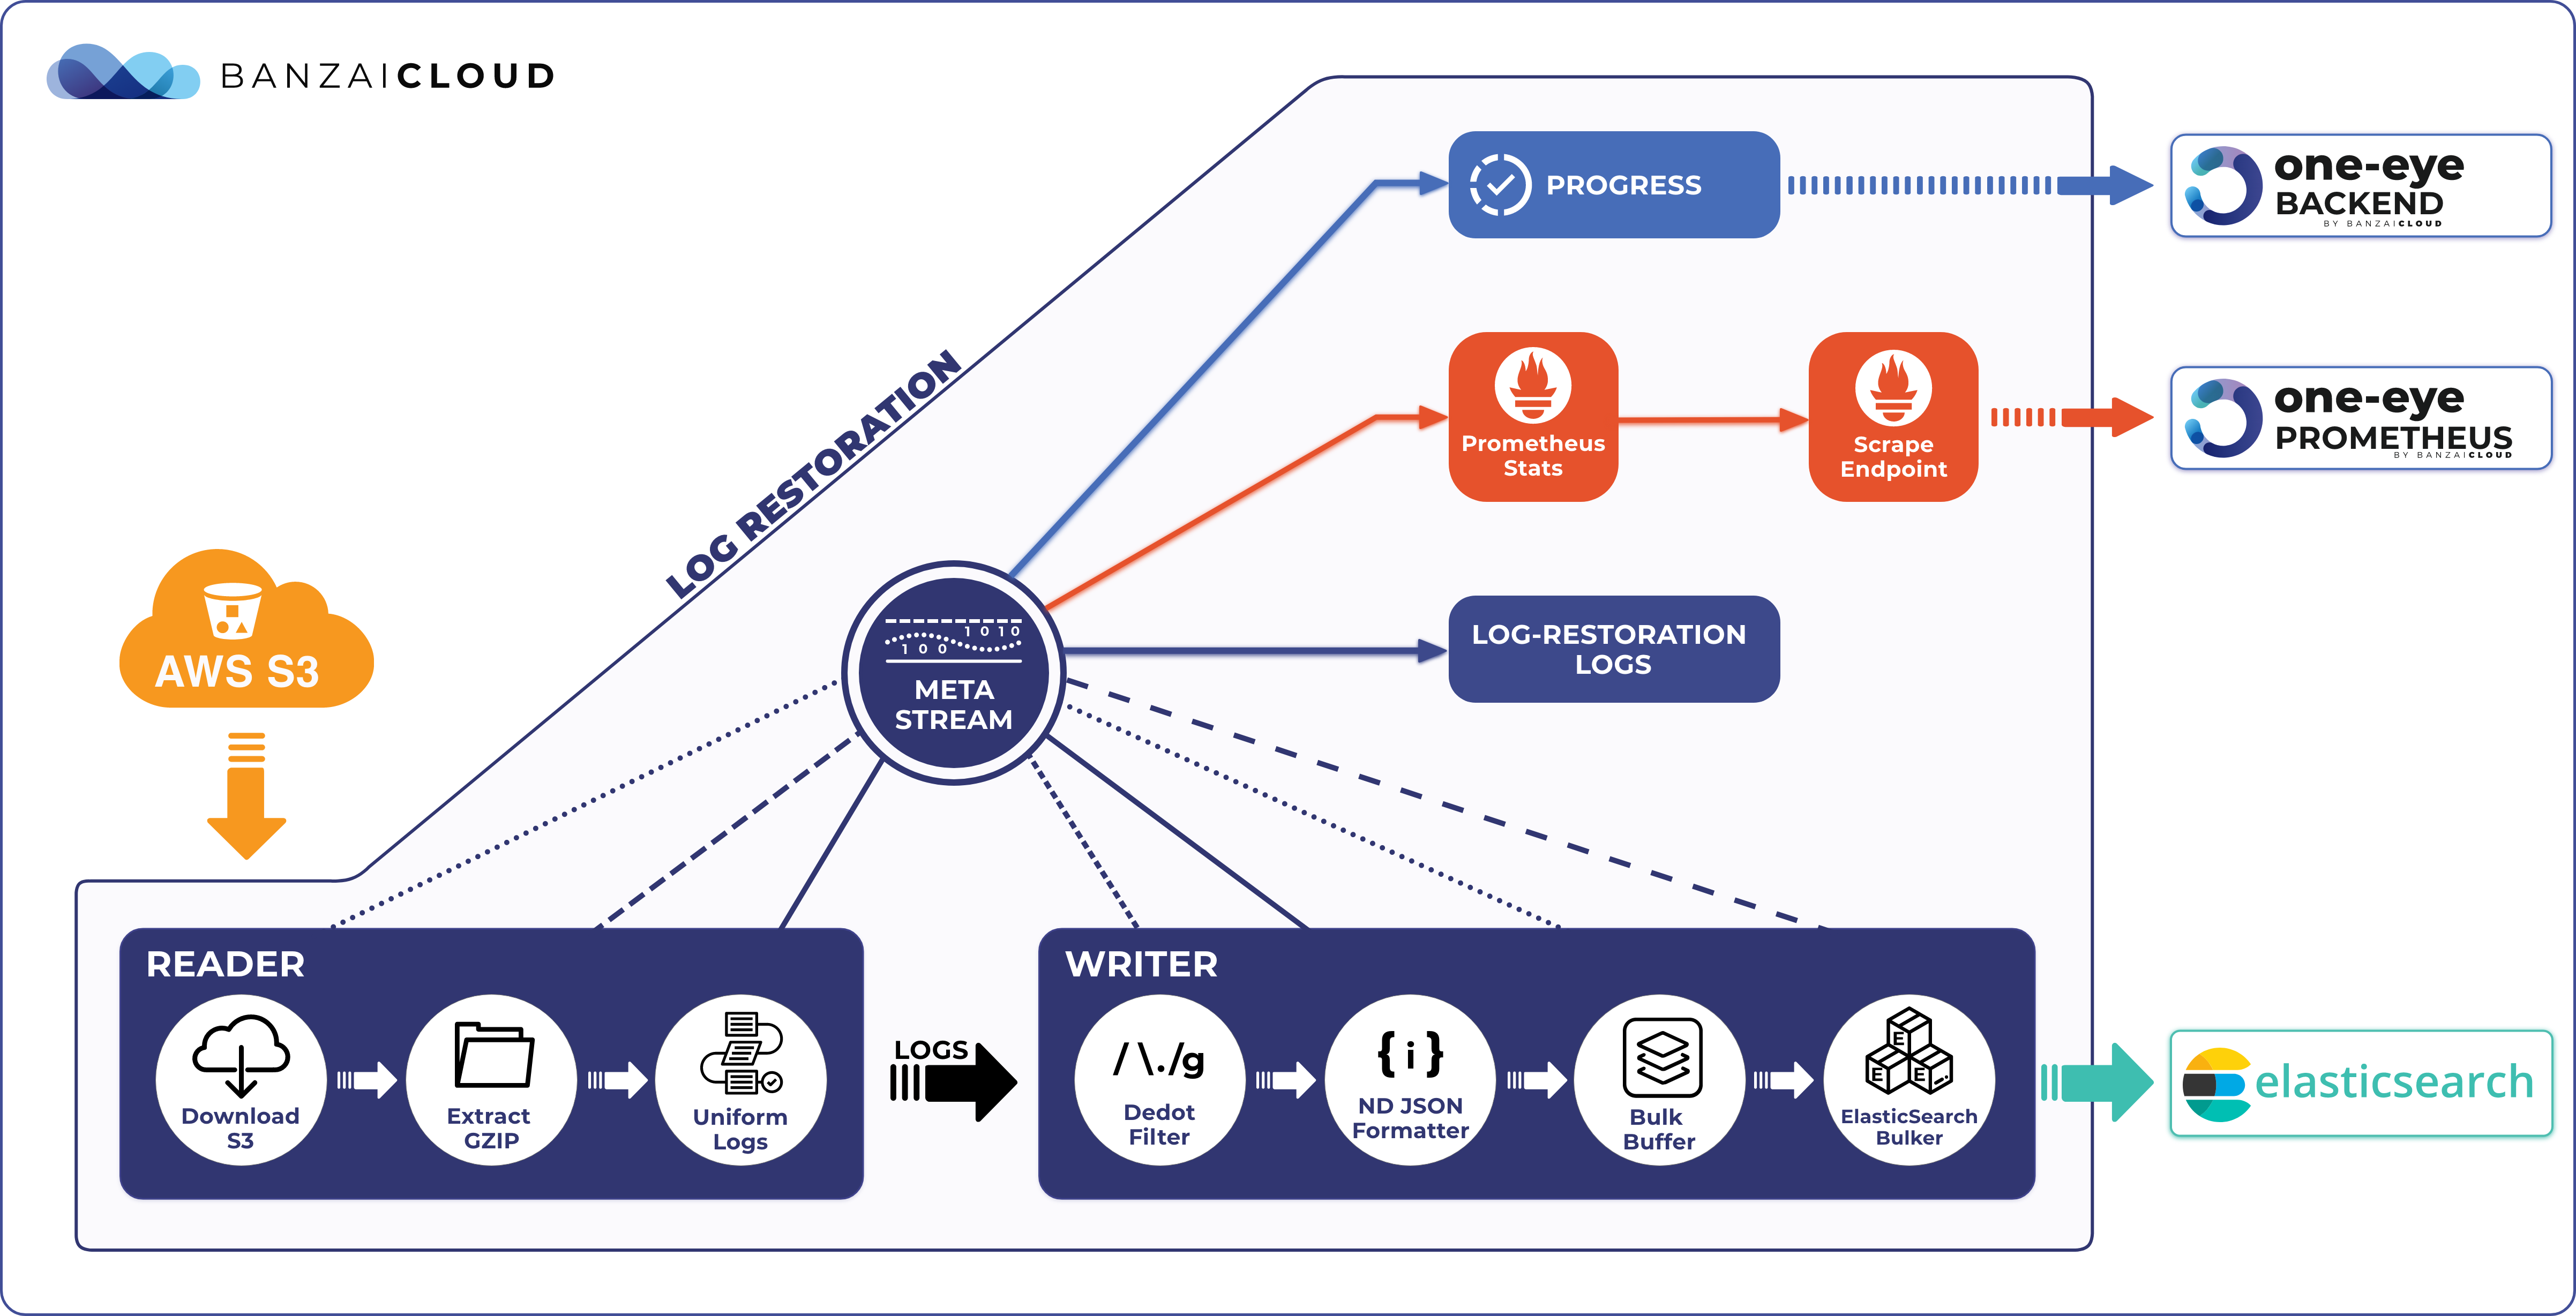
All of these new features aim to provide a responsive and streamlined observability experience, but the sum of these parts is still far inferior to the value of their whole. Next, we’ll be implementing a correlation dashboard to show all the relevant information on a single screen, drastically reducing the incident handling time via correlations between metrics and logs. Another feature that’s nearing the finish line is log rehydration. With the press of a button, all the logs archived into object stores will be available for browsing and (re)analyzing. So stay tuned and, ‘til then, take One Eye for a spin!