


Whenever we talk about Kubernetes monitoring and the topic of Prometheus comes up, so does Grafana; the two pretty much go hand in hand.
Prometheus query language 🔗︎
This article will not serve as an introduction to the powerful Prometheus query language. If you’re not comfortable with Prometheus, now would be a good time to familiarize yourself with the basics of querying and monitoring best practices with Prometheus on Kubernetes. We will only use simple queries with filters and labels in this post.
Grafana marketplace 🔗︎
The Grafana marketplace offers a lot of common dashboards for its most popular applications like Kubernetes, MySQL, or JVM. You can save a lot of time by using these community-built dashboards, but be careful. These dashboards change often, and many contain severe bugs or misinterpreted metrics. As part of our deep dive into Grafana templating, we’ll go over one of these dashboards and fix its mistakes.
The Banzai Cloud Pipeline platform comes with monitoring infrastructure and dashboards out-of-the-box, which provide insights into applications at the cluster level.
Let’s take a look at a standard version of Kubernetes Pod Metrics.
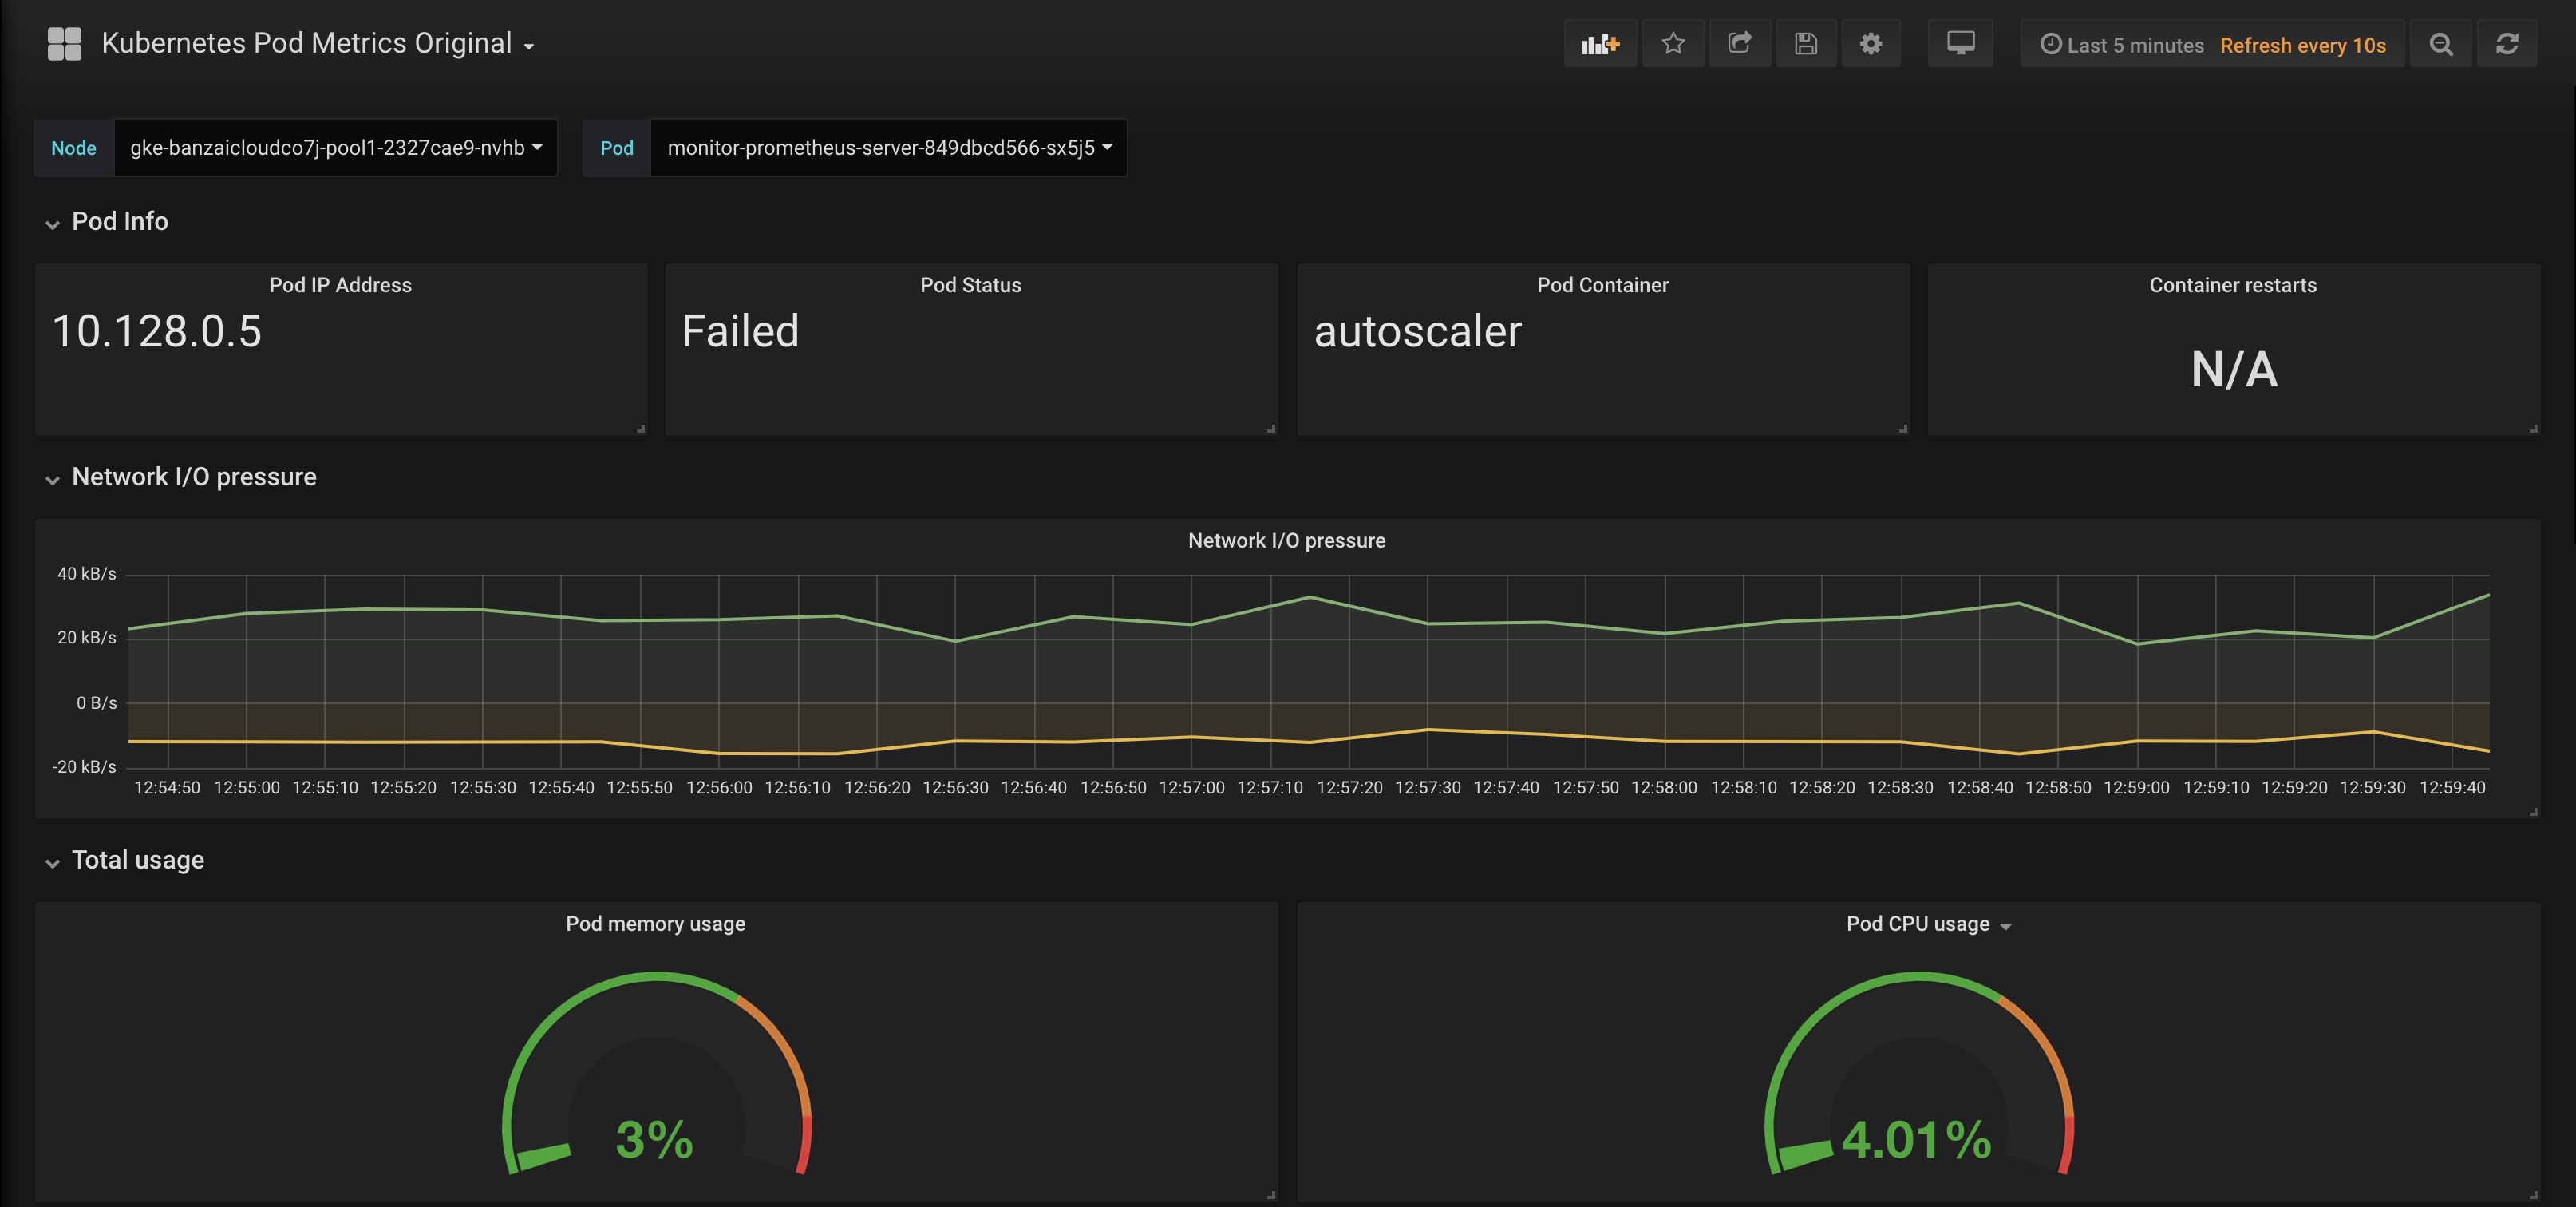
At first glance everything seems okay: the dashboard seems nice and shiny and it provides a lot of useful information. However, if we dig a little deeper we’ll find several mistakes. The following screencast demonstrates that no matter which Pod we choose, the first row stays the same (Pod IP, Pod Status, Pod Container, Container restarts keep on showing the same values).
Under the hood 🔗︎
You can see that the first row consists of Grafana Text panels. These panels can print any text message on your dashboard. However, this doesn’t necessarily mean that any metric can be displayed accurately as text, often one has to do the mapping explicitly through the use of template variables. If you’re not familiar with Grafana template variables, check out the official documentation. Our first step will be to explore the variables used by this dashboard.
1Variable    Definition
2------------------------------------------------------------------------------------
3$Node       label_values(kubernetes_io_hostname)
4$Pod        label_values(kube_pod_info, pod)
5$Pod_ip     label_values(kube_pod_info, pod_ip)
6$phase      label_values(kube_pod_status_phase, phase)
7$container  label_values(kube_pod_container_info, container)
Grafana variables 🔗︎
Let’s try and understand what’s happening here and how Grafana variables work. You can set Grafana variables manually or fetch values from a query. Additionally, you can extract labels from prometheus with the label_values function, which takes a label name and an optional metrics name parameter. The following examples should help you understand how label_values works:
Extract all hostname labels from Prometheus 🔗︎
1label_values(kubernetes_io_hostname)
2
3All
4gke-banzaicloudco7j-pool1-2327cae9-nvhb
5gke-banzaicloudco7j-system-dca7b834-m2zp
Get Pod labels from kube_pod_info metric 🔗︎
1label_values(kube_pod_info, pod)
2
3All
4kube-proxy-gke-banzaicloudco7j-pool1-2327cae9-nvhb
5kube-proxy-gke-banzaicloudco7j-system-dca7b834-m2zp
6fluentd-gcp-v3.1.0-bnvwj
Note:
Allis an alias for all values. This is frequently overwritten with the custom regexp value:".*"
What’s great about this is that you can apply filters to these metrics to create hierarchical choices. The following example gets pod_ip from the pod_info metric, filtered for Pod as pod name and Node as node hostname.
1label_values(kube_pod_info{pod="$Pod", node="$Node"}, pod_ip)It’s worth mentioning that these filters work without concrete metric names, so the following expression is perfectly valid:
1label_values({pod="$Pod"}, pod_ip)Once we take this into consideration, it’s easy to spot the problem and fix it. All we have to do is to add the proper filters on the metrics:
1$Node        label_values(kubernetes_io_hostname)
2$Pod         label_values(kube_pod_info{node=~"^$Node$"}, pod)
3$Pod_ip      label_values(kube_pod_info{pod="$Pod", node="$Node"}, pod_ip)
4$container   label_values(kube_pod_container_info{pod="$Pod"}, container)
Note: If you want to use all as ".*" value you have to use regex matching. The $Pod variable in the example uses regexp ( =~ instead of simple = ) to evaluate the filter.
Fixing Pod status 🔗︎
The other problem with this dashboard is that Pod Status always says ‘Failed’. This is because the authors of the original dashboard never checked the status of each query, but only checked whether a phase label existed. This resulted in incorrect semantics, and the Failed string to be displayed.
Prometheus monitors Pod status via kube_pod_status_phase metric. It has a phase label and if the Pod is in that given phase, the call returns a value of 1, otherwise it returns 0. This means that all our labels are always listed but the query returns a different result depending on whether that label is the actual status of the pod.
1kube_pod_status_phase{phase="Failed",pod="event-exporter-v0.2.3-54f9475"} = 0
2kube_pod_status_phase{phase="Running",pod="event-exporter-v0.2.3-54f9475"} = 1
3kube_pod_status_phase{phase="Pending",pod="event-exporter-v0.2.3-54f9475"} = 0
4...
This original method uses a template variable called $phase which shows the first phase as: Failed and this is what was always displayed - incorrectly - on the original dashboard.
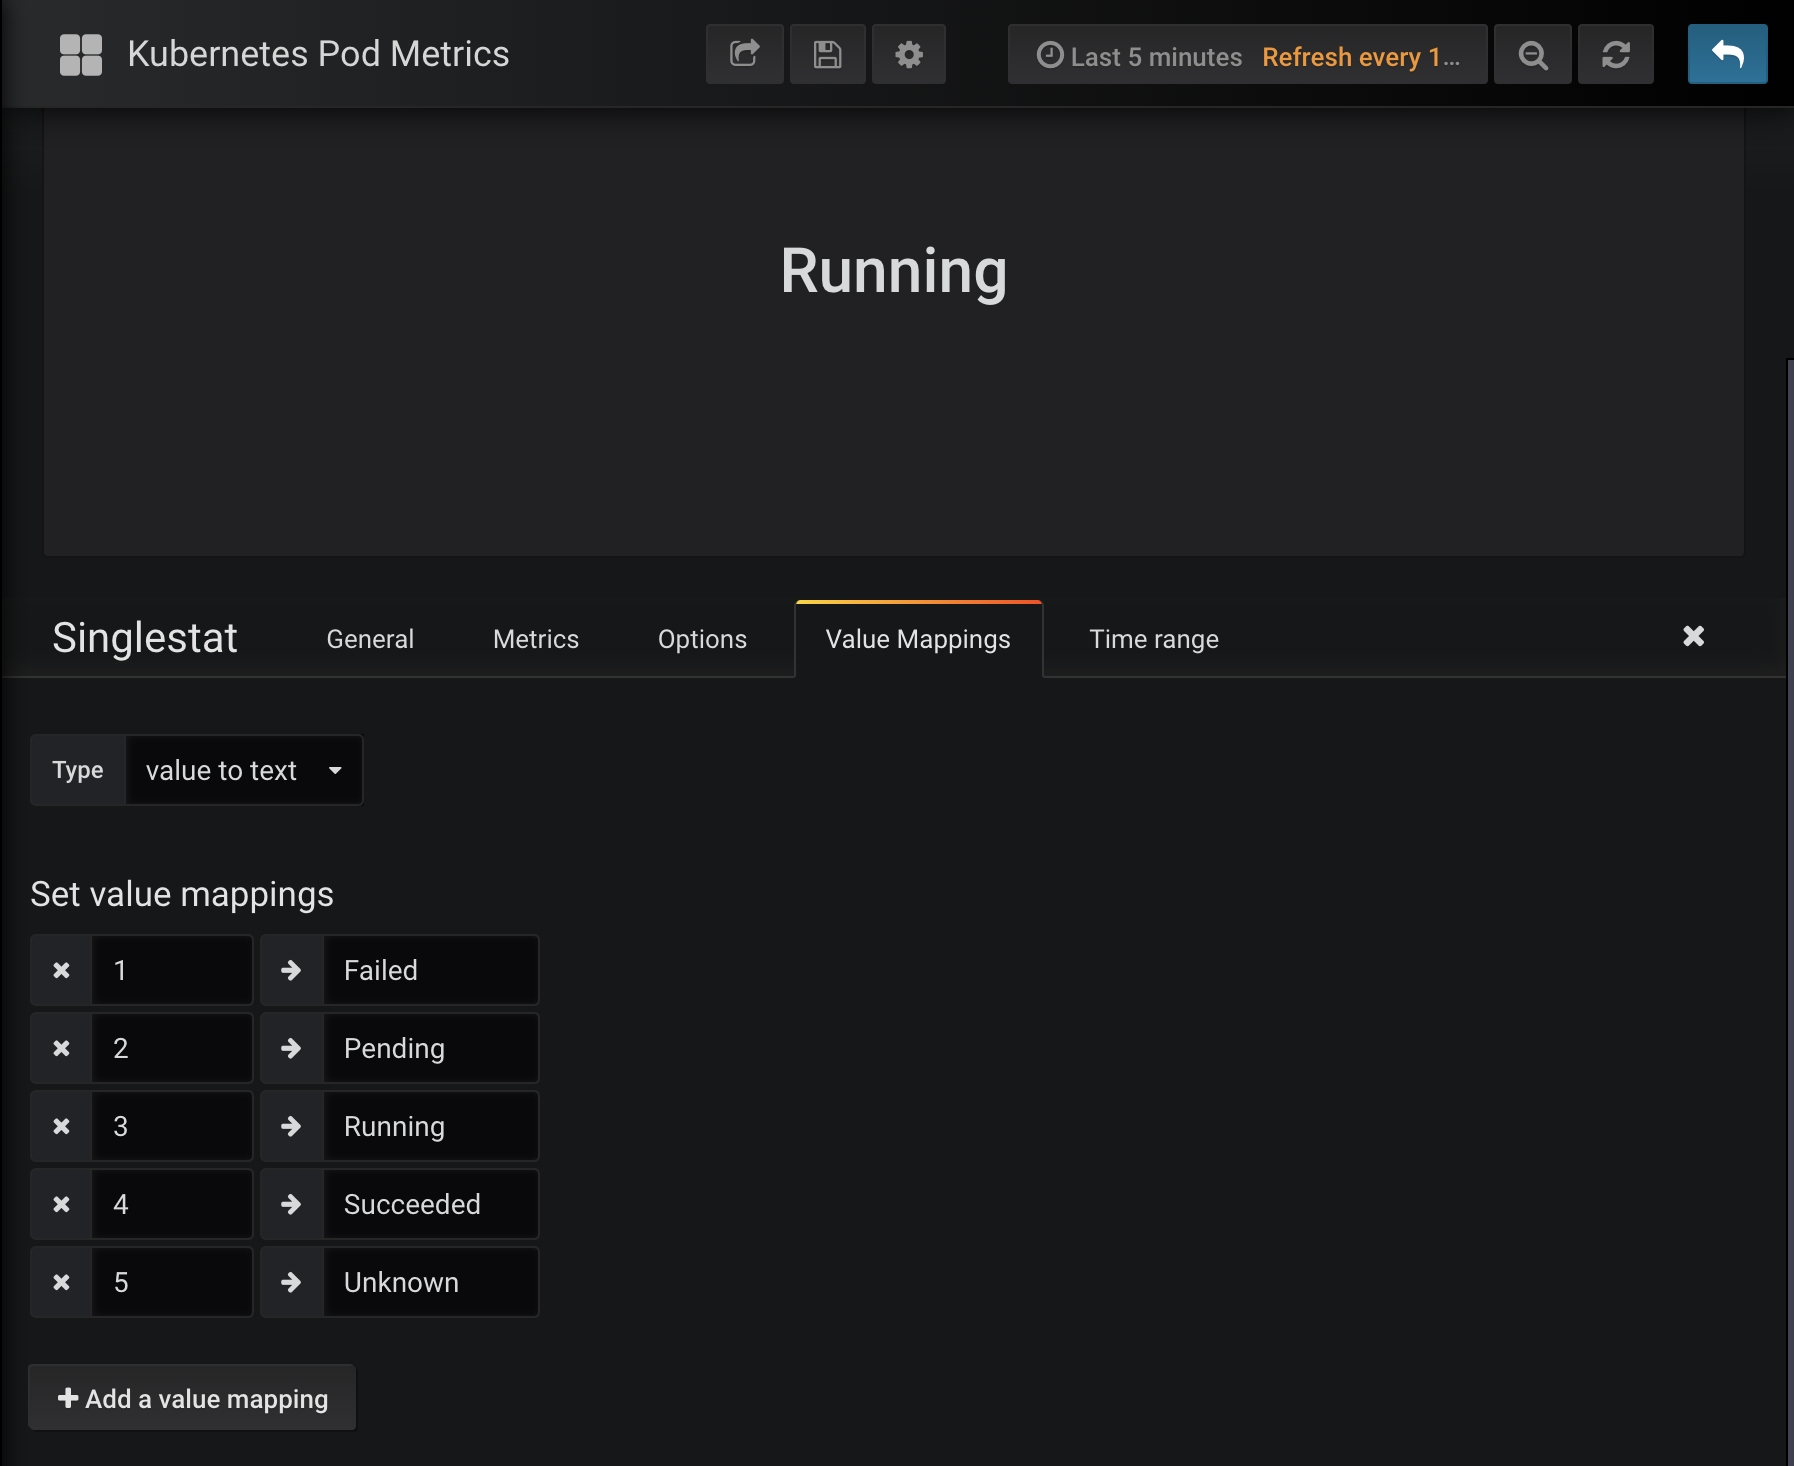
Because we know that results of the calls will always be 1 or 0, it’s easy for us to transform this information into a single variable that represents the pod status numerically. We multiplying each state with a different unique number (knowing that only one of the values can be non-zero at any given time). The results is that each number corresponds to a different state, and the query looks like this:
1scalar(kube_pod_status_phase{pod="$Pod", phase="Failed"}*1) + scalar(kube_pod_status_phase{pod="$Pod", phase="Pending"}*2) + scalar(kube_pod_status_phase{pod="$Pod", phase="Running"}*3) + scalar(kube_pod_status_phase{pod="$Pod", phase="Succeeded"}*4) + scalar(kube_pod_status_phase{pod="$Pod", phase="Unknown"}*5)The query above shows 1 for Failed and 2 for Pending and so on.
Note: as all values are vectors you need to cast them to scalar() before you can summarize them
To make this easier on the eyes, we can transform these numbers into status texts using value mappings.
Pod’s containers 🔗︎
Last problem we need to address is the matter of container names inside the Pod. The problem is that the original dashboard kept on displaying the same container name (which was the first in the list when queried). We can do the following to fix this:
We gather the container names via templating. kube_pod_container_info has a label with a Pod’s name in pod and the a container’s name in container.
1$container label_values(kube_pod_container_info{pod="$Pod"}, container)We have a variable called $container, which can contain a one or more names. When we put the variable in a text panel, it will display the first value in the list. If the list has multiple values, we need to iterate through the list to display all the containers in the list. Luckily, Grafana panels have a built-in Repeat function, which loops through a variable and renders a different panel with each value in the list.
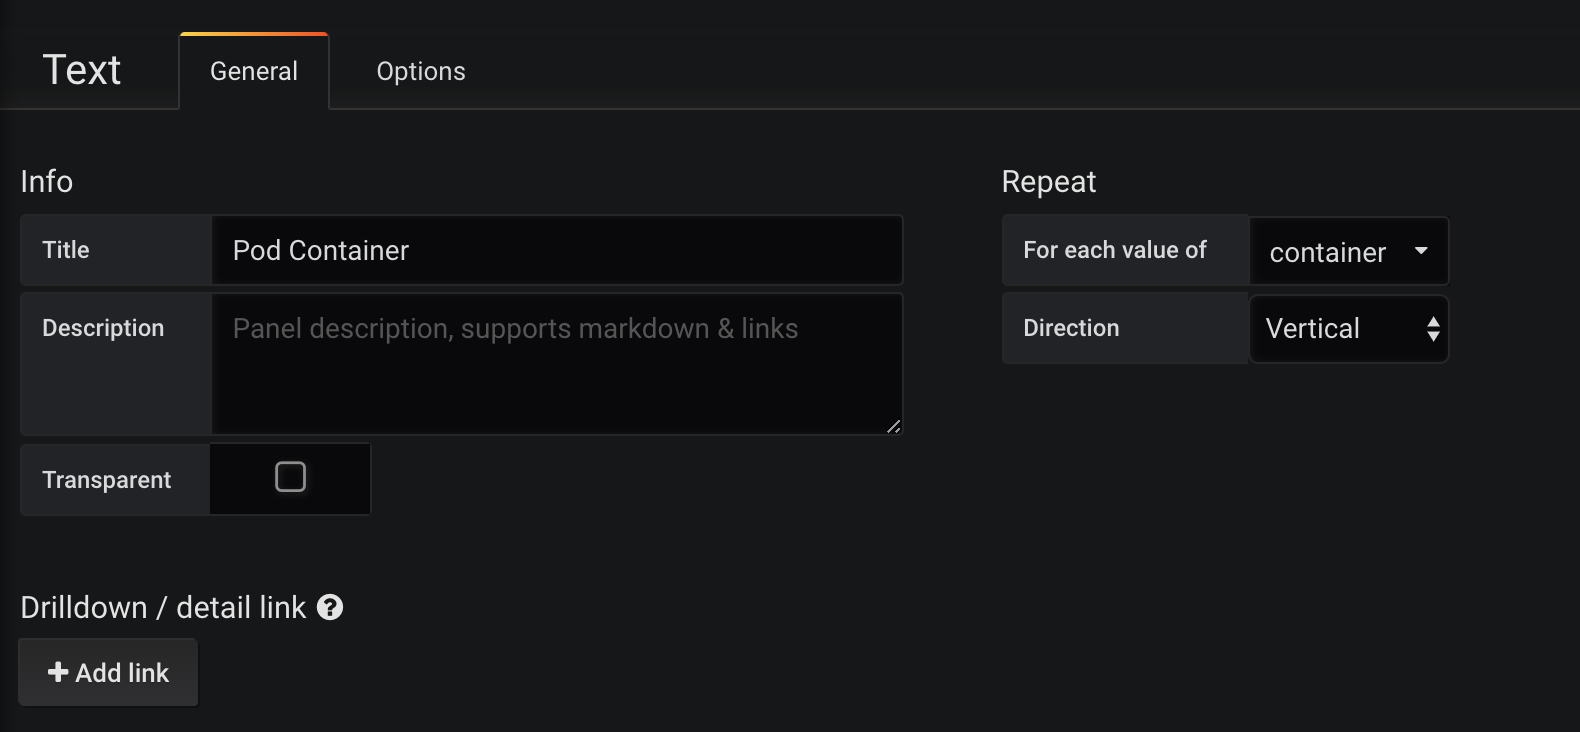
You can choose which variable you want the function to iterate on, and choose between vertical and horizontal orientations.
Putting it all together 🔗︎
We firmly believe that it’s most efficient to learn from other people’s mistakes. To this end, we used an existing dashboard as a case study for getting into some key Grafana concepts, such as templating. The result is a correctly working version of Kubernetes Pods metrics.
I hope you liked this post and that it helps you in your efforts to create innovative and functional Grafana dashboards. If you would like a fully working solution, the Banzai Cloud Pipeline platform gives easy access to your metrics through automated monitoring that’s perfect down to the last detail. The fixed dashboard is available as part of our monitoring Helm chart.