


More than a month ago, we announced One Eye, the observability tool for Kubernetes. This has been an ongoing project, and we release a new version of it about once per week. We’ve gathered the features included in those updates here to keep you up to speed. If you are not familiar with One Eye, check out our introductory blog post or browse the official documentation.
Who is One Eye for? 🔗︎
One Eye aims to provide simple yet effective observability for your Kubernetes clusters. It builds on open source software and our considerable experience operating clusters. With the help of One Eye, you can use your resources more efficiently and effectively reduce the time between sandbox and production environment deployments. One Eye manages the interactions between different observability tools to get the most out of them. This may not sound like a lot of work but it absolutely is; despite the fact that One Eye is a young project, it already supports 6 different integrations:
- Cert-manager
- Logging-Operator
- Logging-Extensions
- Thanos
- Prometheus Operator
- Loki
New features 🔗︎
Let’s start with some exciting new features. All of these improvements focus on entry level users to get the system up and running as fast as possible.
Supporting cert-manager 🔗︎
If you want to transfer data securely, sooner or later you will have to manage certificates for TLS connections. The Pipeline platform utilizes Vault for secret and certificate storage and the Logging Operator Helm installer supports ad-hoc self-signed certificate installations. But managing several applications’ certificates can be difficult to say the least. One Eye uses cert-manager as a standardized way of handling those certificates. Logging Operator is the first component to integrate with cert-manager. To try it out you only need this one command.
# Install cert-manager
$ one-eye cert-manager install
# Install logging
$ one-eye logging install --update
# Create certs and configure Logging resource accordingly
$ one-eye logging configure --secure
One Eye will create the custom resources required for TLS certificates. Additionally, the generated configuration will include newly created secrets for fluentd and fluentbit.
apiVersion: logging.banzaicloud.io/v1beta1
kind: Logging
metadata:
  name: one-eye
spec:
  enableRecreateWorkloadOnImmutableFieldChange: true
  controlNamespace: default
  fluentbit:
    tls:
      enabled: true
      secretName: one-eye-fluentbit-secret
...

  fluentd:
    tls:
      enabled: true
      secretName: one-eye-fluentd-secret
    image:
      tag: v1.9.2-alpine-9
      repository: banzaicloud/one-eye-fluentd
    disablePvc: true
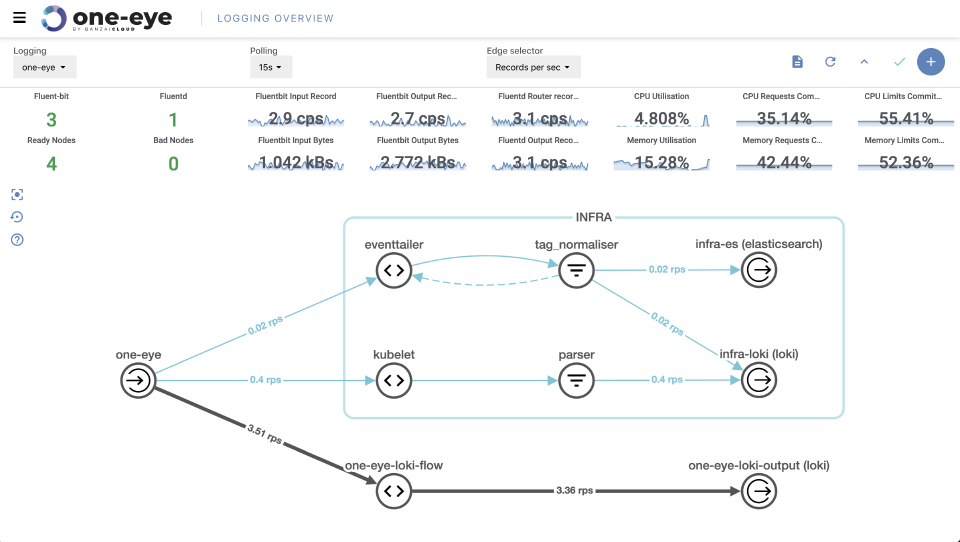
Loki as One Eye logging backend 🔗︎
One of the major new features we support is a Loki deployment. To do this, we must first deploy Loki via One Eye. In the background, it will then install the Loki Helm chart (just like it would for the Prometheus Operator).
Loki is a horizontally-scalable, highly-available, multi-tenant log aggregation system inspired by Prometheus.
$ one-eye loki install
The interesting part here is not the deployment itself, but its integration with other components. Next, we install the ingress (which also includes the One Eye UI component).
one-eye ingress install --update
What happens in the background?
- Loki’s data source is registered as a new datasource in Grafana (if Prometheus is enabled)
- One Eye installs a ClusterFlow and ClusterOutput to transport all logs into Loki
- The Drilldown menu is populated with Loki integrations
Let’s continue with a look at some web experience improvements.
Discover the One Eye UI 🔗︎
In a previous blog we shared some screenshots and videos about the UI, but let’s dig a little deeper into what’s going on here.
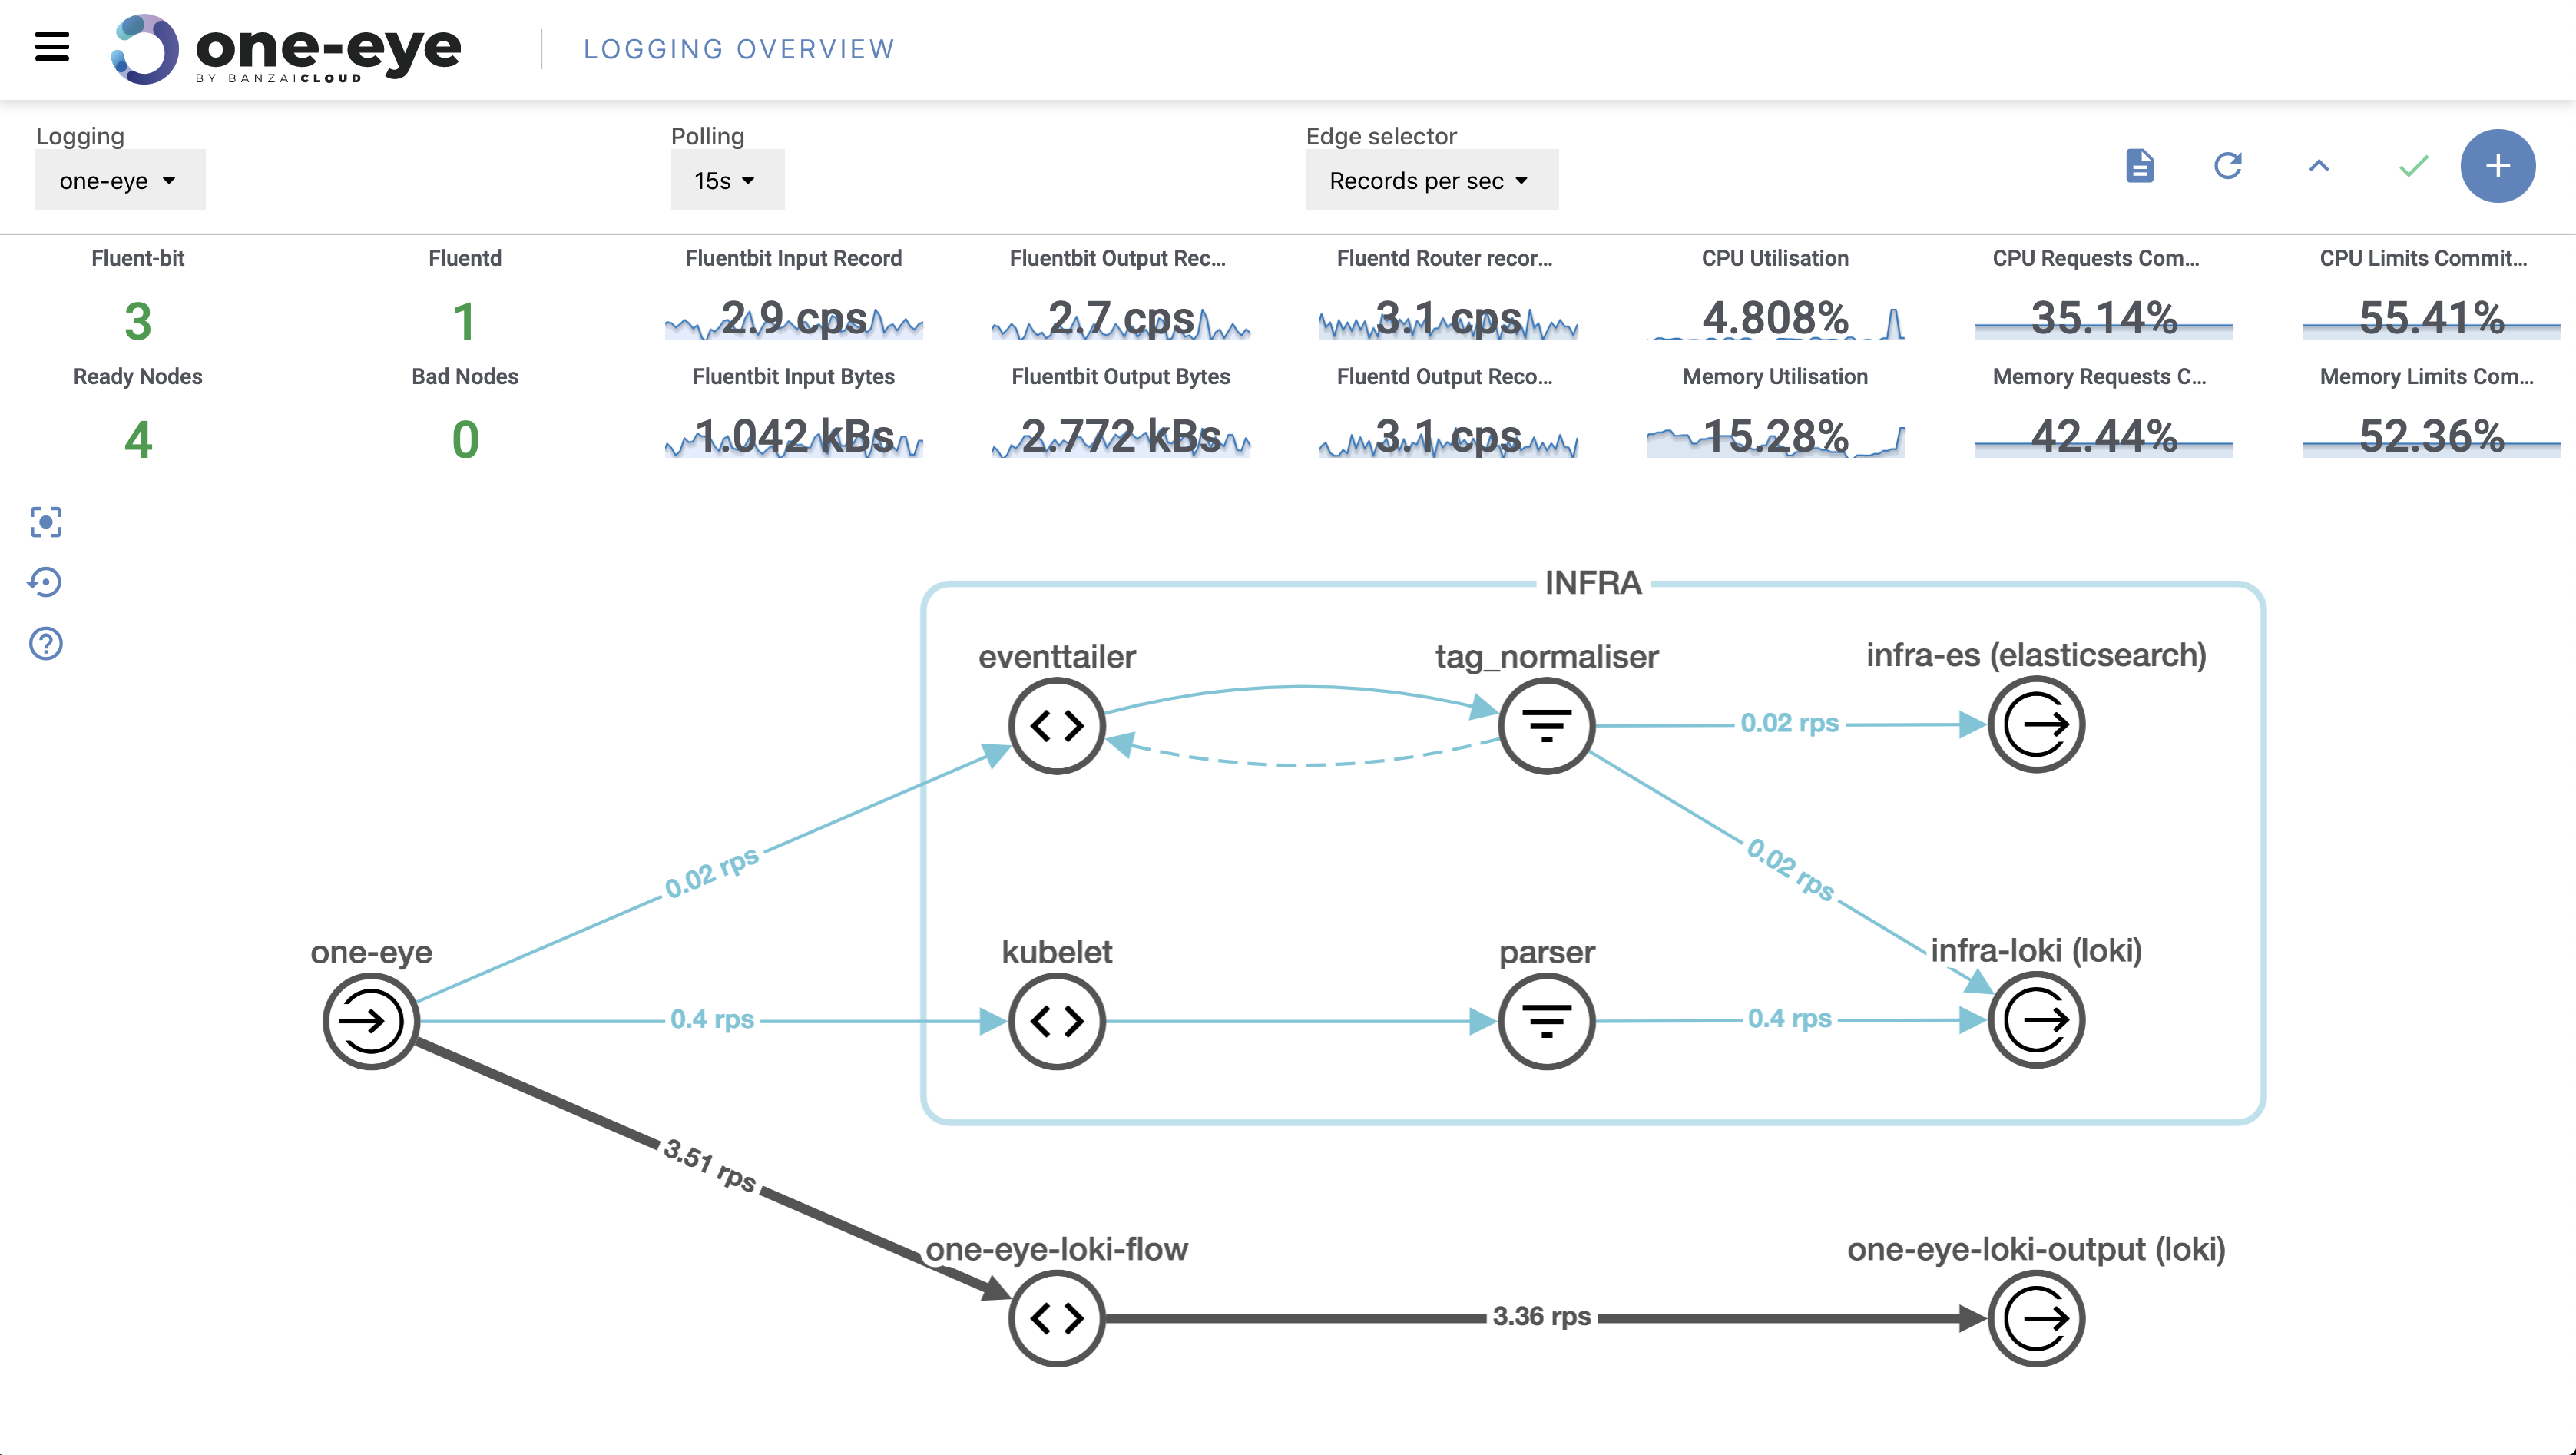
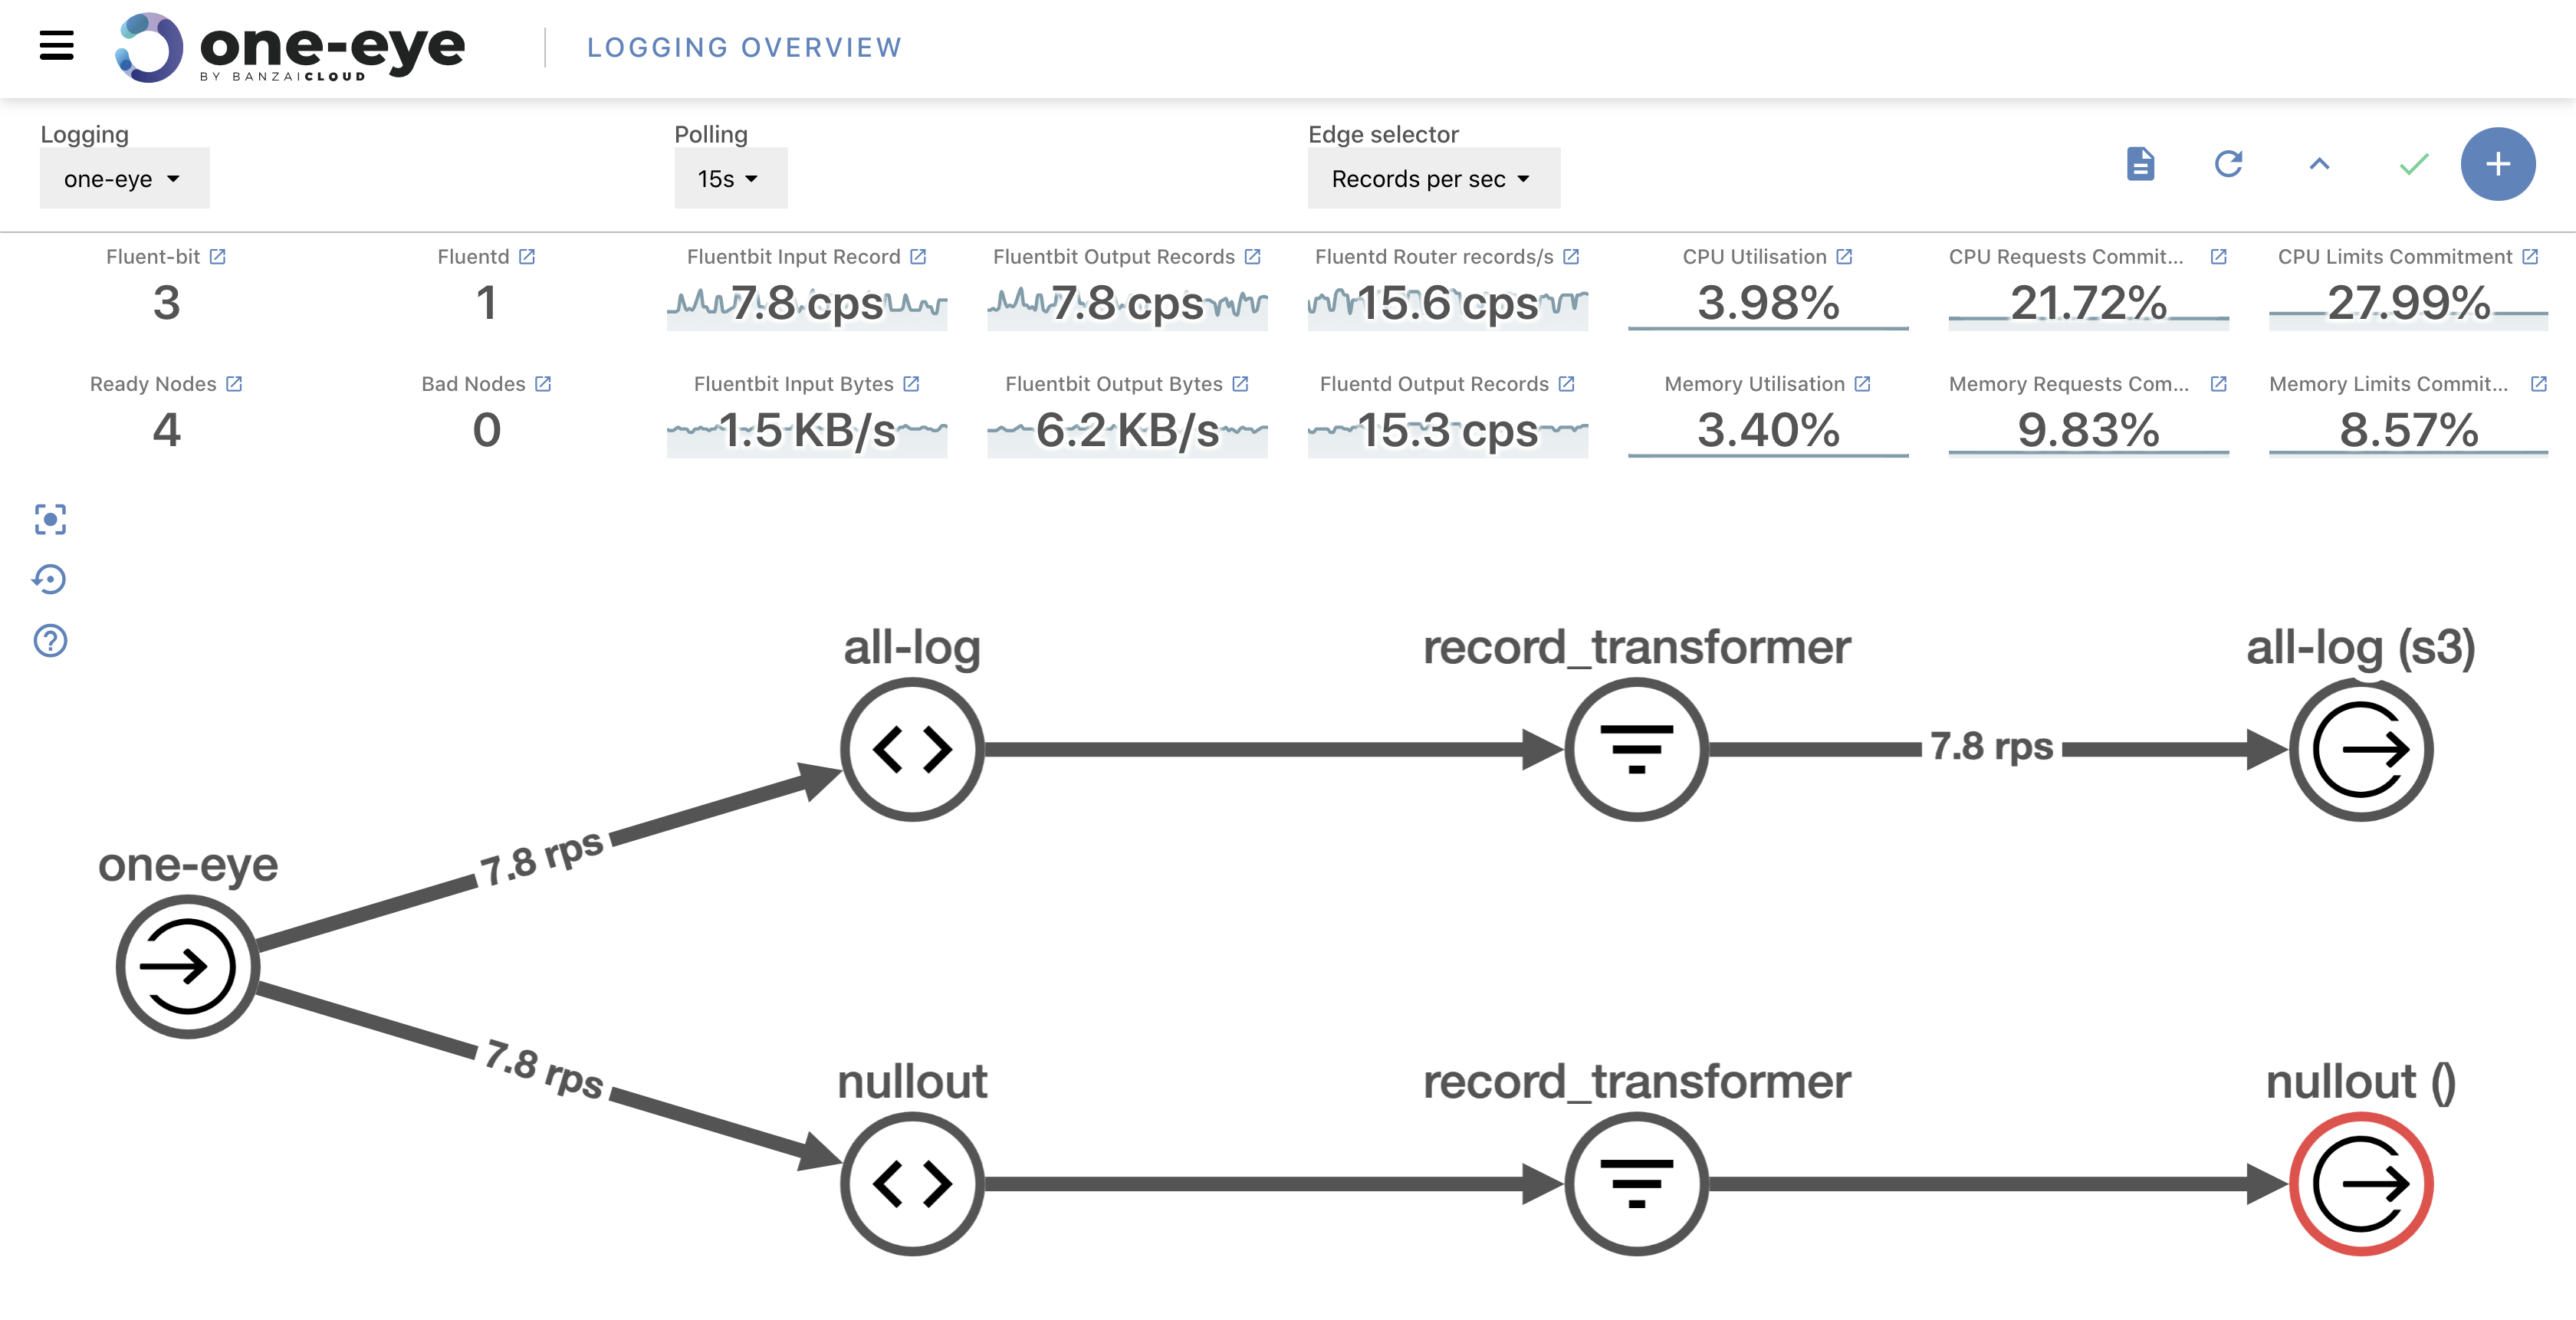
After opening the UI we get an overview of our logging architecture. In the center, you’ll see where you can track the logging flow from its source until it ends. In the header, you can configure polling and select which kind of metrics you want to see on the graph’s axes. Choosing between log rates and total count of logs helps debug both high and low traffic connections. Below, you’ll find your cluster’s logging and system-related metrics. The main purpose of this readout is to ensure that logging configuration is consistent.
One Eye has a special fluentd deployment enriched with even more than the metrics provided via the basic Logging Operator version. This enables us to track specific flow metrics and allows us to conduct a closer investigation when an error occurs.
Check for matching pods 🔗︎
We know that starting a Logging Operator can be difficult the first time. This was one of the many considerations that influenced our decision to visualize the logging flow. Eventually, we went further, so that we show a Flow’s matching pods in the UI.
Flow matching makes it nearly painless to check if your match statement is working properly, and provides a shortcut redirect to the drill down menu, where you can inspect a Pod thoroughly.
Tailing logs 🔗︎
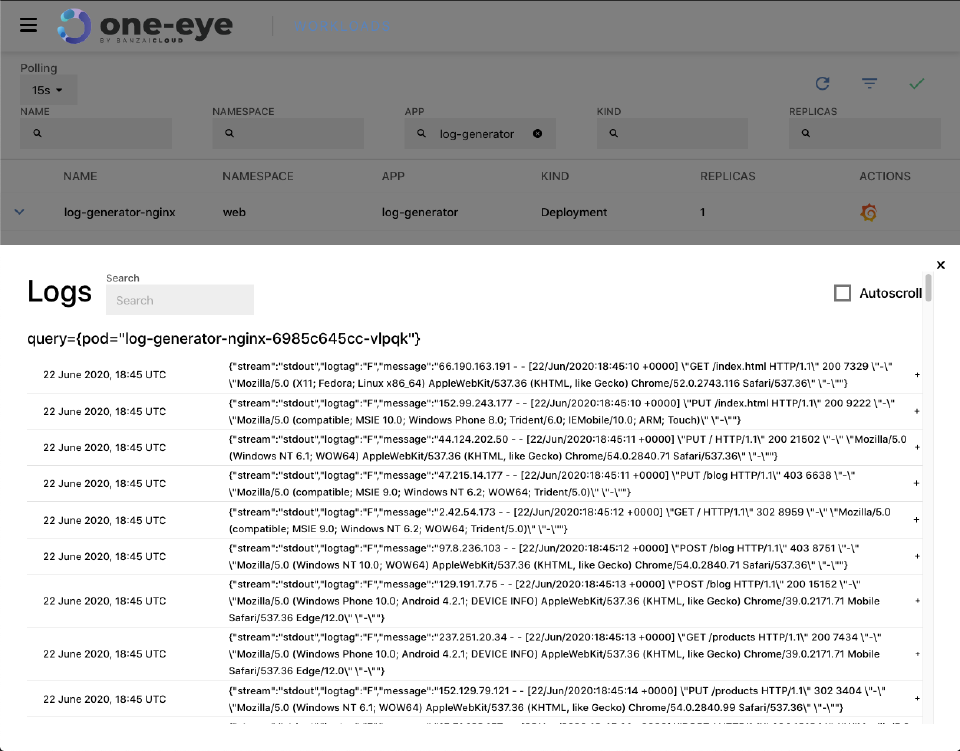
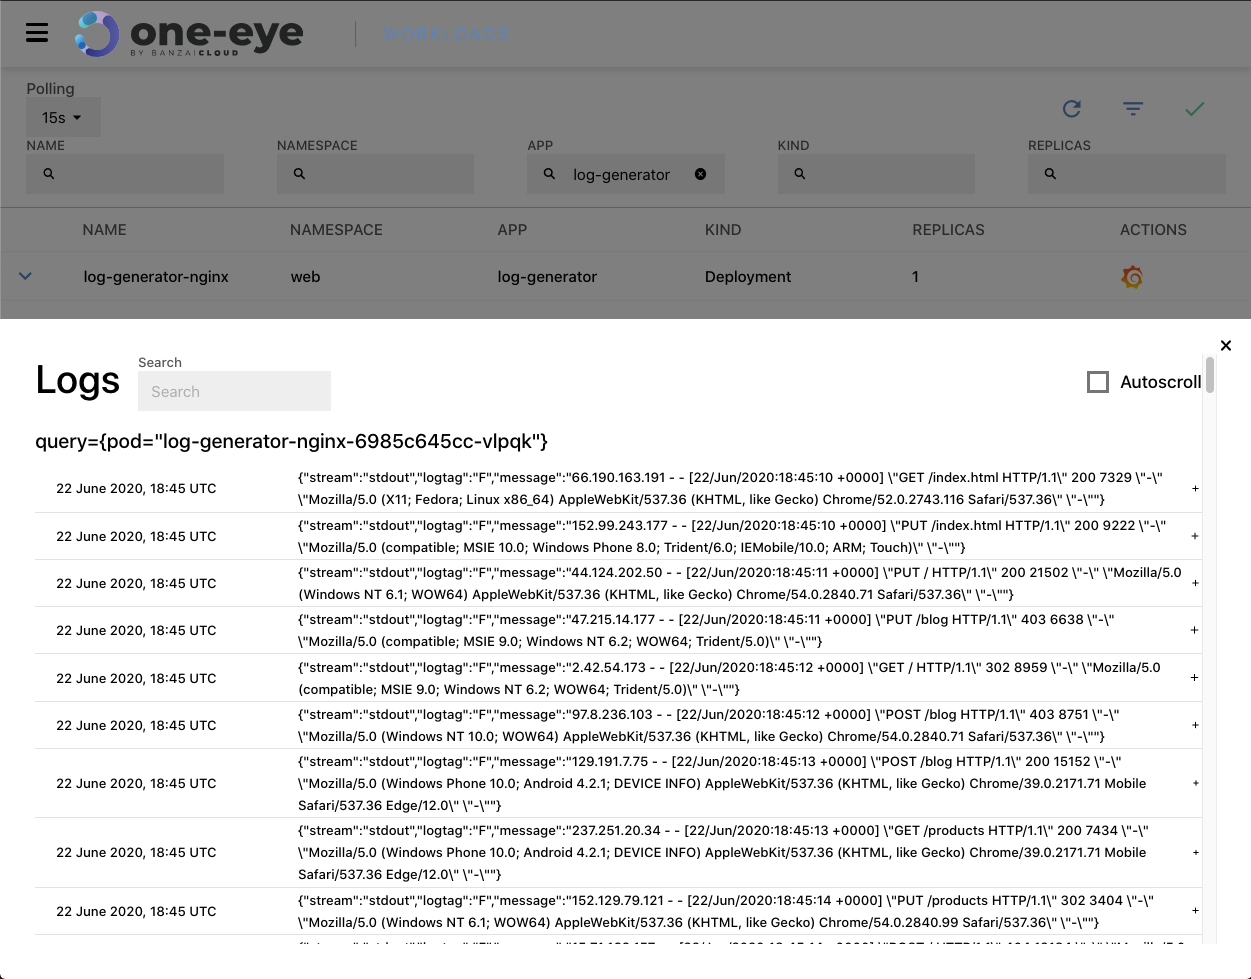
One of the main benefits of integrating Loki is that it allows us to query logs and tail them live. After navigating to a pod, a detailed view of the workload itself and of the relevant pods are shown. As you might expect, when you click the Loki logo it starts to tail the logs for the pod (or whatever query you want), live.
Tracking down problems faster 🔗︎
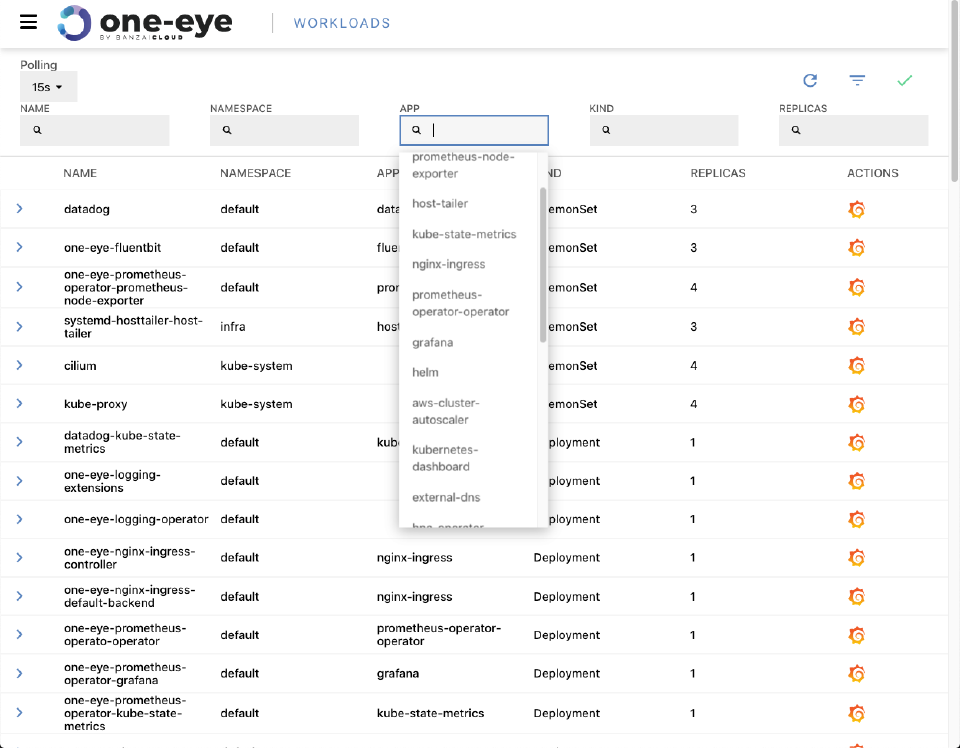
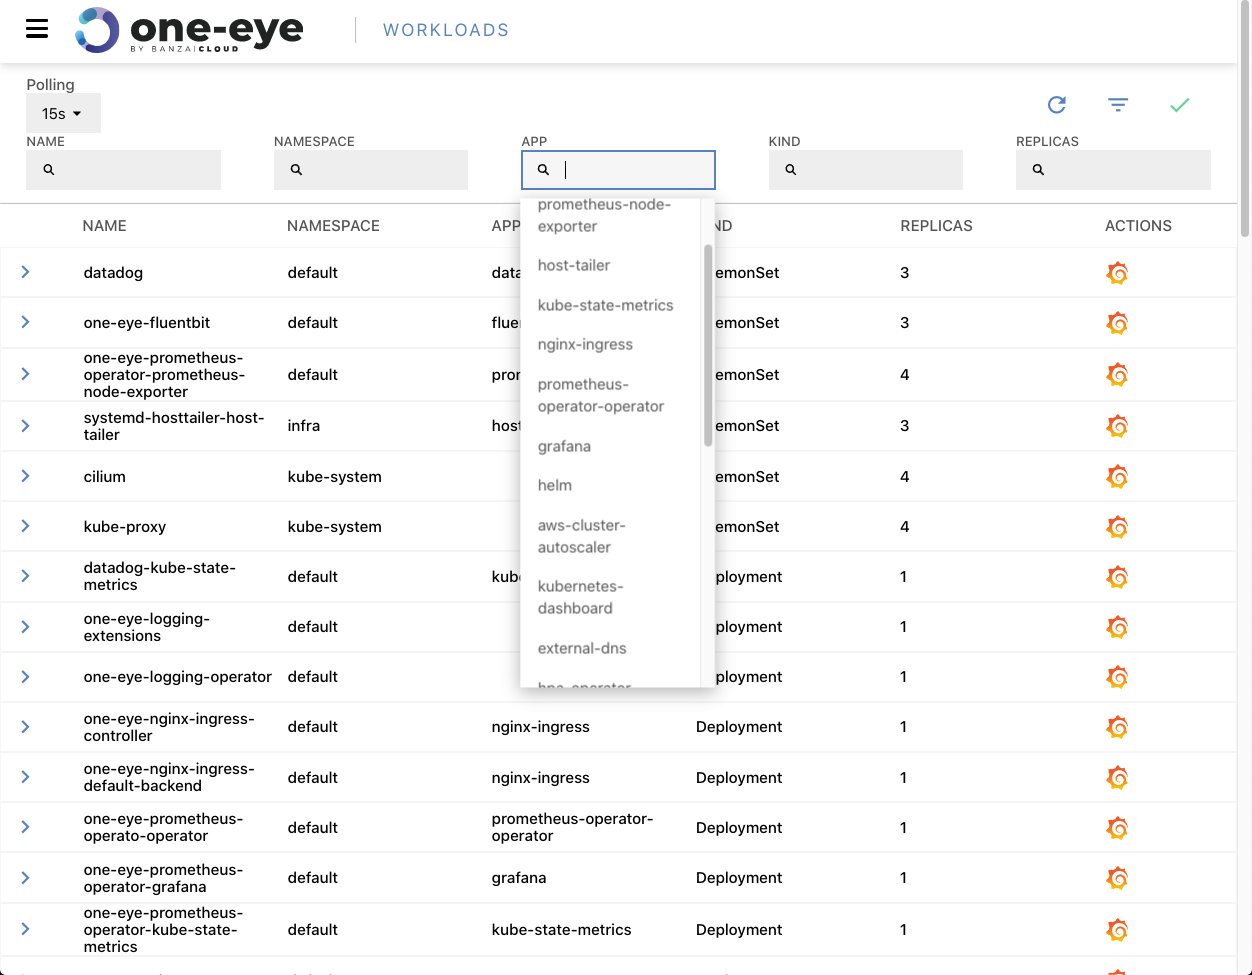
In order to more rapidly mitigate problems, One Eye collects a variety of useful information. For a better impression of that information’s breadth and scope, take a look at the drill-down view. First, it helps to filter deployments and services based on name, namespace and other attributes. These attributes will be expanded to include status, and more - based on your feedback.
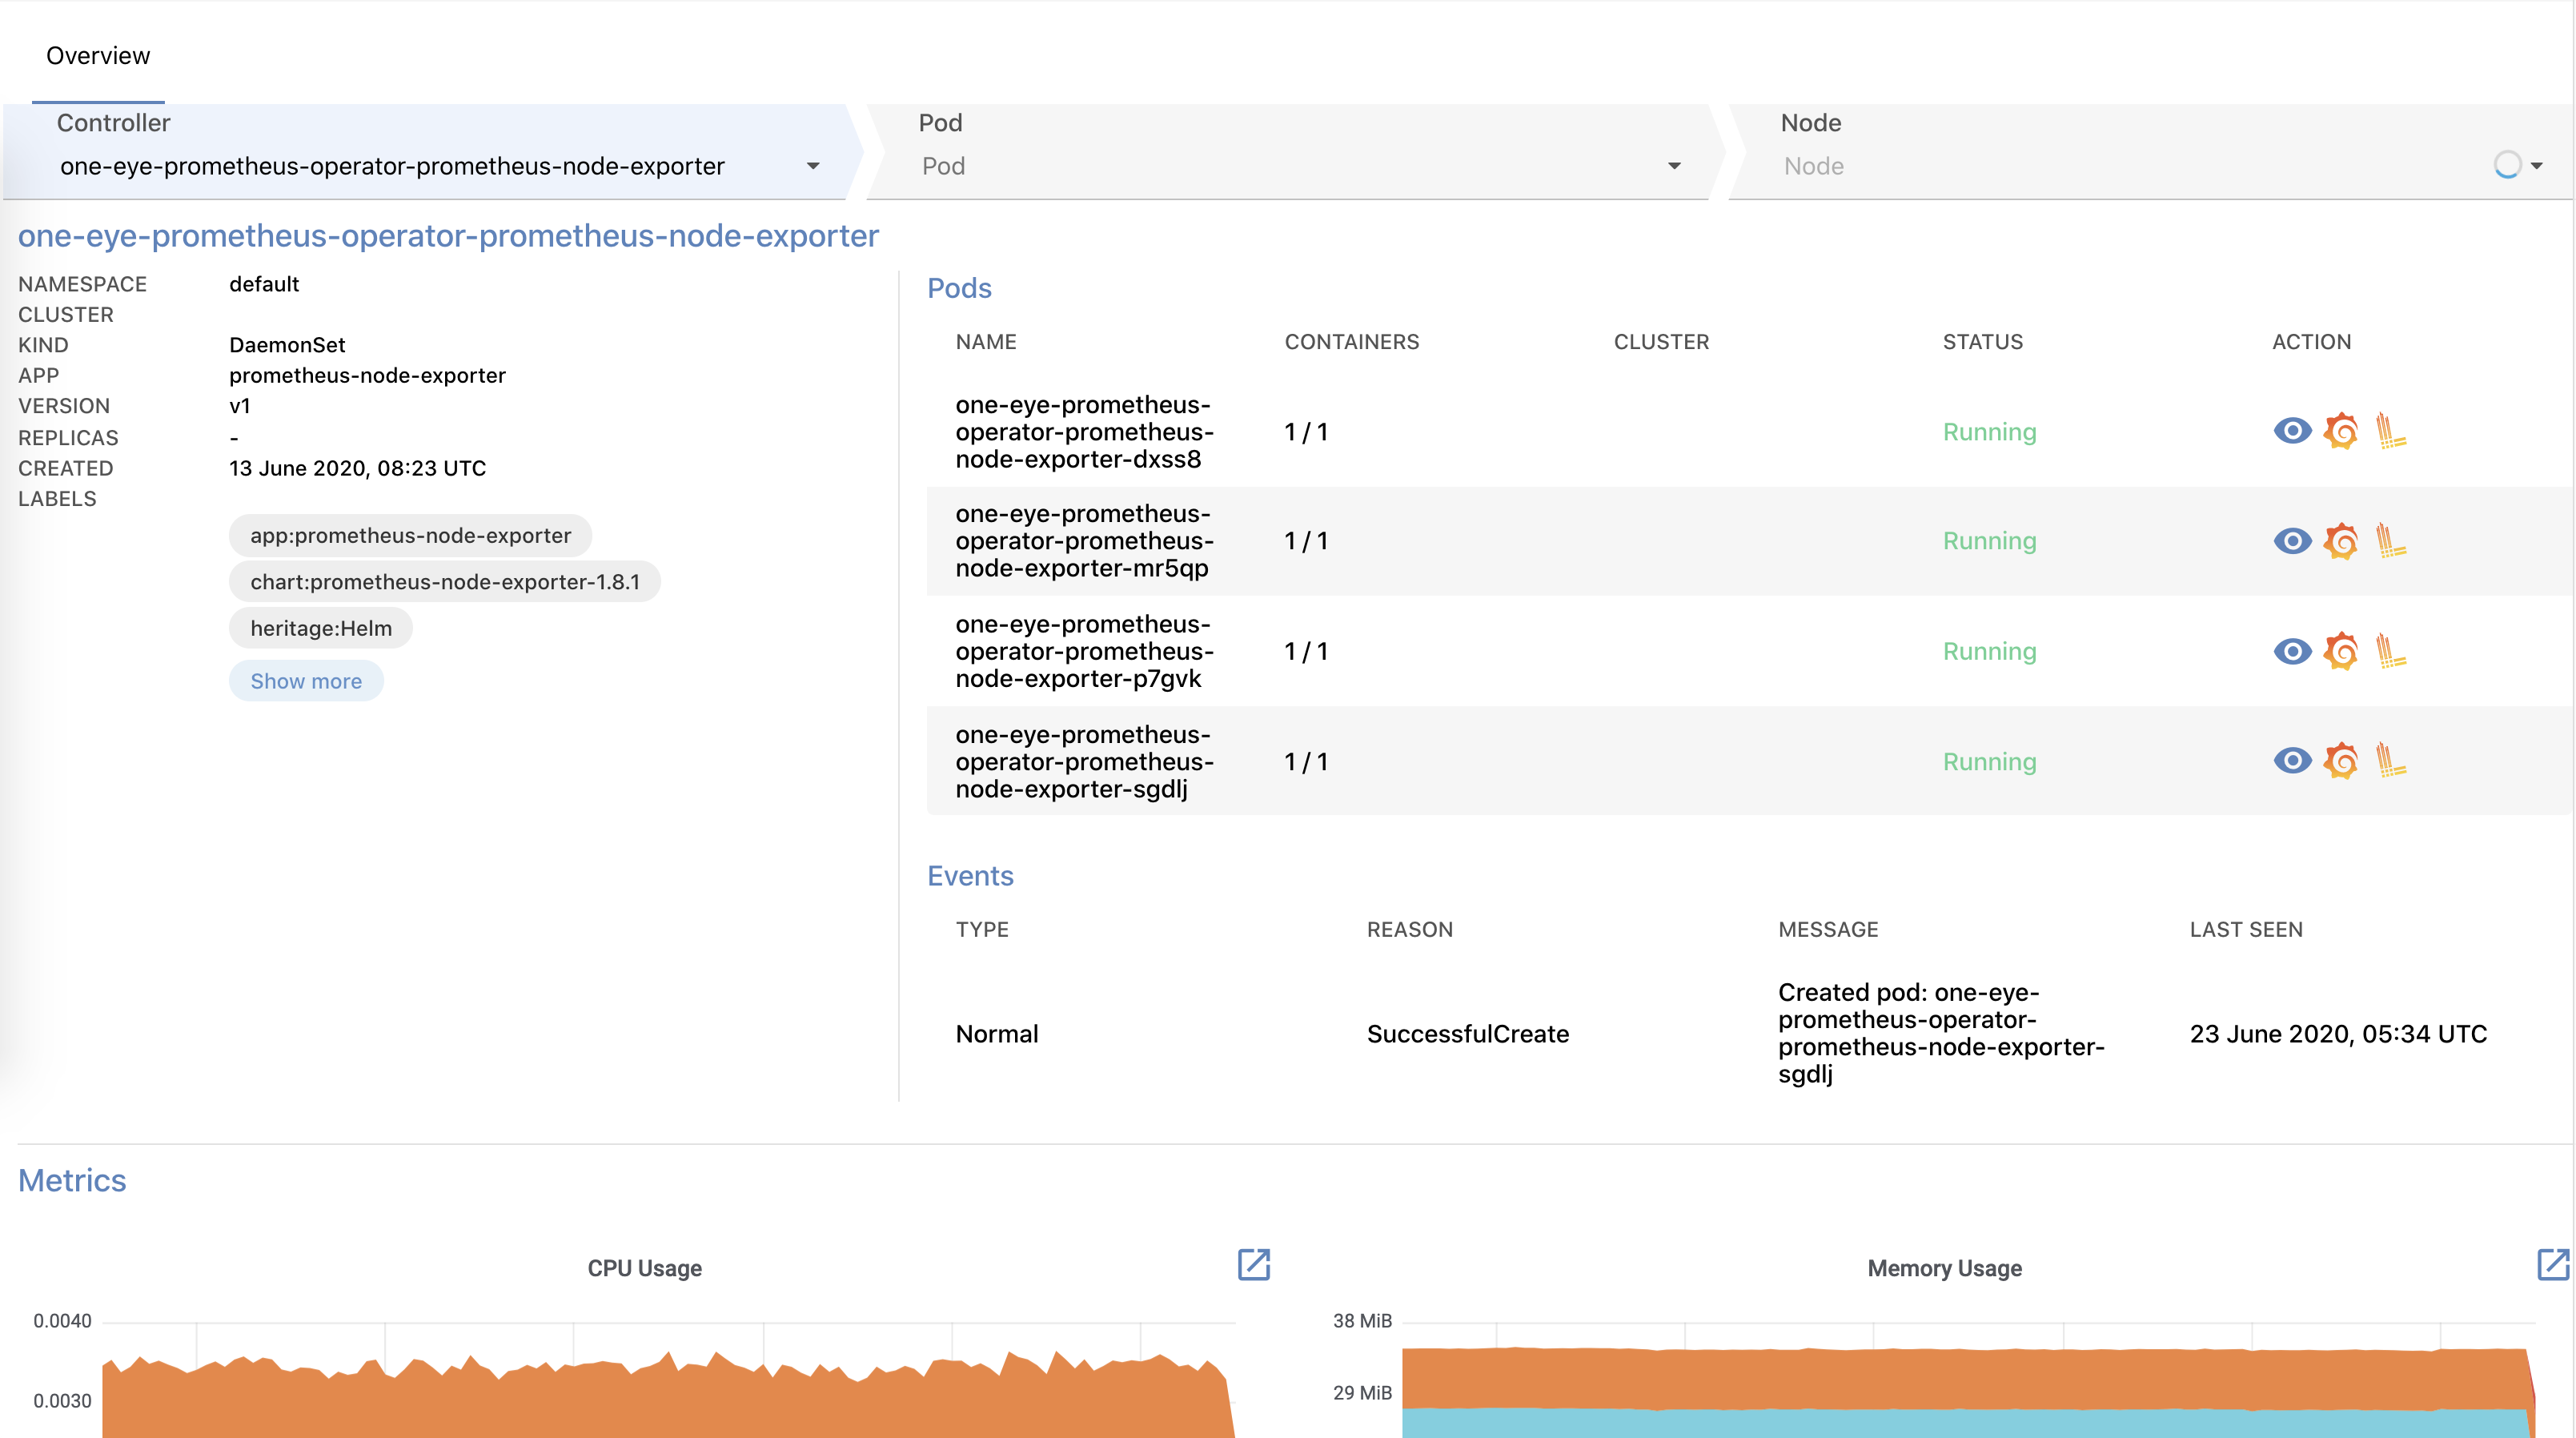
The details of a workload involve a lot of interesting data: workload relevant events, Pods managed by the workflow in question, as well as basic metrics (CPU, Memory, Network). From here you can jump straight to Grafana or tail the logs of the Pods.

The last level of drilldown is Host. If you are facing unexpected errors, they may come from the Host level, with the errors only reflecting onto your pods.
Get logs from fluentd 🔗︎
There’s a good reason why we don’t let fluentd log on the standard output. A bad configuration might easily end up in a self-perpetuating process, generating logs exponentially. To avoid this, we store fluentd logs inside the container on a special /fluentd/log/out path. To debug the logging operator successfully, the first thing you need to do is check the fluentd logs. Before One Eye, it was difficult to execute into the pod and grab those logs, but now you can easily access logs from the UI.
If you are running multiple replicas, you can select which fluentd pod you want to query.
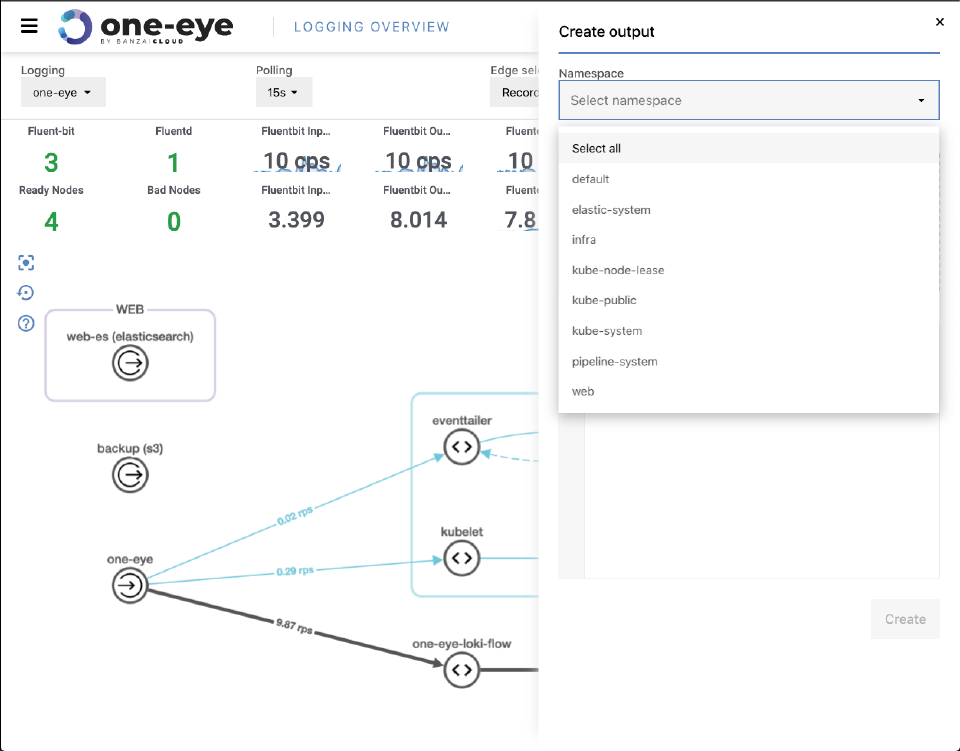
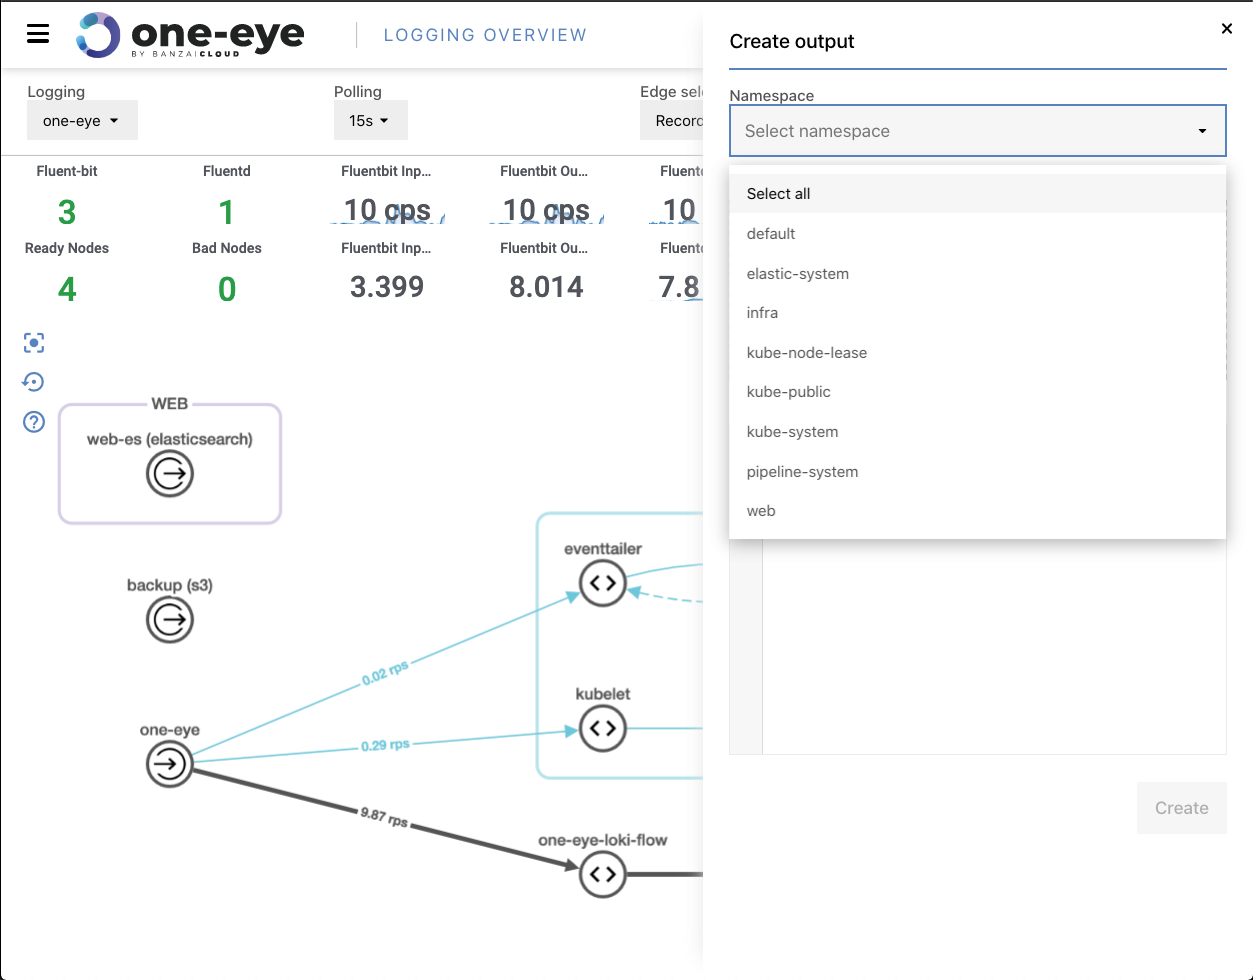
Creating Flows in the UI 🔗︎
It’s still in its early days, but it’s worth mentioning that you can create Logging, Flow and Output resources in the UI as well. For now, they are just simple YAML submitters, but in future releases it will help create and customize your logging resources.
Removing all components 🔗︎
Since we’re talking about components that ease the testing phase of resources, we should mention that we’ve introduced a removeall command. This command allows you to remove resources installed by One Eye. Be aware that it only removes installed components like operators, and won’t touch custom resources. This will help you reinstall components quickly and thoroughly, though if you want to completely remove everything, you’ll have to remove the entire CRD as well.
What’s next 🔗︎
We have a lot of thoughts about what direction we might want to extend the One Eye observability platform in. The main ones being:
Alerts 🔗︎
No observability platform is complete without incident management. Prometheus provides the functionality for basic alerts, but that can be a little rough on end users. One Eye aims to seamlessly integrate these features, both in the UI and CLI.
Update: Prometheus alerts are already available in One Eye, see Alerts.
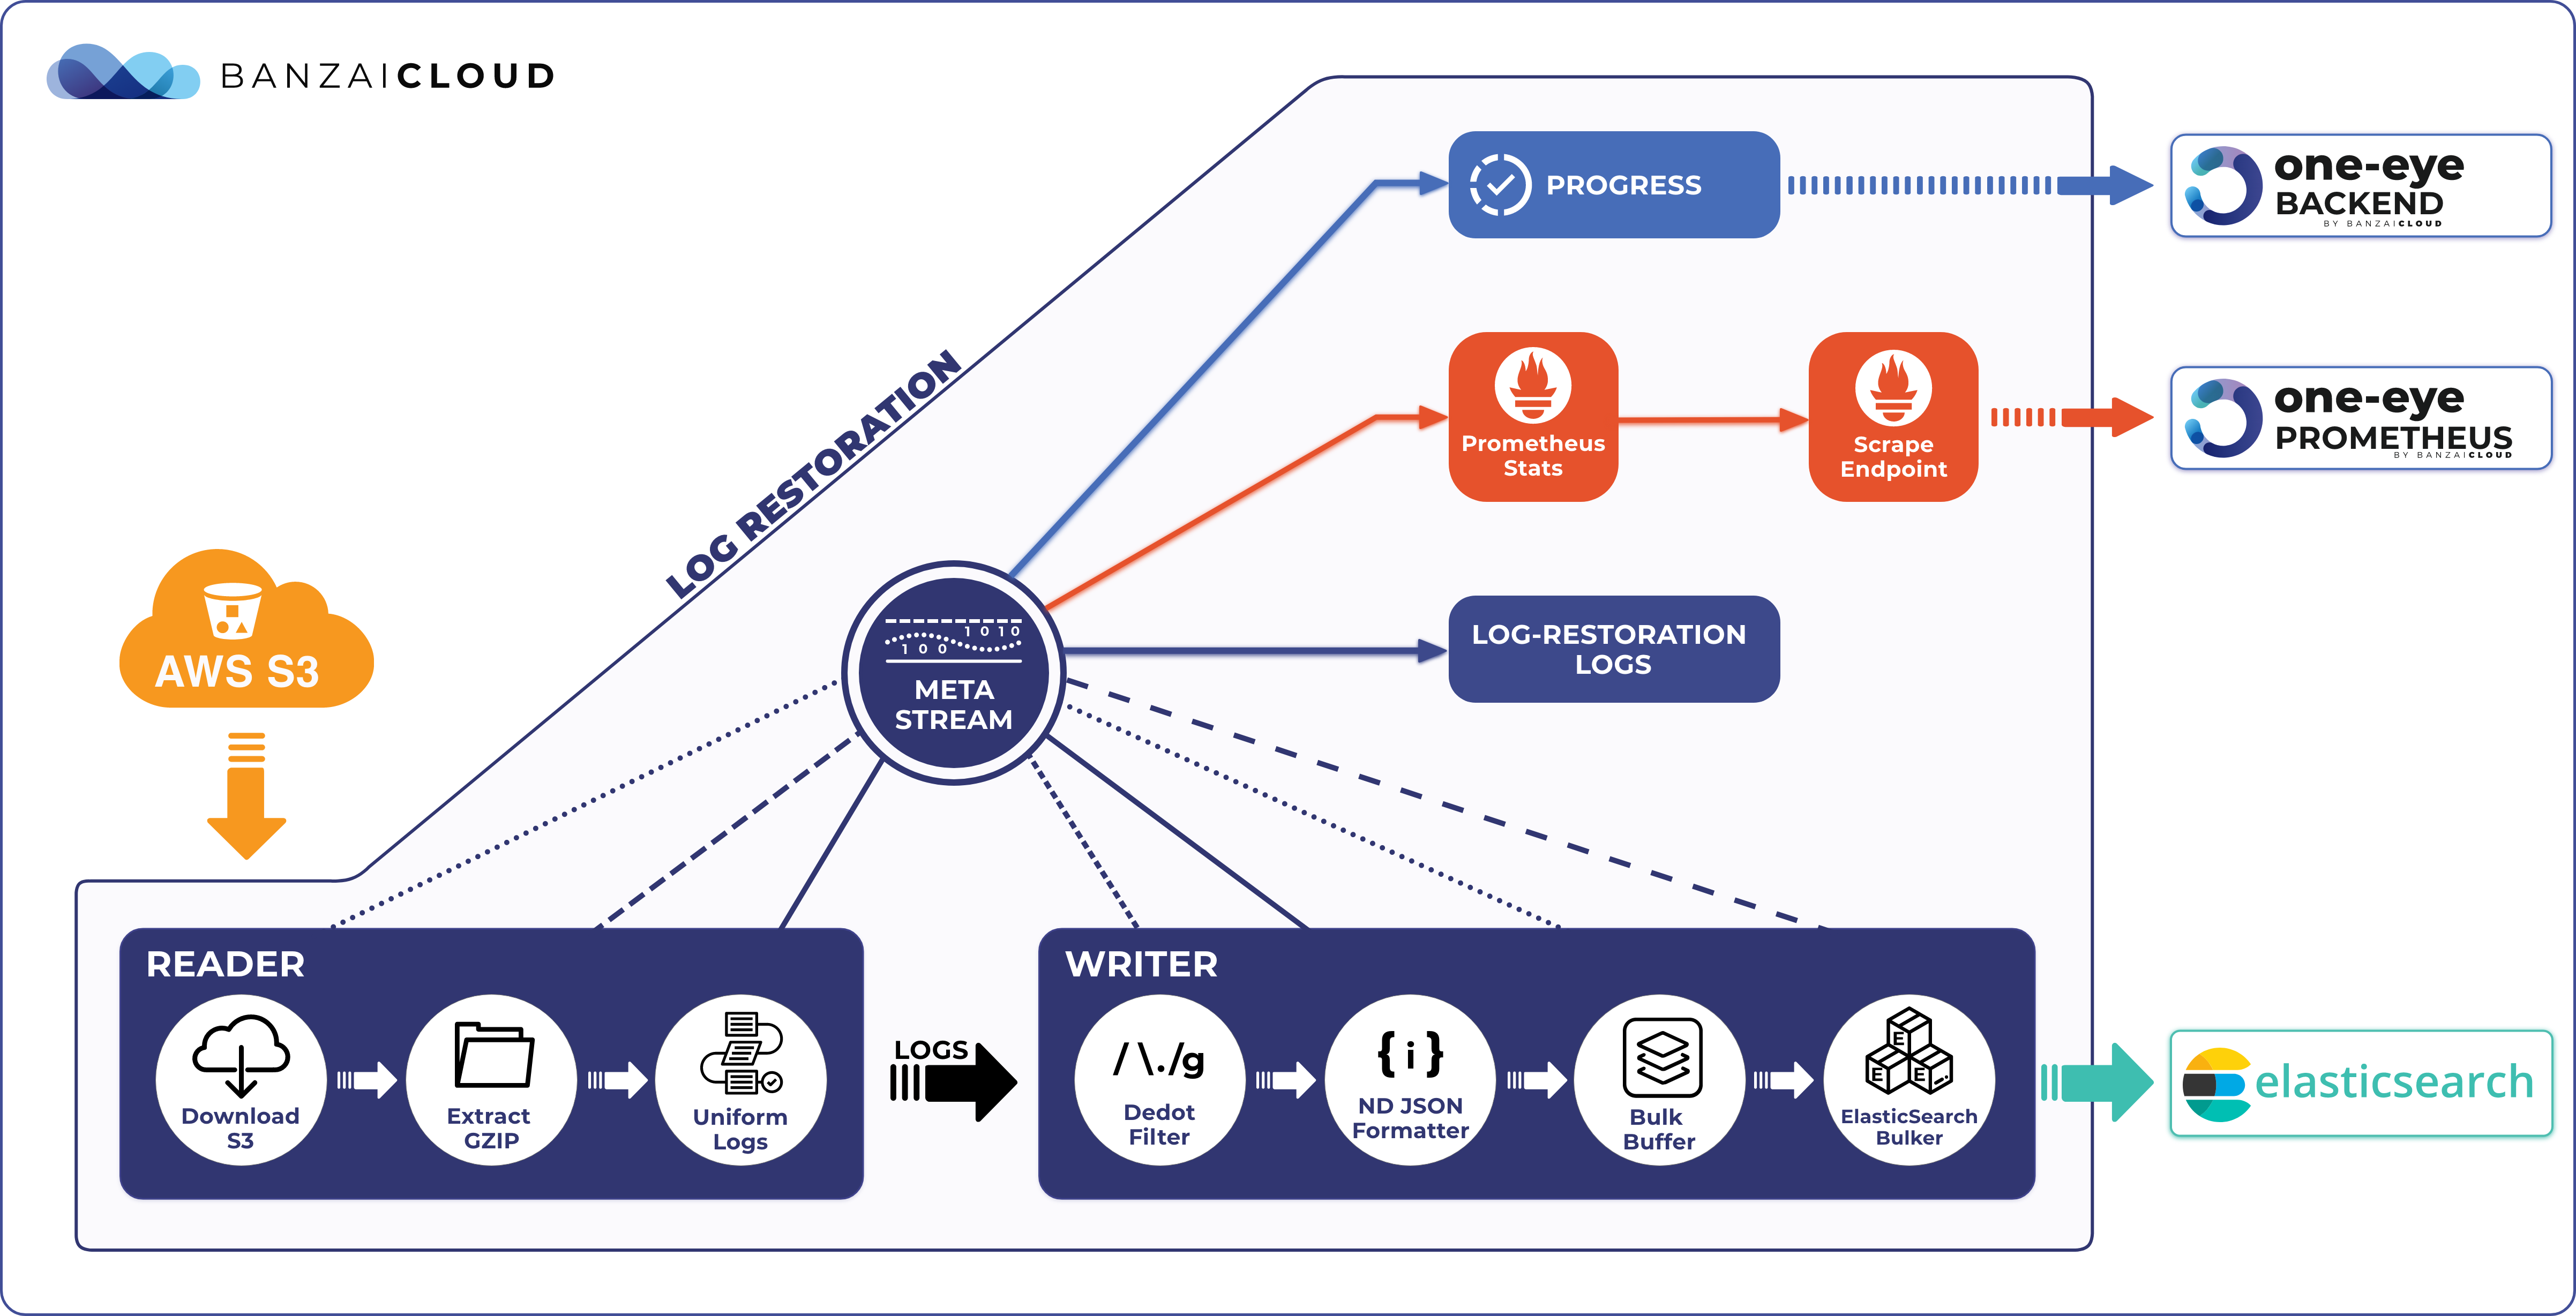
Analyse archive logs 🔗︎
We often suggest that you archive your logs in object stores. You never know what might prove useful in the future. Although cloud providers have tools to analyse cold data on their storage, there is no unified way - disregarding bare metal clusters - to analyse those logs. It is our intention that One Eye should support the loading of cold data for further analysis.
Correlation view 🔗︎
The key to resolving incidents quickly is to find their root cause as rapidly as possible. Correlation view helps us do that by representing all the relevant metric, log and tracing information.
Multi cluster 🔗︎
Currently One Eye is built to observe single clusters, however running one single cluster usually it’s not the case. Our Pipeline platform customers run multiple clusters in 5 different clouds and on-prem and they need a centralized location to collect and analyze logs and metrics. With the Banzai Cloud open source Thanos operator we already centralized metrics (logs are centralized by default with the Logging operator and the next logical step for uas is to add these integrations to One Eye.
Until next time, stay tuned!