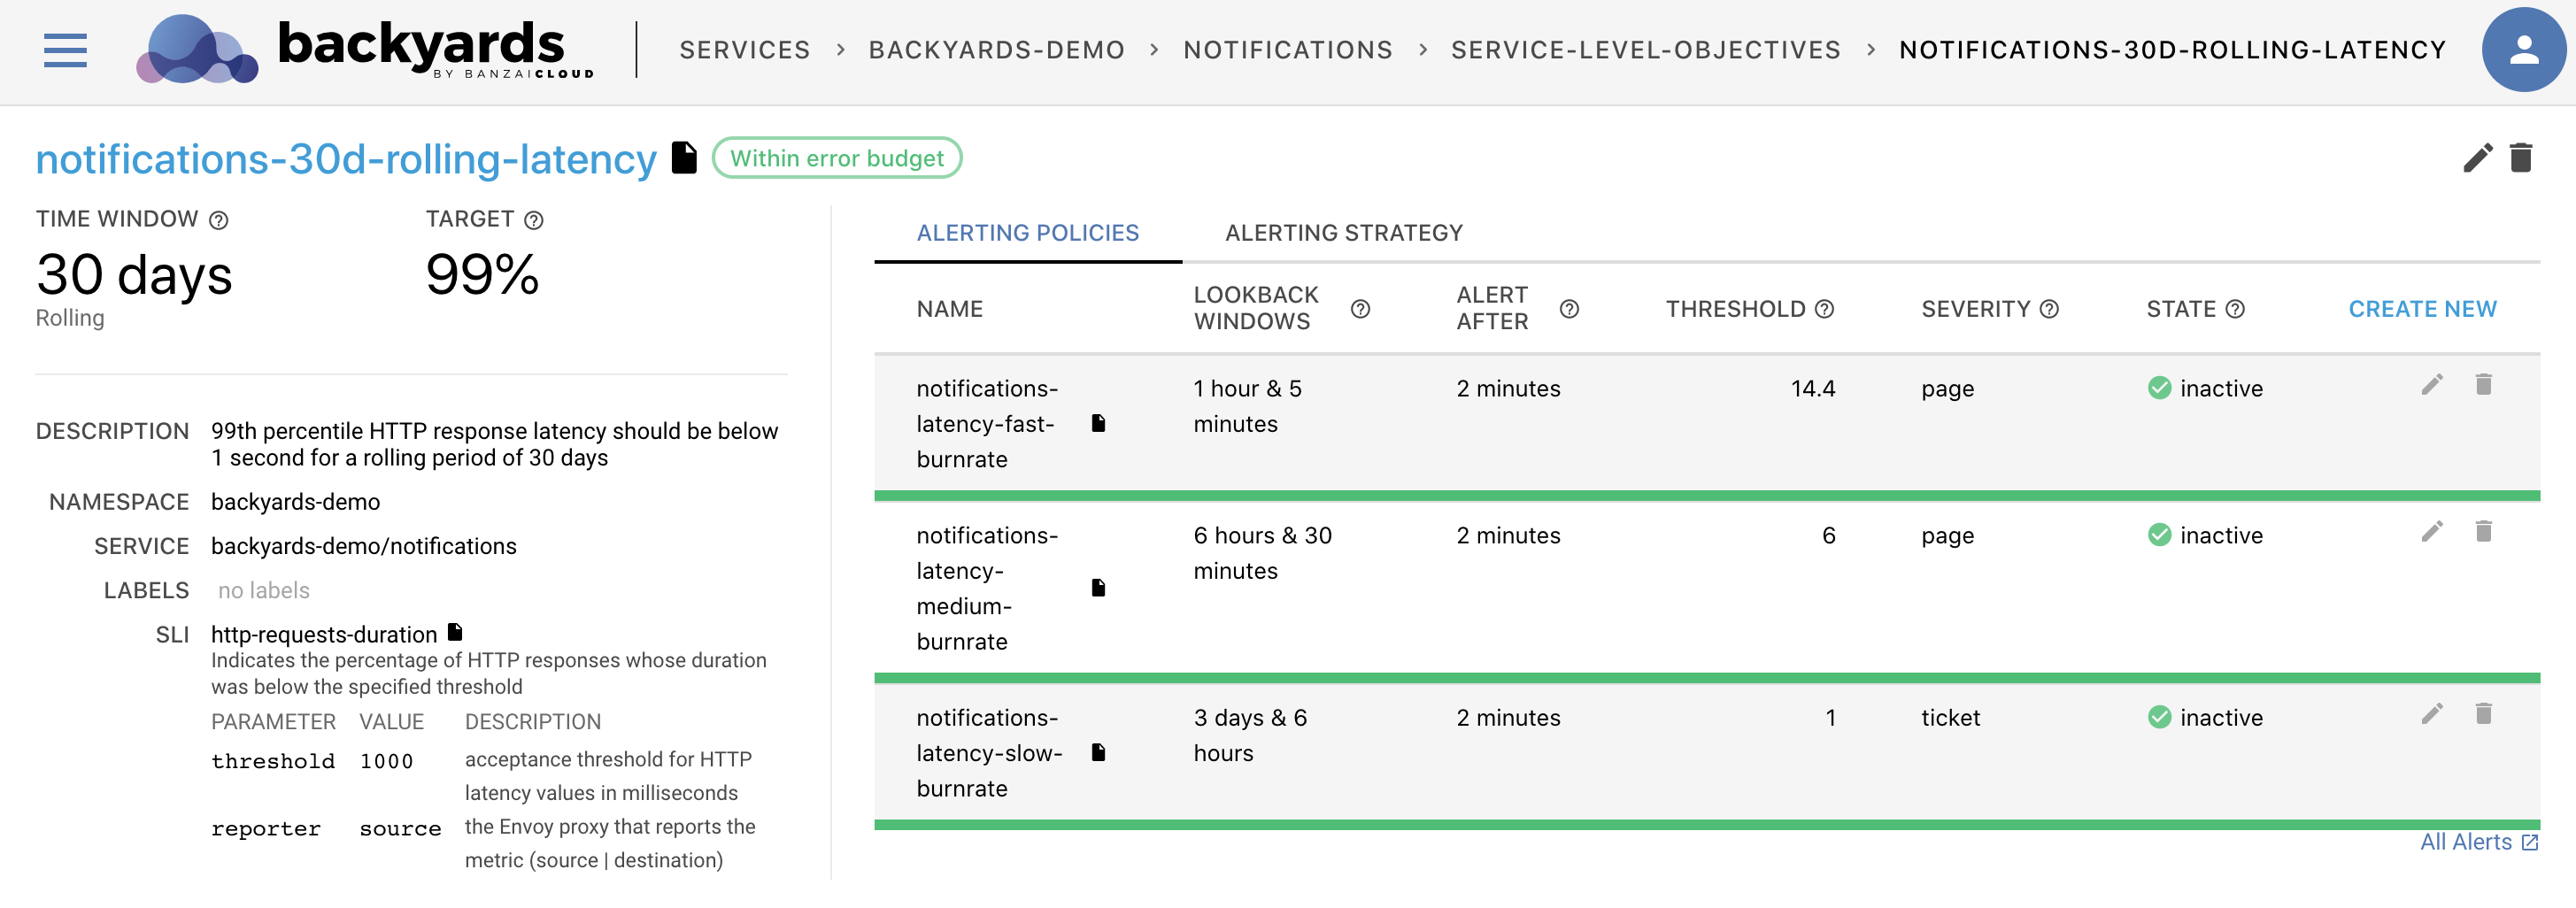
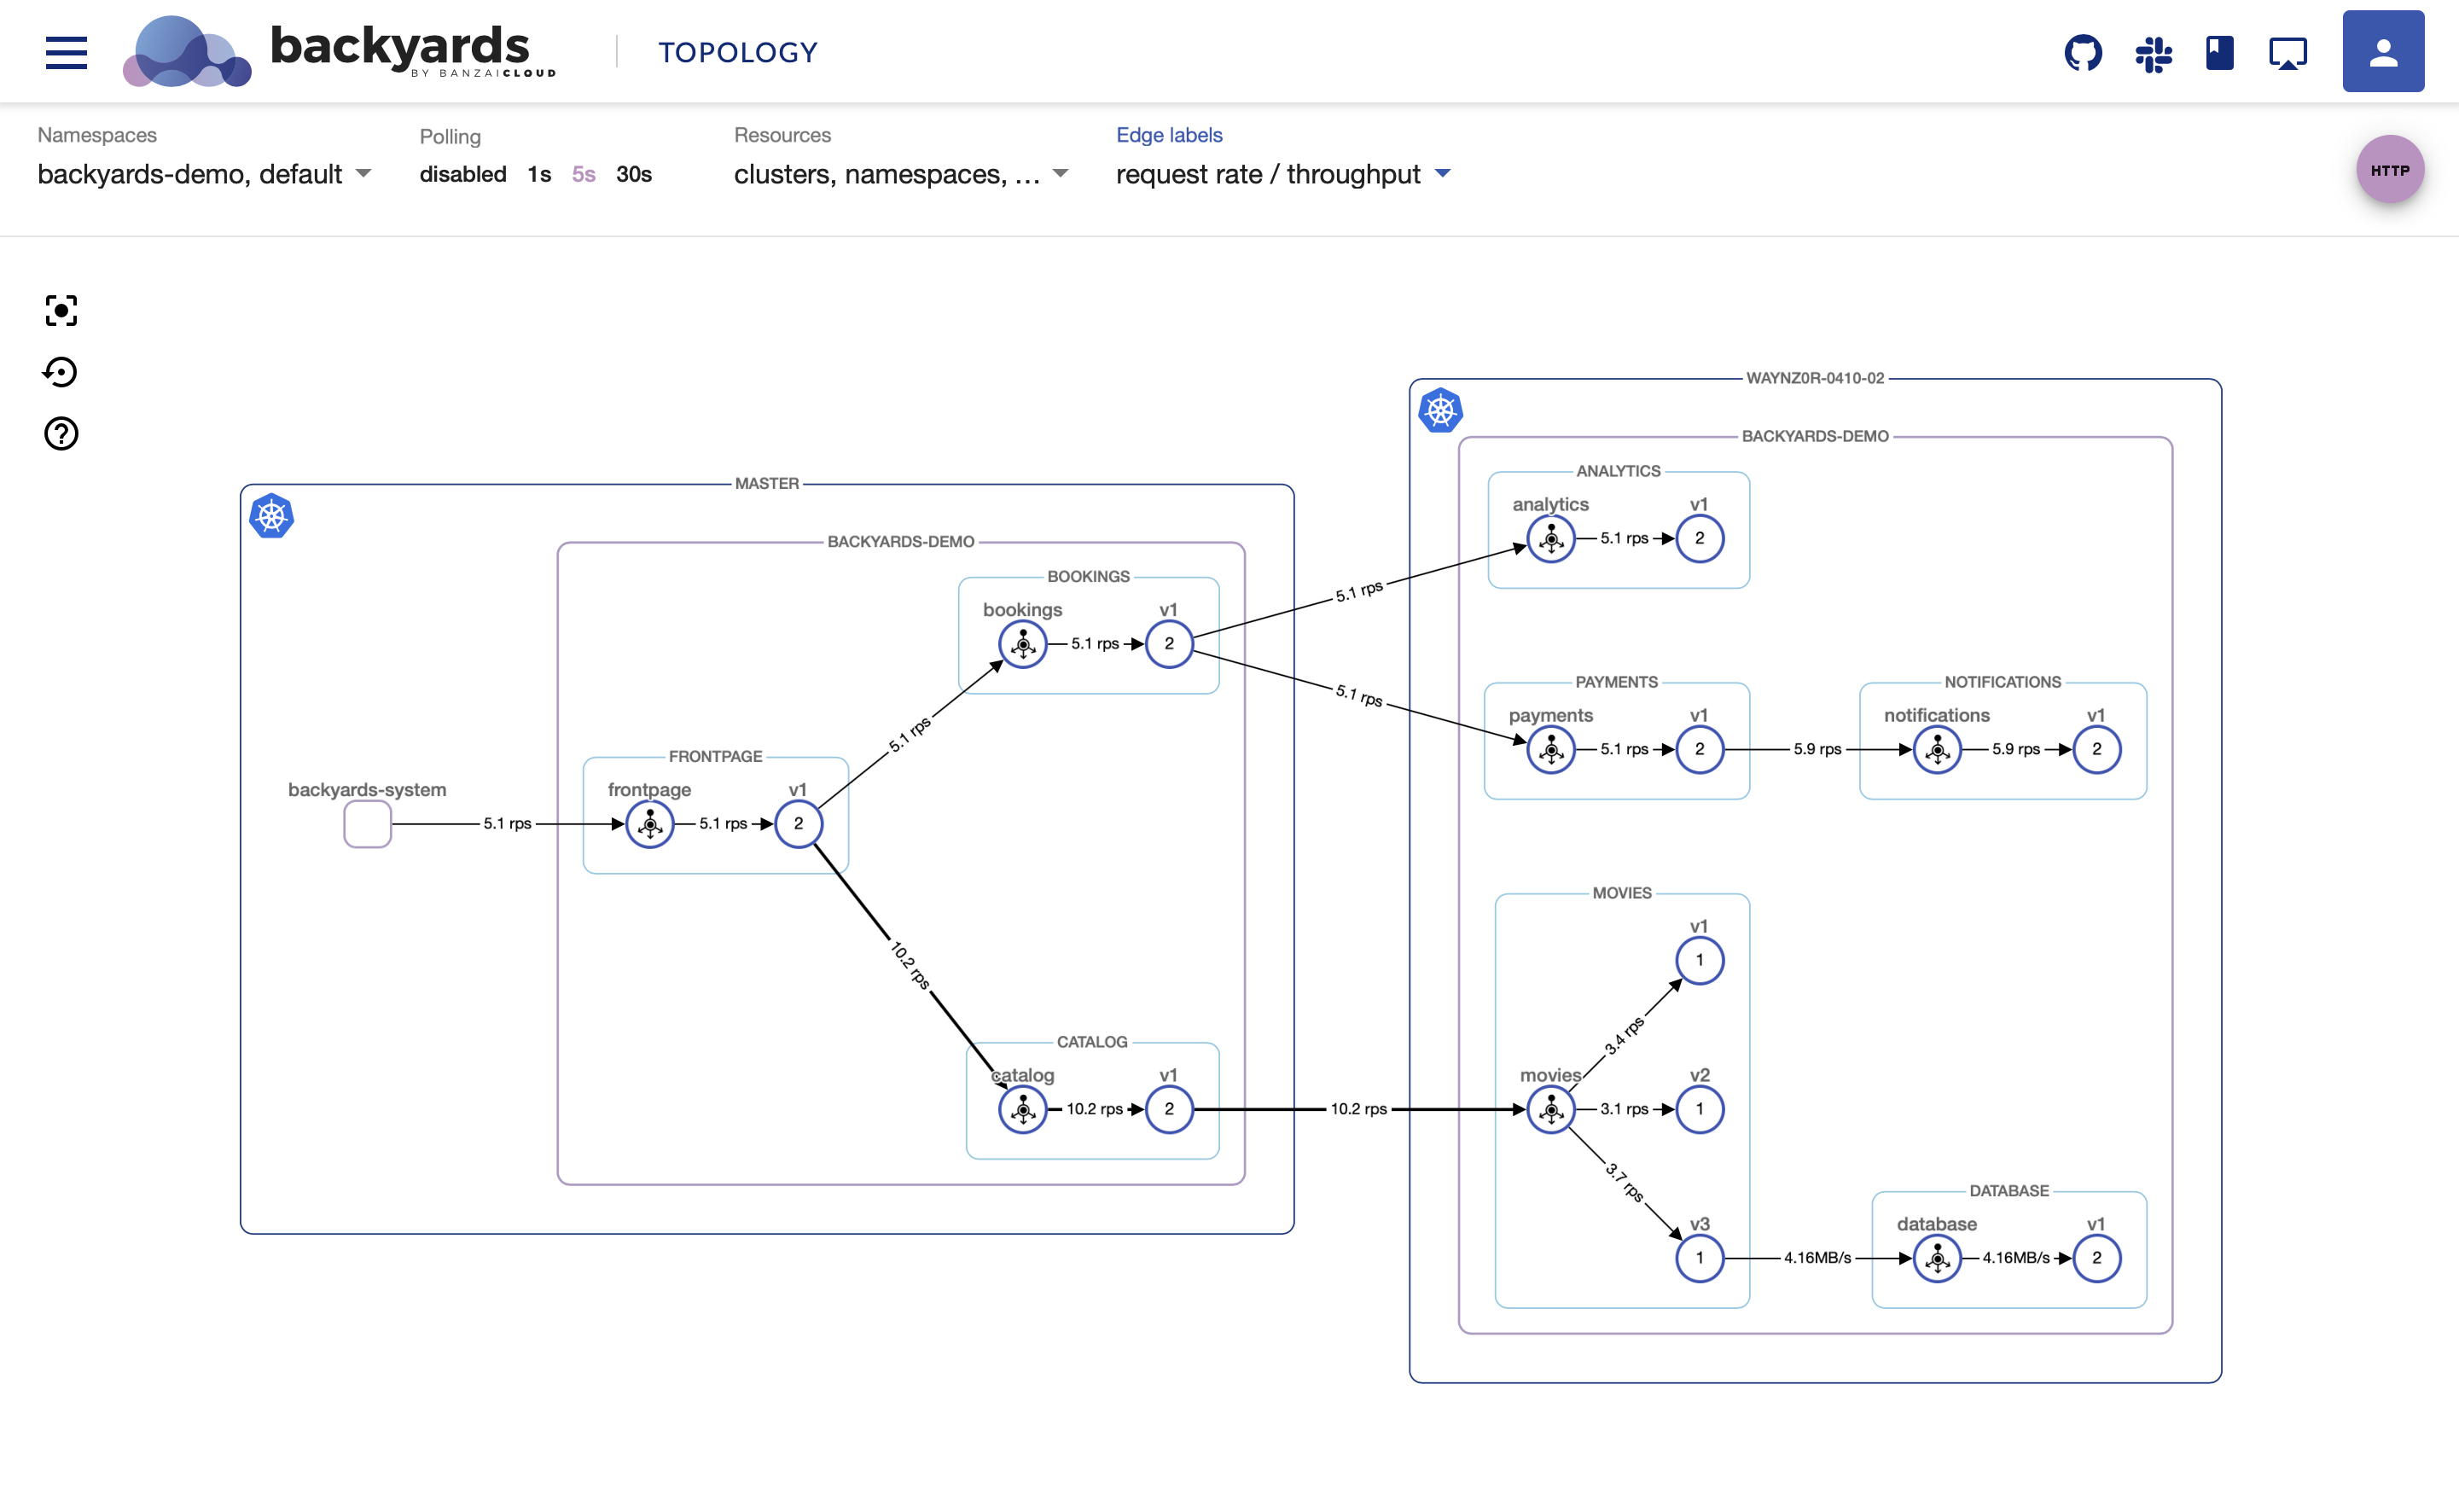
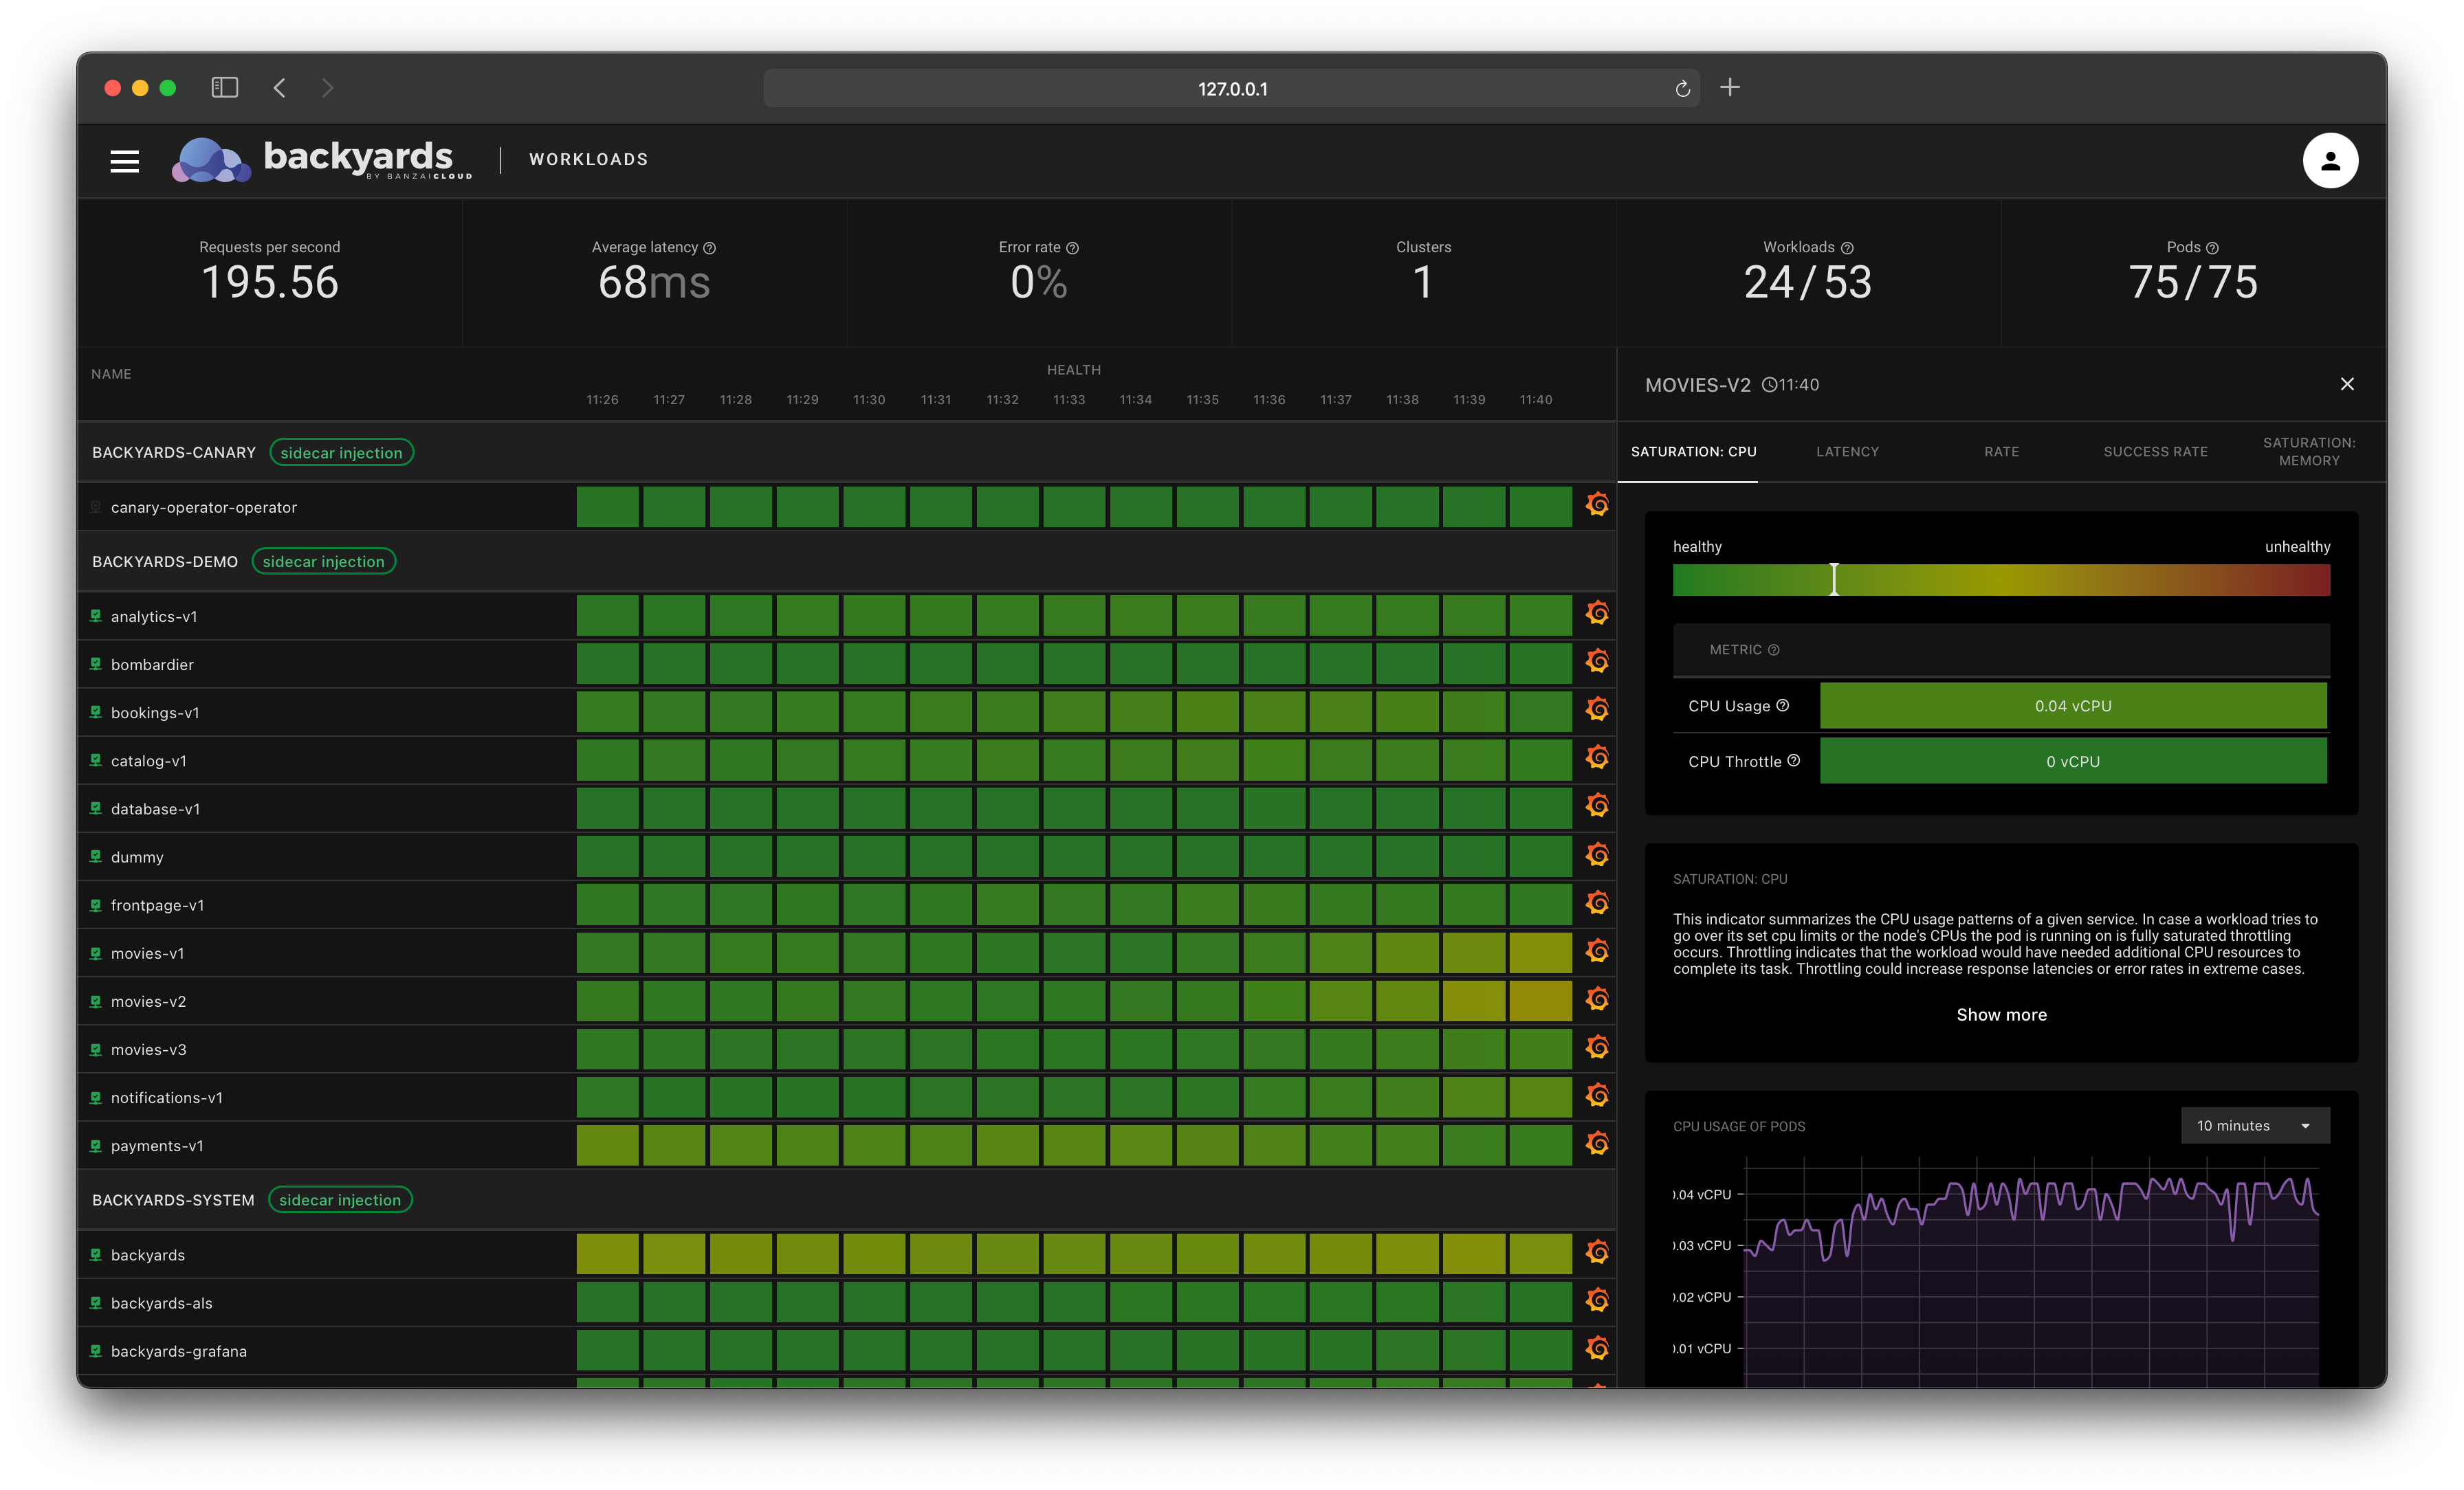
Check out Backyards in action on your own clusters!
Want to know more? Get in touch with us, or delve into the details of the latest release.
Or just take a look at some of the Istio features that Backyards automates and simplifies for you, and which we’ve already blogged about.
In production systems mostly when working in microservices architecture, it is soon realized that monitoring each service individually is often not enough to troubleshoot complex issues. It becomes a necessity to have a full picture of the whole call stack through the entire application with detailed information on service topologies, network latencies and individual request durations. This is usually where distributed tracing comes to the rescue.
In this post, the concept of distributed tracing will be introduced in microservices architecture. It will be shown how it is integrated and works in Istio and then how Backyards (now Cisco Service Mesh Manager) automates and simplifies the whole process.
Motivation 🔗︎
Earlier we blogged about how difficult it can be to simply install and manage Istio which is why we open-sourced the Banzai Cloud Istio operator to ease this pain. Although with Helm, a few handy tools can be installed besides Istio, e.g. Prometheus, Grafana, Jaeger and Kiali and we received quite a few requests to support installing/managing these components from the operator as well. Nevertheless, we believe in the separation of concerns so we did not add them to the operator directly, rather we enabled the possibility to easily integrate these components with the operator.
Of course, we wanted to give a powerful tool to our users where they can have these components on their clusters besides Istio, that is why we created Backyards (now Cisco Service Mesh Manager). With Backyards, Prometheus, Grafana and Jaeger can be easily installed and as you will see, Backyards (in constrast to Kiali) is not just a web-based UI built for observability, but is a feature rich management tool for your service mesh, is single- and multi-cluster compatible, and is possessed of a powerful CLI and GraphQL API.
In this blog, let’s concentrate on distributed tracing and Jaeger.
Distributed tracing introduction 🔗︎
In microservices architecture when multiple services call each other, it is often not straightforward to debug issues. It should be detected as what is a root cause of an issue, why is there poor performance of a request, which service is the bottleneck in a call stack, how much is the network latency between requests?
With distributed tracing in place it is possible to visualize full call stacks, to see which service called which service, how long each call took and how much were the network latencies between them. It is possible to tell where a request failed or which service took too much time to respond.
Distributed tracing is the process of tracking individual requests throughout their whole call stack in the system.
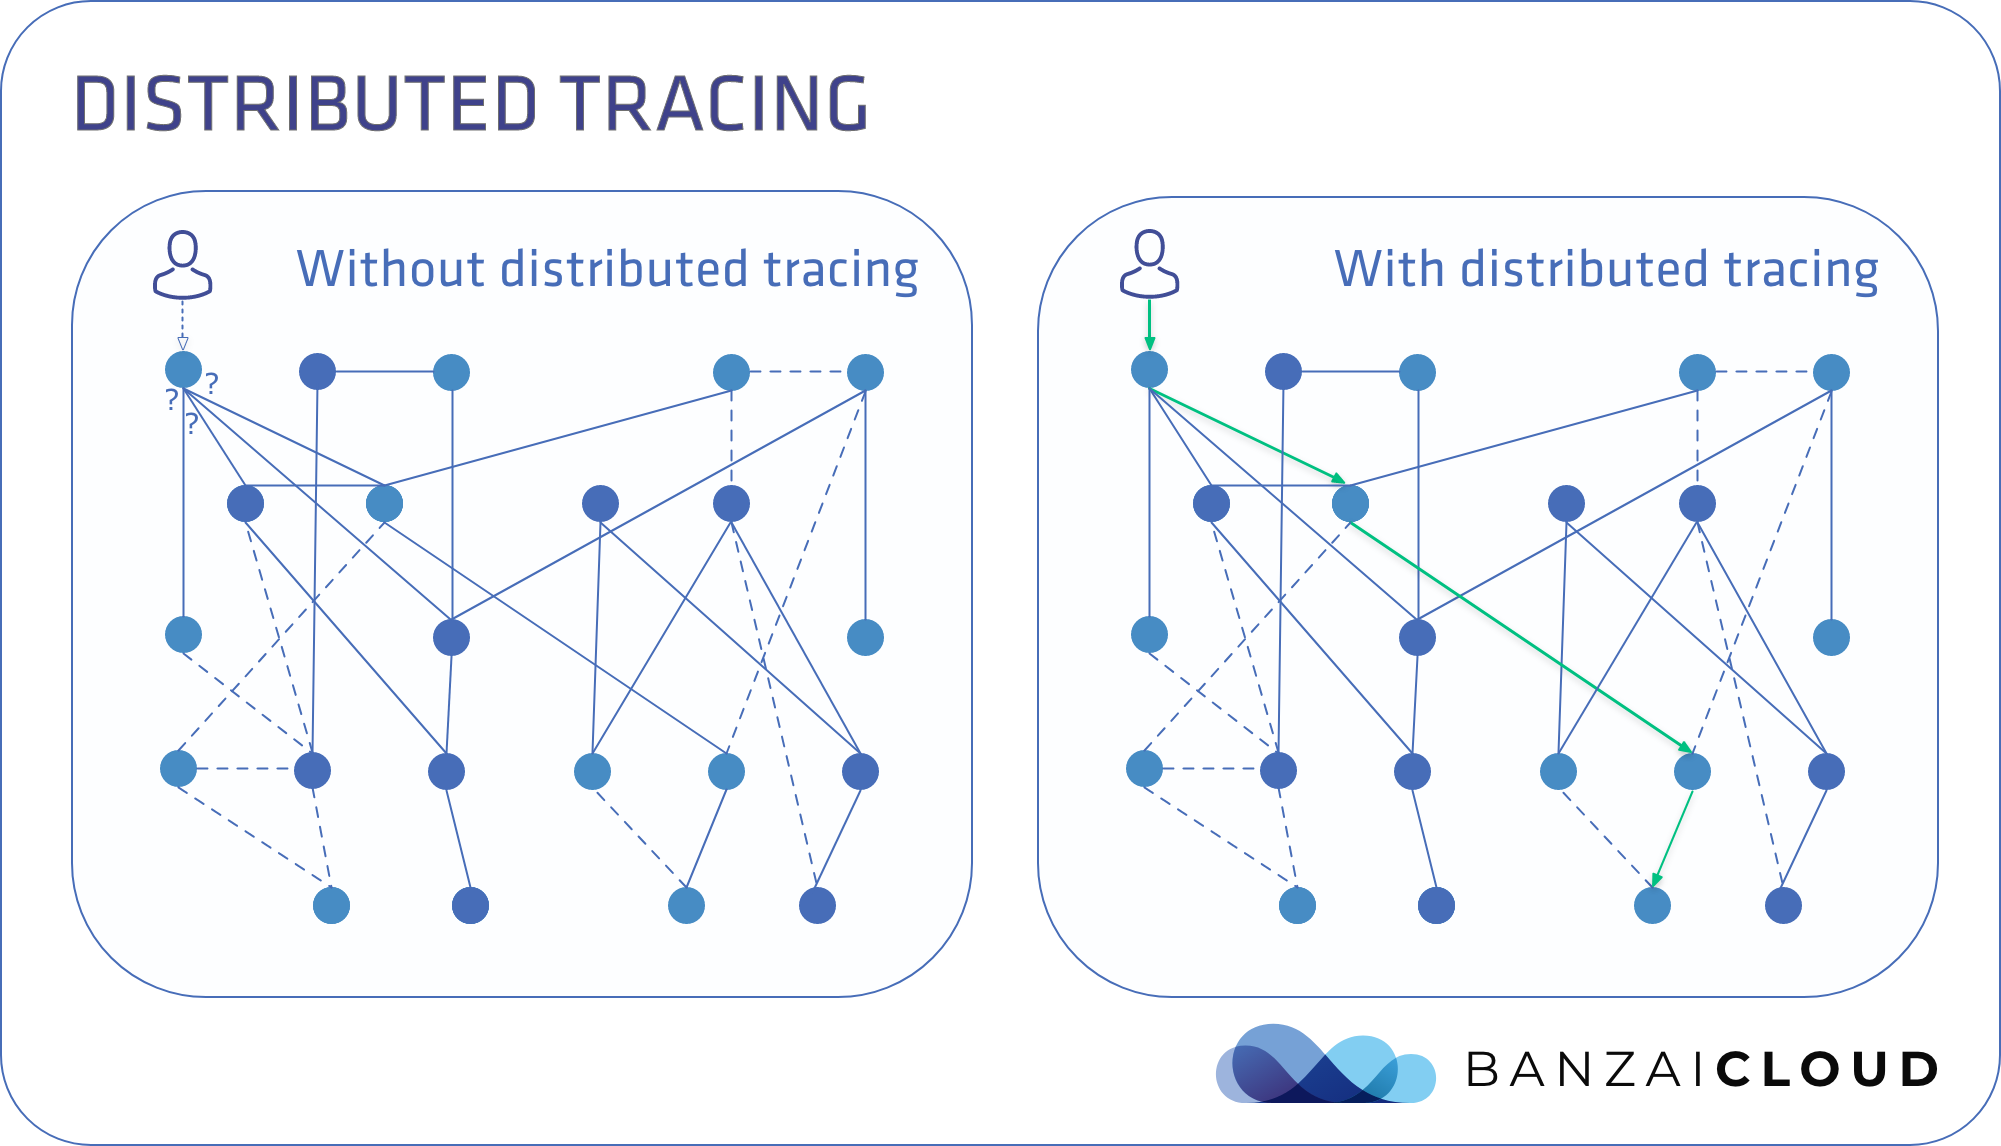
Without distributed tracing it is really easy to get lost between the numerous number of calls between microservices. It is also hard to debug issues only from the logs. With distributed tracing the whole call stack is available with all the necessary information to spot outliers.
Distributed tracing under the hood 🔗︎
A span is the smallest unit in distributed tracing which has a start timestamp and a duration. Spans are in parent-child relationship with each other and they make up for a trace.
There are three tasks to do to be able to assemble proper traces:
Incoming request spansOutgoing request spansContext propagation
Incoming request spans: When a request comes in to a service it needs to be checked whether it has tracing headers. If it does not, it needs to create a root span, otherwise a child span needs to be created to continue the trace.
Outgoing request spans: When a request is sent out from a service to a different one, then a span can be created first, and then the receiving service can continue that trace as described in the previous sentence. (Potentially, this step could be omitted.)
Context propagation: Services typically receive and send multiple requests concurrently. Without any application changes it is impossible to tell the connection between incoming and outgoing calls. This is where context propagation needs to be implemented. For HTTP it can be done by propagating the tracing headers from incoming calls to outgoing ones inside the application to be able to construct a full trace.
On top of these tasks, the traces needs to be collected, grouped together and ideally visualized as well.
All these tasks might seem quite a lot to implement for all of the services in a system, but of course there are existing tools to solve almost all of these tasks for developers automatically and get distributed tracing pretty much out-of-the box.
For more details on distributed tracing core concepts, I would recommend this great post from Nike: https://medium.com/nikeengineering/hit-the-ground-running-with-distributed-tracing-core-concepts-ff5ad47c7058
Distributed Tracing in Istio 🔗︎
In Istio, the heavy-lifting for distributed tracing is done by the Envoy sidecar proxies. In Istio where sidecar injection is enabled then all incoming and outgoing requests to a service go through the Envoy sidecar proxy first. It takes care of creating the root and child spans which are the first two out of the three tasks needed to have connected traces.
The third necessary task, context propagation, needs to be done by changing the application logic. In Istio’s Bookinfo application this is already implemented in each and every microservice, this is why full traces can be seen right away after installing it. When utilizing distributed tracing for your own services, you need to implement context propagation for yourself!
In contrast to some common misunderstanding, fully supporting distributed tracing with context propagation included, even in the service mesh layer, can only be solved by changing application logic. See e.g. Caveat 1 in Linkerd’s documentation.
It is documented on the Istio site which headers has to be propagated. These headers are compatible with the Zipkin header format.
Note that besides the Envoy-based tracing which was described above, there is a Mixer-based tracing as well in Istio that relies somewhat less on Envoy and more on the Mixer component. Mixer will probably be abandoned in future releases so we don’t introduce that one in detail. Mixerless telemetry can already be tried out easily with the operator.
With the help of Envoy and by propagating the necessary tracing headers we should be able to have our traces. To collect and visualize this information Istio comes with tools like Jaeger, Zipkin, Lightstep and Datadog. Jaeger is the default tool and so far the most popular one.
It is also possible to configure a sampling rate (what percentage of the requests will be present as traces). By default, only 1% of the traces are tracked.
The rate can be set by changing this field when using the Istio operator.
How it works in Istio 🔗︎
Let’s sum up how distributed tracing can be used with Jaeger (later this process will be compared to how it all happens in Backyards):
- With Istio, Jaeger can be installed as well with all of its necessary services and deployment
- The address of the tracing service is set by default in the configuration of the Envoy proxies so that they can report the spans regarding their sidecar services
- Bookinfo can be installed and as mentioned earlier, all of its services do header propagation for the traces
- Traces will be available after enough load is sent to the app
- The Jaeger pod can be port-forwarded (or optionally can be installed in a way that it is exposed on an ingress gateway right away) so that the UI can be opened in a browser
Distributed tracing with Backyards (now Cisco Service Mesh Manager) 🔗︎
As you will see in Backyards, Jaeger’s installation, configuration, a demo application installation with automatically propagated tracing headers and sending a load to it can all be done with one simple command! After that the links for the traces for each service are available and easily accessible from the Backyards UI.
See it in action! 🔗︎
Create a cluster 🔗︎
First of all, we’ll need a Kubernetes cluster.
I created a Kubernetes cluster on GKE via the free developer version of the Pipeline platform. If you’d like to do likewise, go ahead and create your cluster on any of the several cloud providers we support or on-premise using Pipeline. Otherwise bring your own Kubernetes cluster.
How it works in Backyards 🔗︎
Earlier we summed up how Jaeger can be used in Istio in practice, now we will compare how it’s done in Backyards.
The easiest way by far to install Istio, Backyards, and a demo application on a brand new cluster is to use the Backyards CLI.
You just need to issue one command (KUBECONFIG must be set for your cluster):
$ backyards install -a --run-demo
- Jaeger is installed automatically by default with this command (alongside Istio itself with our open-source Istio operator and the other components of Backyards)
- As it was mentioned, the Istio operator is prepared for integrating with other components like Prometheus, Grafana or Jaeger. When Jaeger is installed the address of its service is set in the operator’s Custom Resource which then triggers the operator to set this address at every place necessary in the Istio control and data plane components.
- A demo application is also installed by default. This application uses golang services which are configured to propagate the necessary tracing headers.
- Load is automatically sent to the demo application (hence the
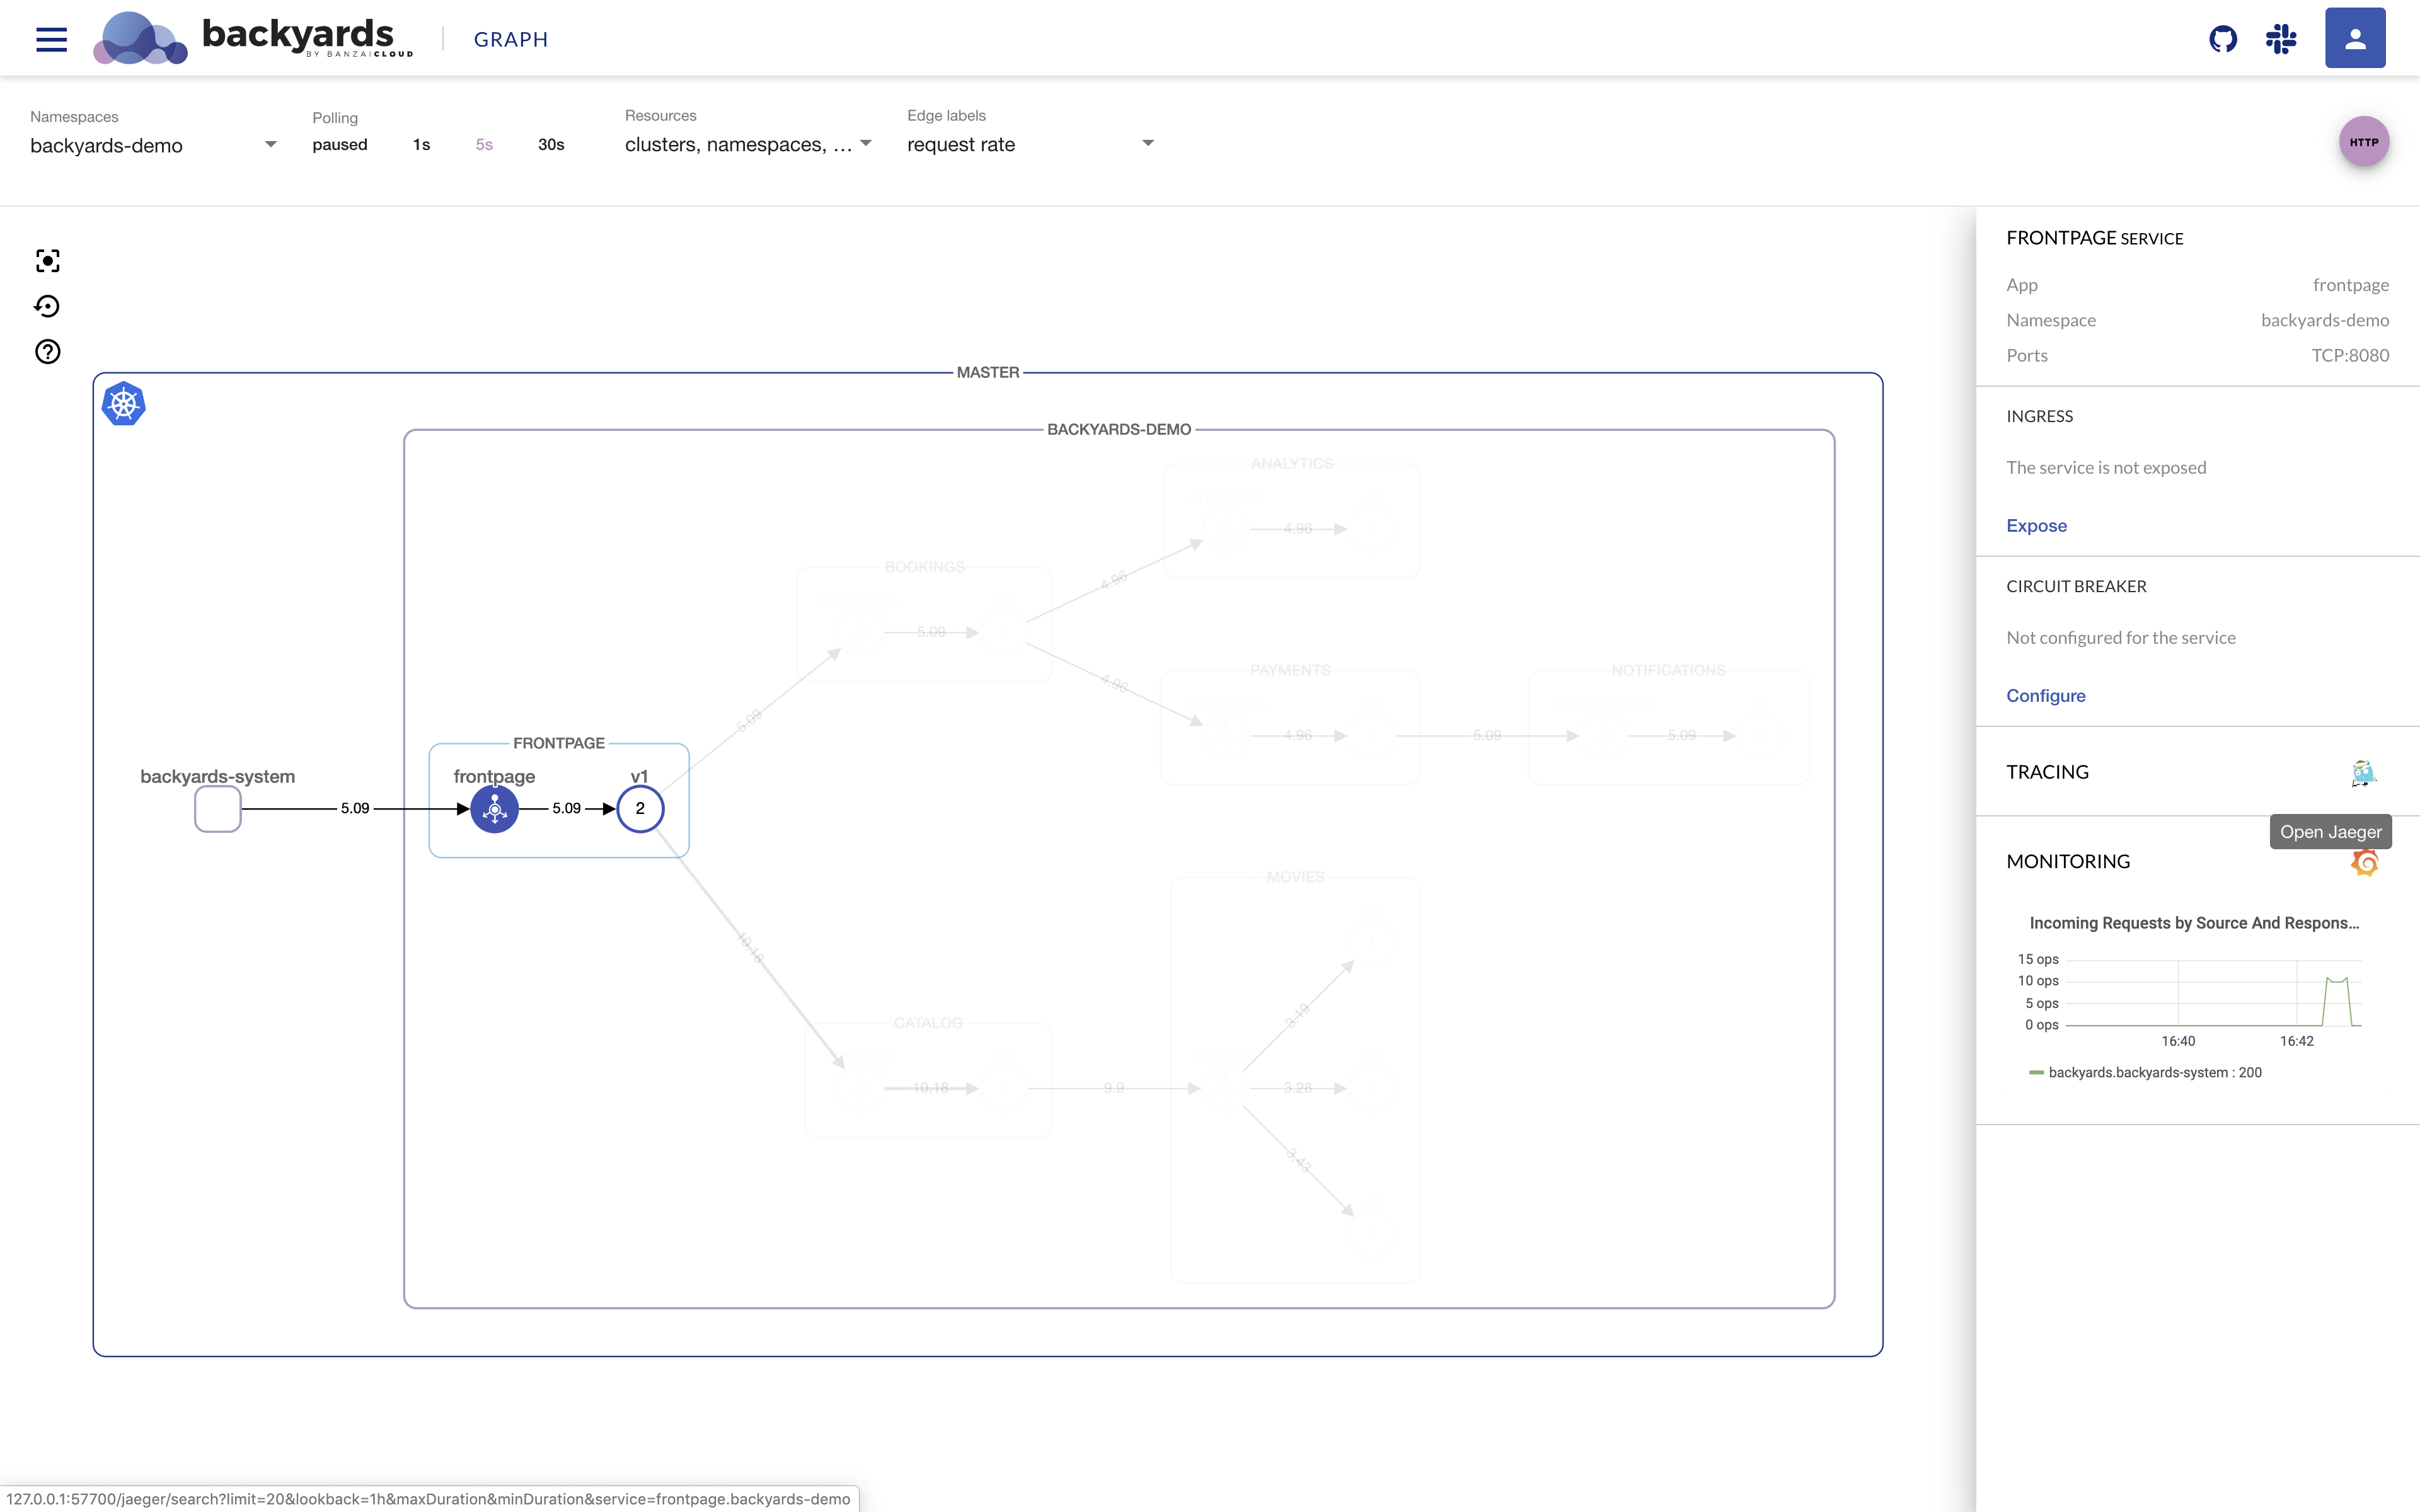
--run-demoflag), so traces can be perceived right away - Jaeger is exposed through an ingress gateway and the links are present on the UI (both on the graph and list view) which is automatically opened
This is literally as easy as issuing one command to a brand new Kubernetes cluster, so if you wish go ahead and give it try!
Here’s what you’ll see:
Jaeger link from the graph view:
Jaeger link from the list view:
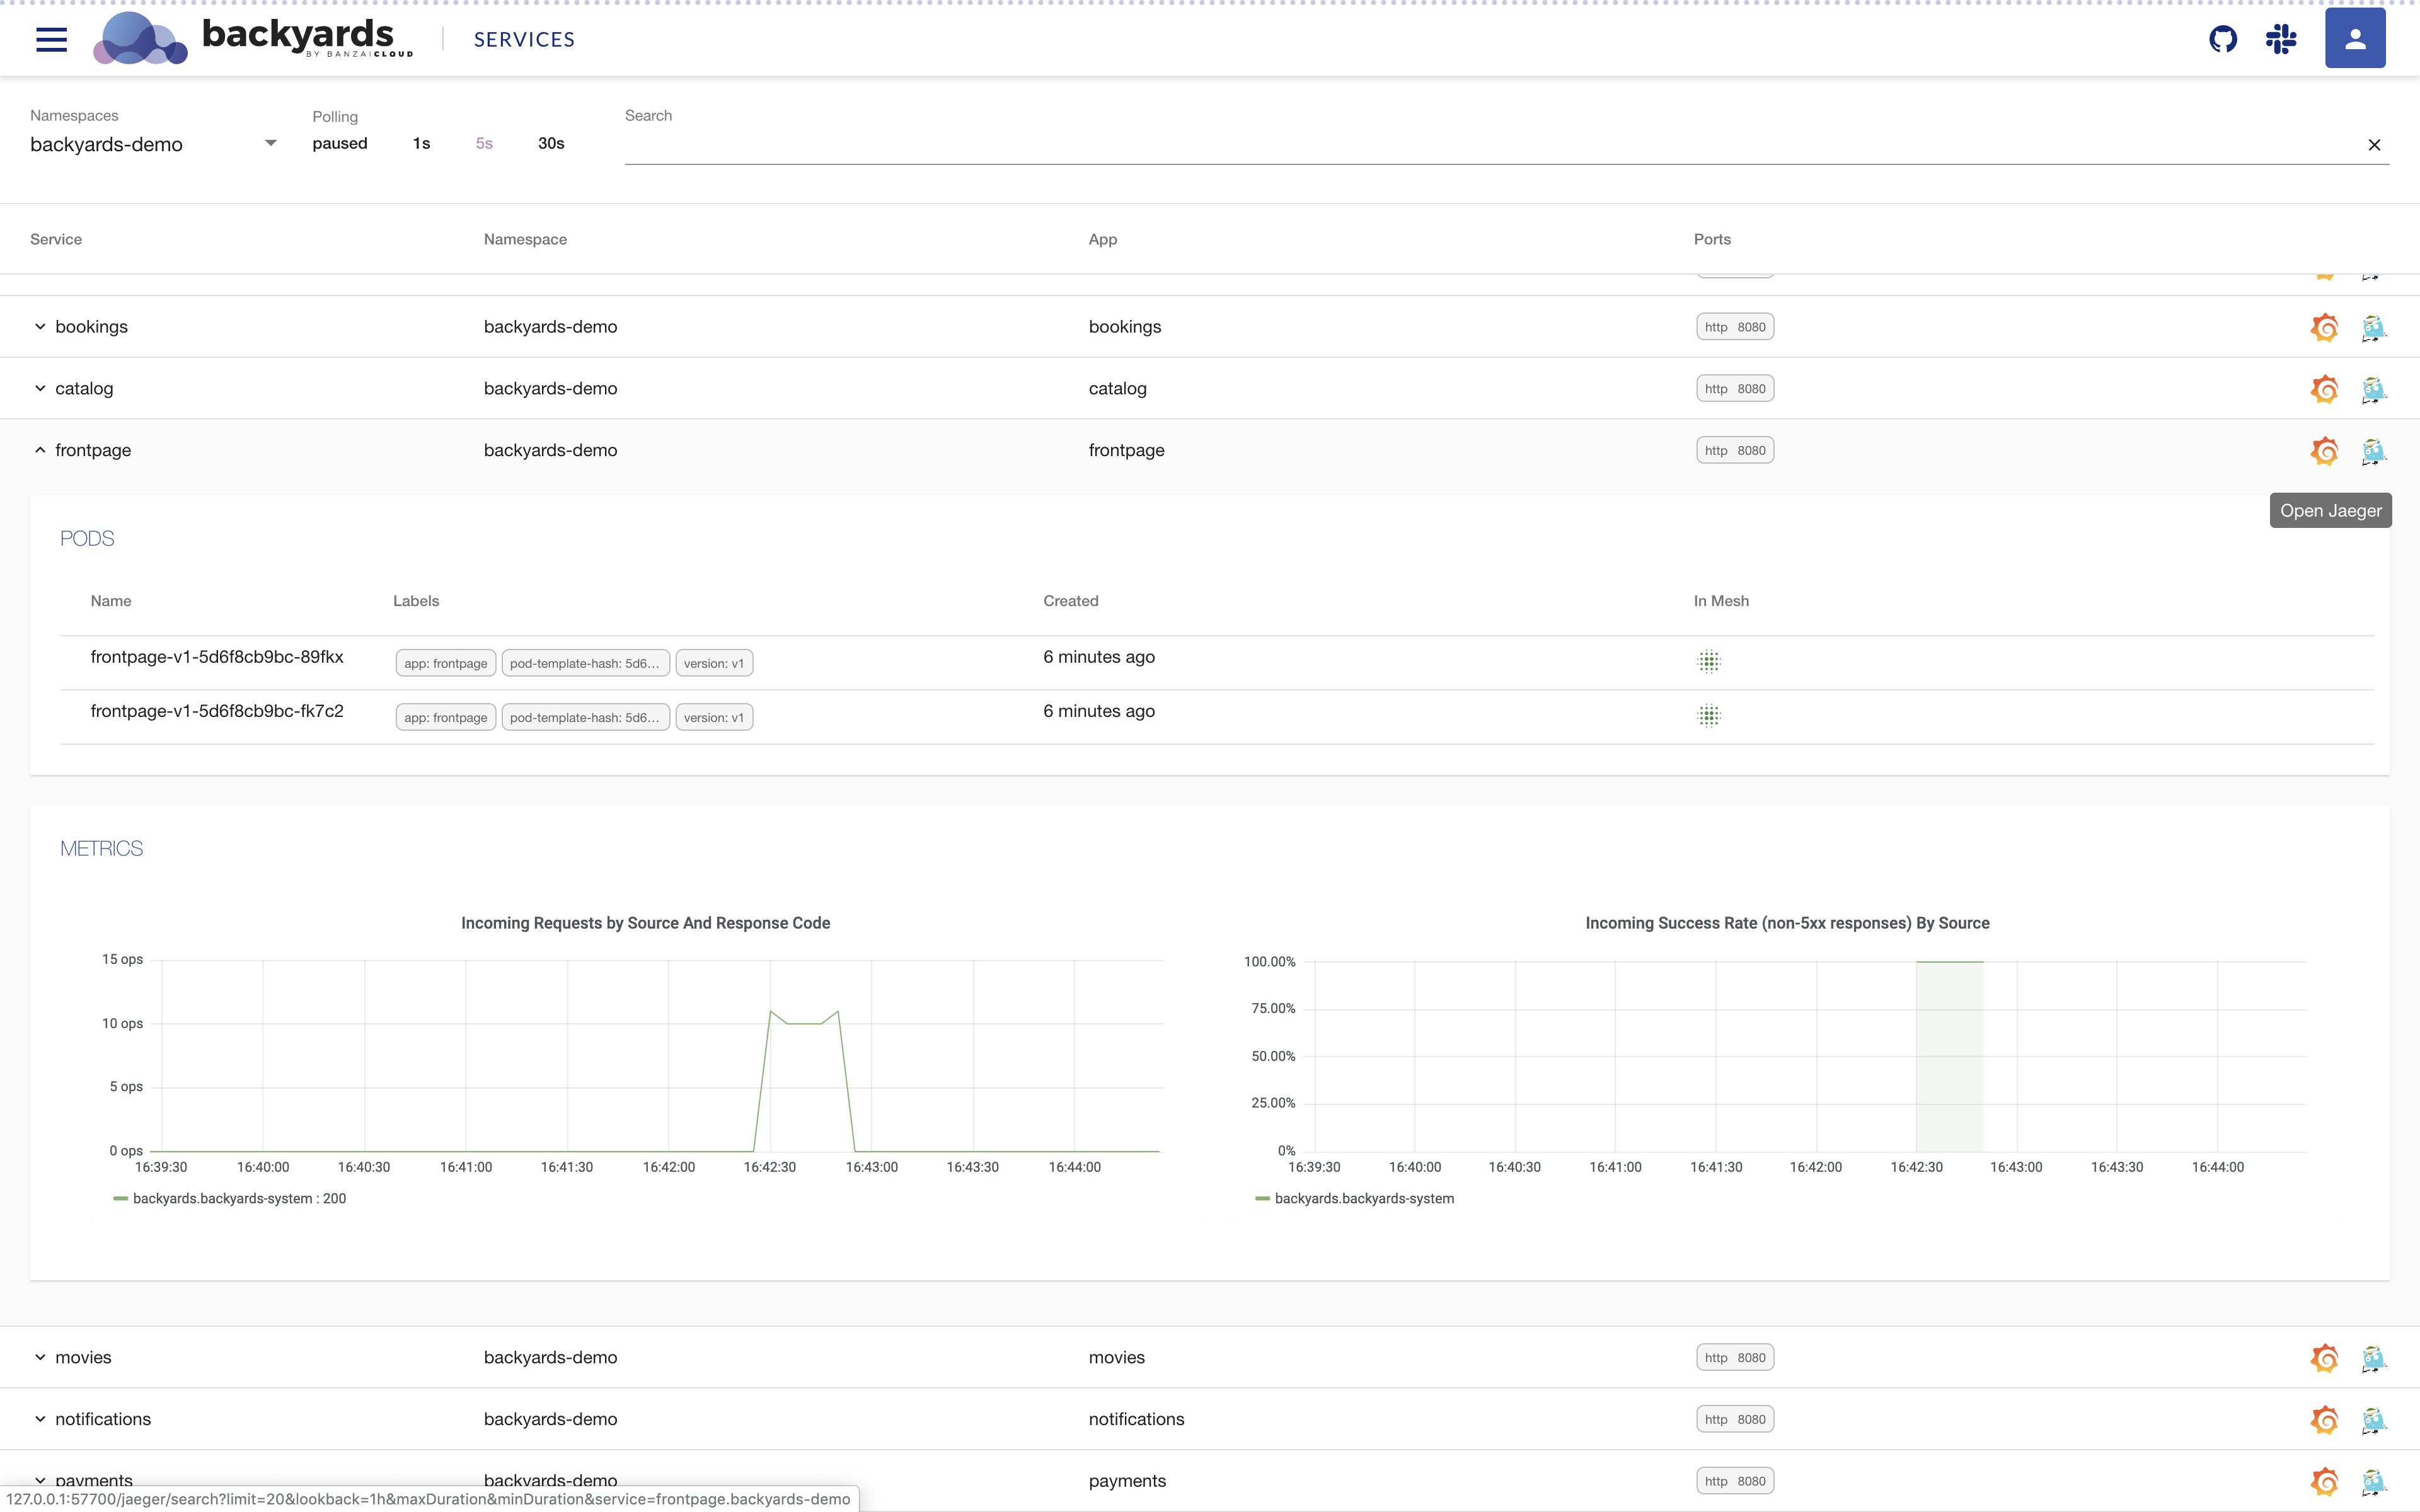
The list view will be introduced later in an upcoming blog post, so stay tuned!
Jaeger UI for the demo application:
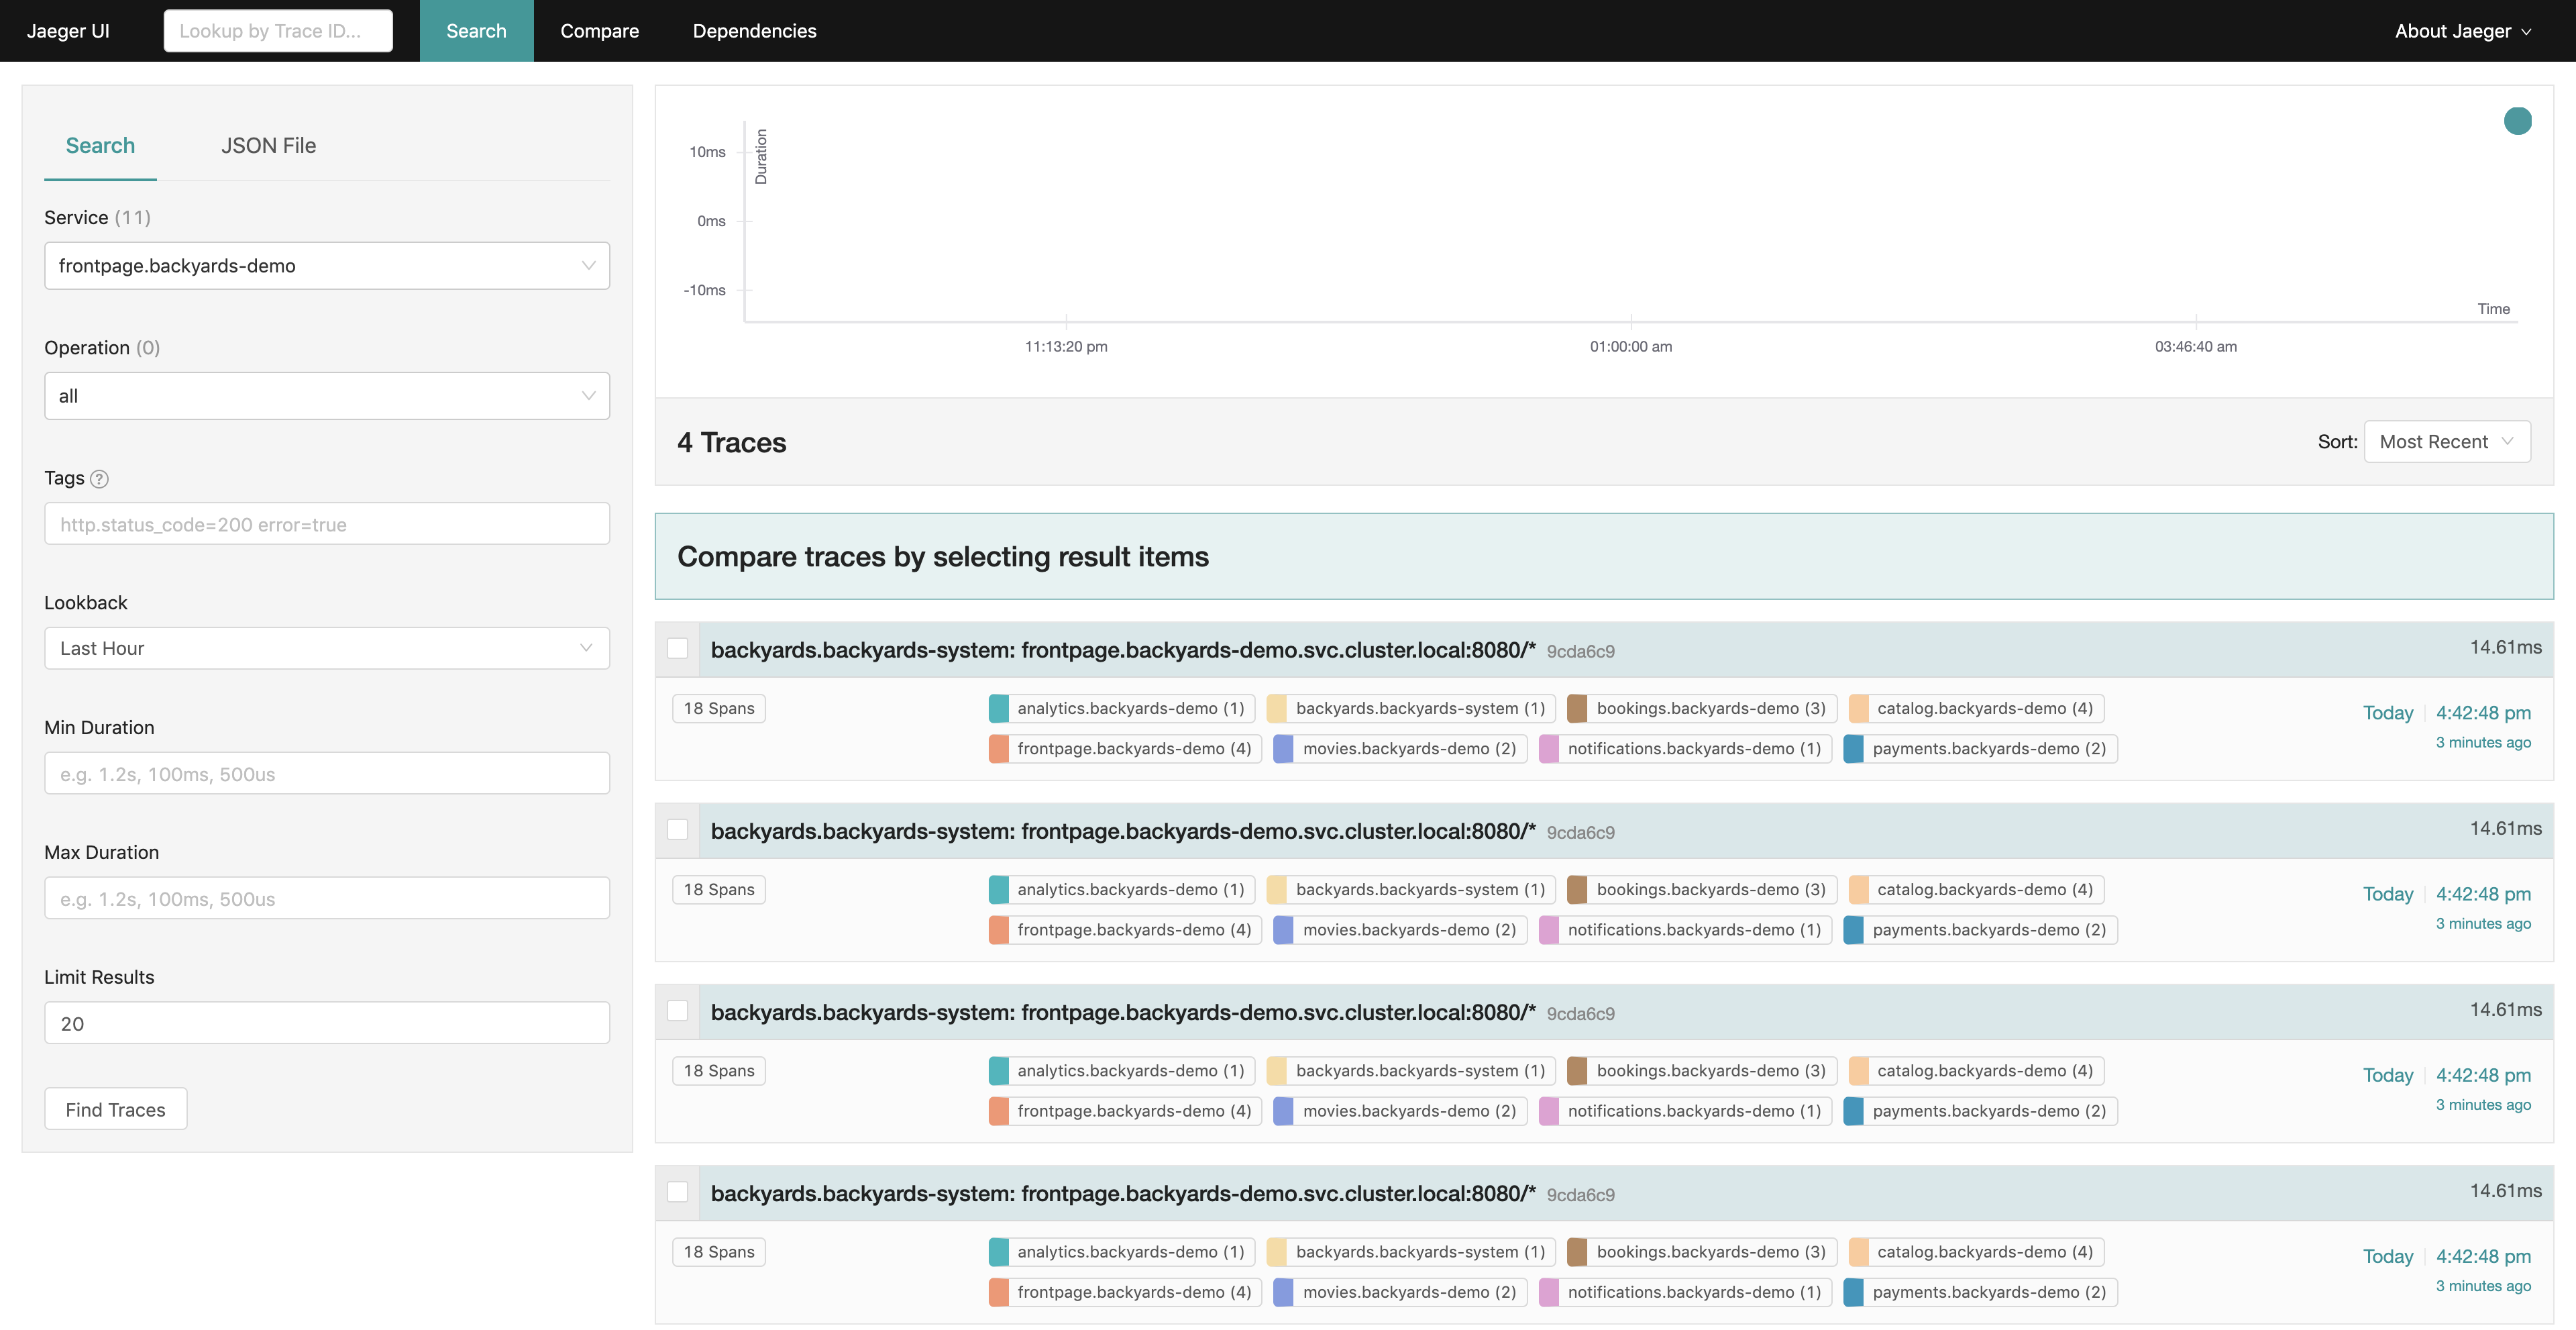
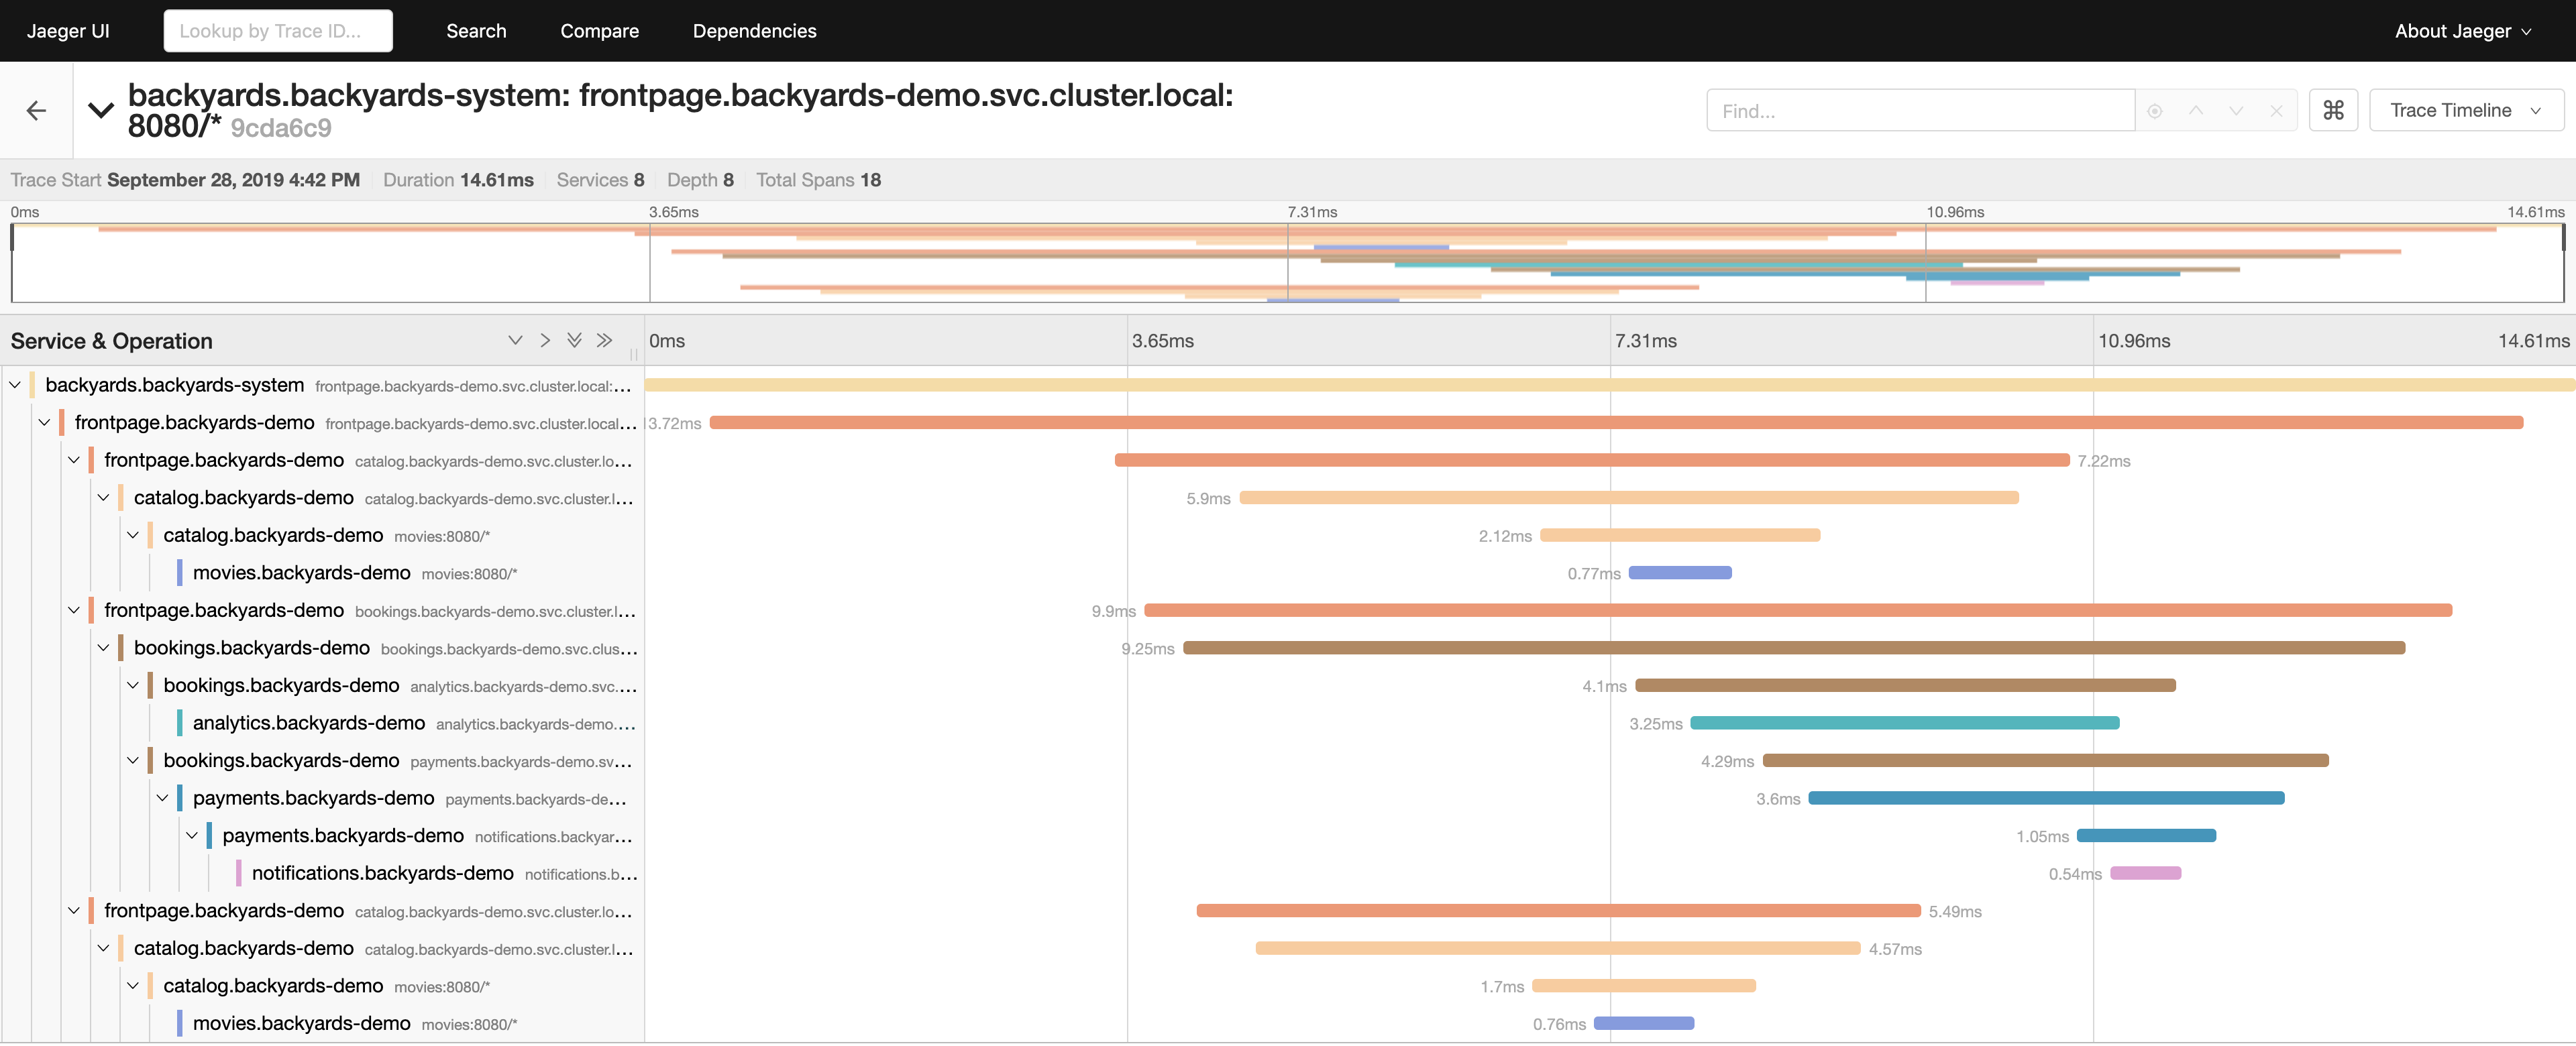
There you can see the whole call stack in the microservices architecture. You can see when exactly the root request was started and how much each request took. You can see e.g. that the analytics service took the most time out of the individual requests which is because it does some actual calculations (computes the value of Pi).
Tip: Backyards is a core component of the Pipeline platform - you can try the hosted developer version here: /products/pipeline/ (Service Mesh tab).
Cleanup 🔗︎
To remove the demo application, Backyards, and Istio from your cluster, you need to apply only one command, which takes care of removing all the components in the correct order:
$ backyards uninstall -a
Takeaway 🔗︎
Distributed tracing is basically a must in production-ready distributed systems to debug complex issues. While our Istio operator solely concentrates on managing Istio, Backyards (now Cisco Service Mesh Manager) encapsulates the operator with many more enterprise-ready components, one of them is Jaeger to provide out of the box distributed tracing support.
Backyards takes care of installing and configuring Jaeger as well as displaying the links for the traces of all services on the Backyards UI!
Happy tracing!
About Backyards 🔗︎
Banzai Cloud’s Backyards (now Cisco Service Mesh Manager) is a multi and hybrid-cloud enabled service mesh platform for constructing modern applications. Built on Kubernetes, our Istio operator and the Banzai Cloud Pipeline platform gives you flexibility, portability, and consistency across on-premise datacenters and on five cloud environments. Use our simple, yet extremely powerful UI and CLI, and experience automated canary releases, traffic shifting, routing, secure service communication, in-depth observability and more, for yourself.
About Banzai Cloud 🔗︎
Banzai Cloud is changing how private clouds are built: simplifying the development, deployment, and scaling of complex applications, and putting the power of Kubernetes and Cloud Native technologies in the hands of developers and enterprises, everywhere.
#multicloud #hybridcloud #BanzaiCloud


