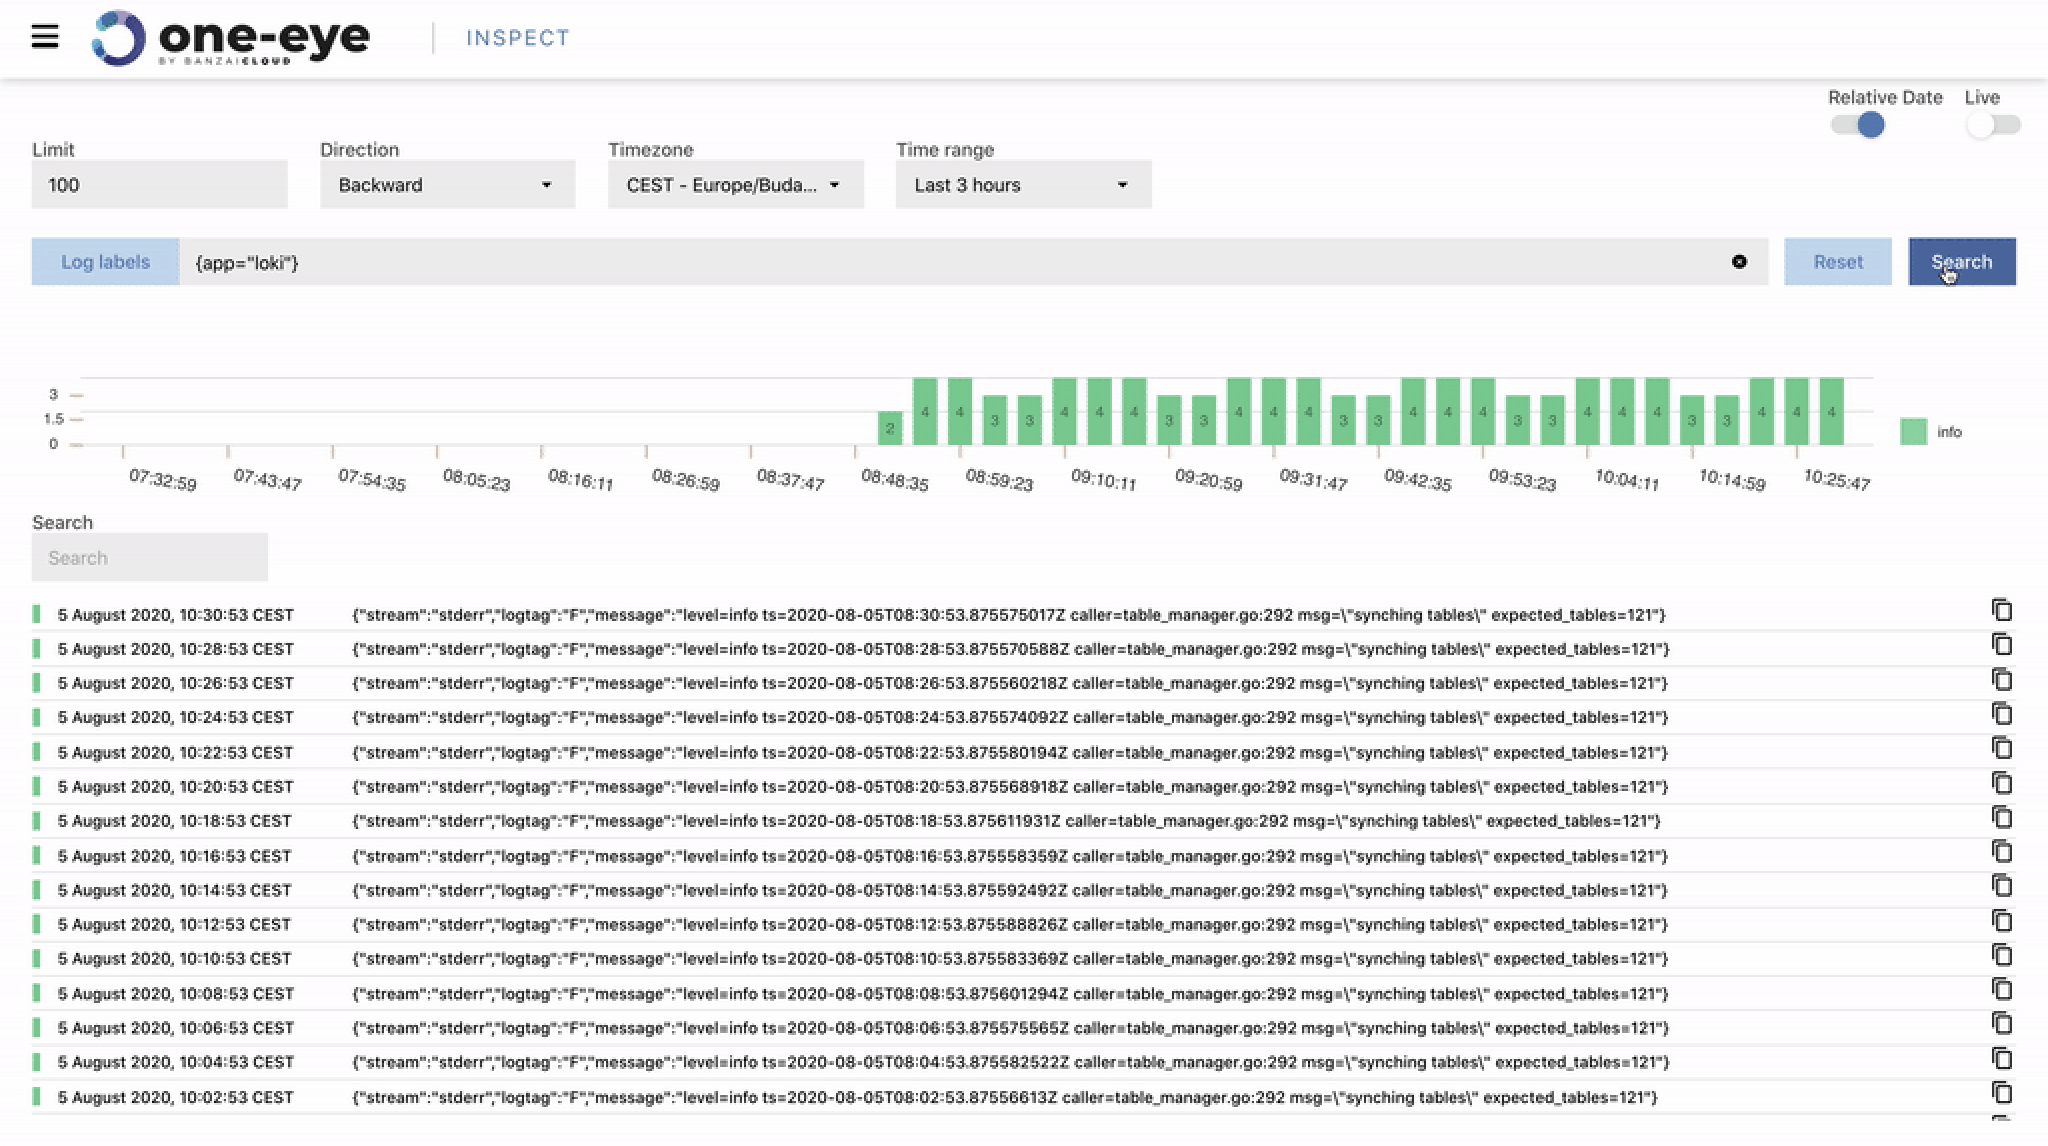
Logs play several roles during an application’s lifecycle. They help to debug problems - some give us analytical data (like access logs) - and help provide an overview of an application’s state at a given moment. This requires different modes of access and visualization, and, because of the distinct behavior involved in each outcome, we often end up using different tools. For example:
- for tailing logs live, we use Loki,
- for complex visualizations we prefer Elasticsearch, and
- to archive logs, we prefer object storage (like Amazon S3).
However, there are also cases in which we need to look back in time and only have our logs archived as gzipped text files. Surely there’s got to be a better way to run analysis. So what’s the solution: to transport logs between these tools! In this blog, we’ll go over a simple scenario, how to move logs from an S3 bucket to Elasticsearch.
The features described here will be included in the upcoming One Eye 0.4.0 release.
Where to start? 🔗︎
The most obvious solution is to write small scripts for fetching, transforming, and ingesting logs. However, these scripts are rarely reusable and require considerable effort of author.
Try to script it 🔗︎
Let’s say we already have a bunch of logs gzipped in an S3 bucket. We can use aws-cli to browse and download these archives. After we get the raw logs, we can ingest them into Elasticsearch with a simple curl command. Let’s take a look at how this works in practice!
Listing particular keys in a bucket 🔗︎
aws s3 ls s3://my-bucket --recursive | grep 'terms'
Fetching logs from S3 🔗︎
aws s3 cp s3://my-bucket/my-key - | gzip -d > raw.logs
Sending bulk index requests to elasticsearch 🔗︎
curl -XPOST elasticsearch:port/my_index/_bulk -d
{"index":{}}
{"stream":"stderr","logtag":"F","message":"I0730 09:31:05.661702       1 trace.go:116] Trace[736852026]: \"GuaranteedUpdate etcd3\" type:*v1.Endpoints ...}}
{"index":{}}
{"stream":"stderr","logtag":"F","message":"some other log ...}}
Note: an Elasticsearch bulk request requires a newline delimited JSON!
The only problem with this approach is that you need to create an Elasticsearch payload from the raw logs. That might sound simple, but to do that you need to add metadata like index, etc. It’s still a doable, but let’s skip over that part for now.
Pros:
- Easy to implement
Cons:
- Limited potential to filter logs
- Transforms logs to Elasticsearch’s bulk request format
- Making it reusable requires a considerable effort
Using AWS Lambda 🔗︎
That last example was really more of an ad-hoc solution. There are more standardized ways of approaching the problem. One such way, which is a little more sophisticated, is to use AWS Lambda. We won’t dig deeper into that solution, ourselves, since there is already a plethora of great articles written about it, which you can find here:
Pros:
- Still easy to implement
Cons:
- Limited to Amazon
- Making it reusable is a considerable effort
Improve filtering with Athena 🔗︎
As you may know, there is a service specifically for running queries on Amazon S3 buckets called Amazon Athena. Athena can be a great tool to help filter your logs: it allows you to query an S3 object store with a simple SQL query.
Glue 🔗︎
Amazon has a standalone service to handle ETL (Extract Transform Load) jobs, as well. This is a generalized version of the problem we’ve described. You can read more about it in the official documentation.
One Eye 🔗︎
As you can see, there are several ways of getting this done in the Cloud. Most of them are pay as you go services, deeply integrated into the offerings of Cloud providers. This means that using them on-premise, or in a different environment, is a real challenge. One Eye is a commercial product that provides out-of-the-box solutions for Kubernetes monitoring, centered around the open-source software that you already love to use. We identified the following key features based on our user requirements:
- Handles both ingesting logs to and reloading logs from object storage
- Basic time and metadata filtering (cluster, namespace, pod, container)
- Easy to use UI
- Automates the whole process from zero to dashboard
Let’s see an example 🔗︎
The first step, which we haven’t touched on yet, is to save logs to an object store. It is extremely important to have a well-defined format for ingesting those logs. The reason for this is that we don’t want to use just any index to map what logs we store, and where. In this case, we’re going to rely exclusively on the object key path to store metadata.
Logging Operator’s S3 output 🔗︎
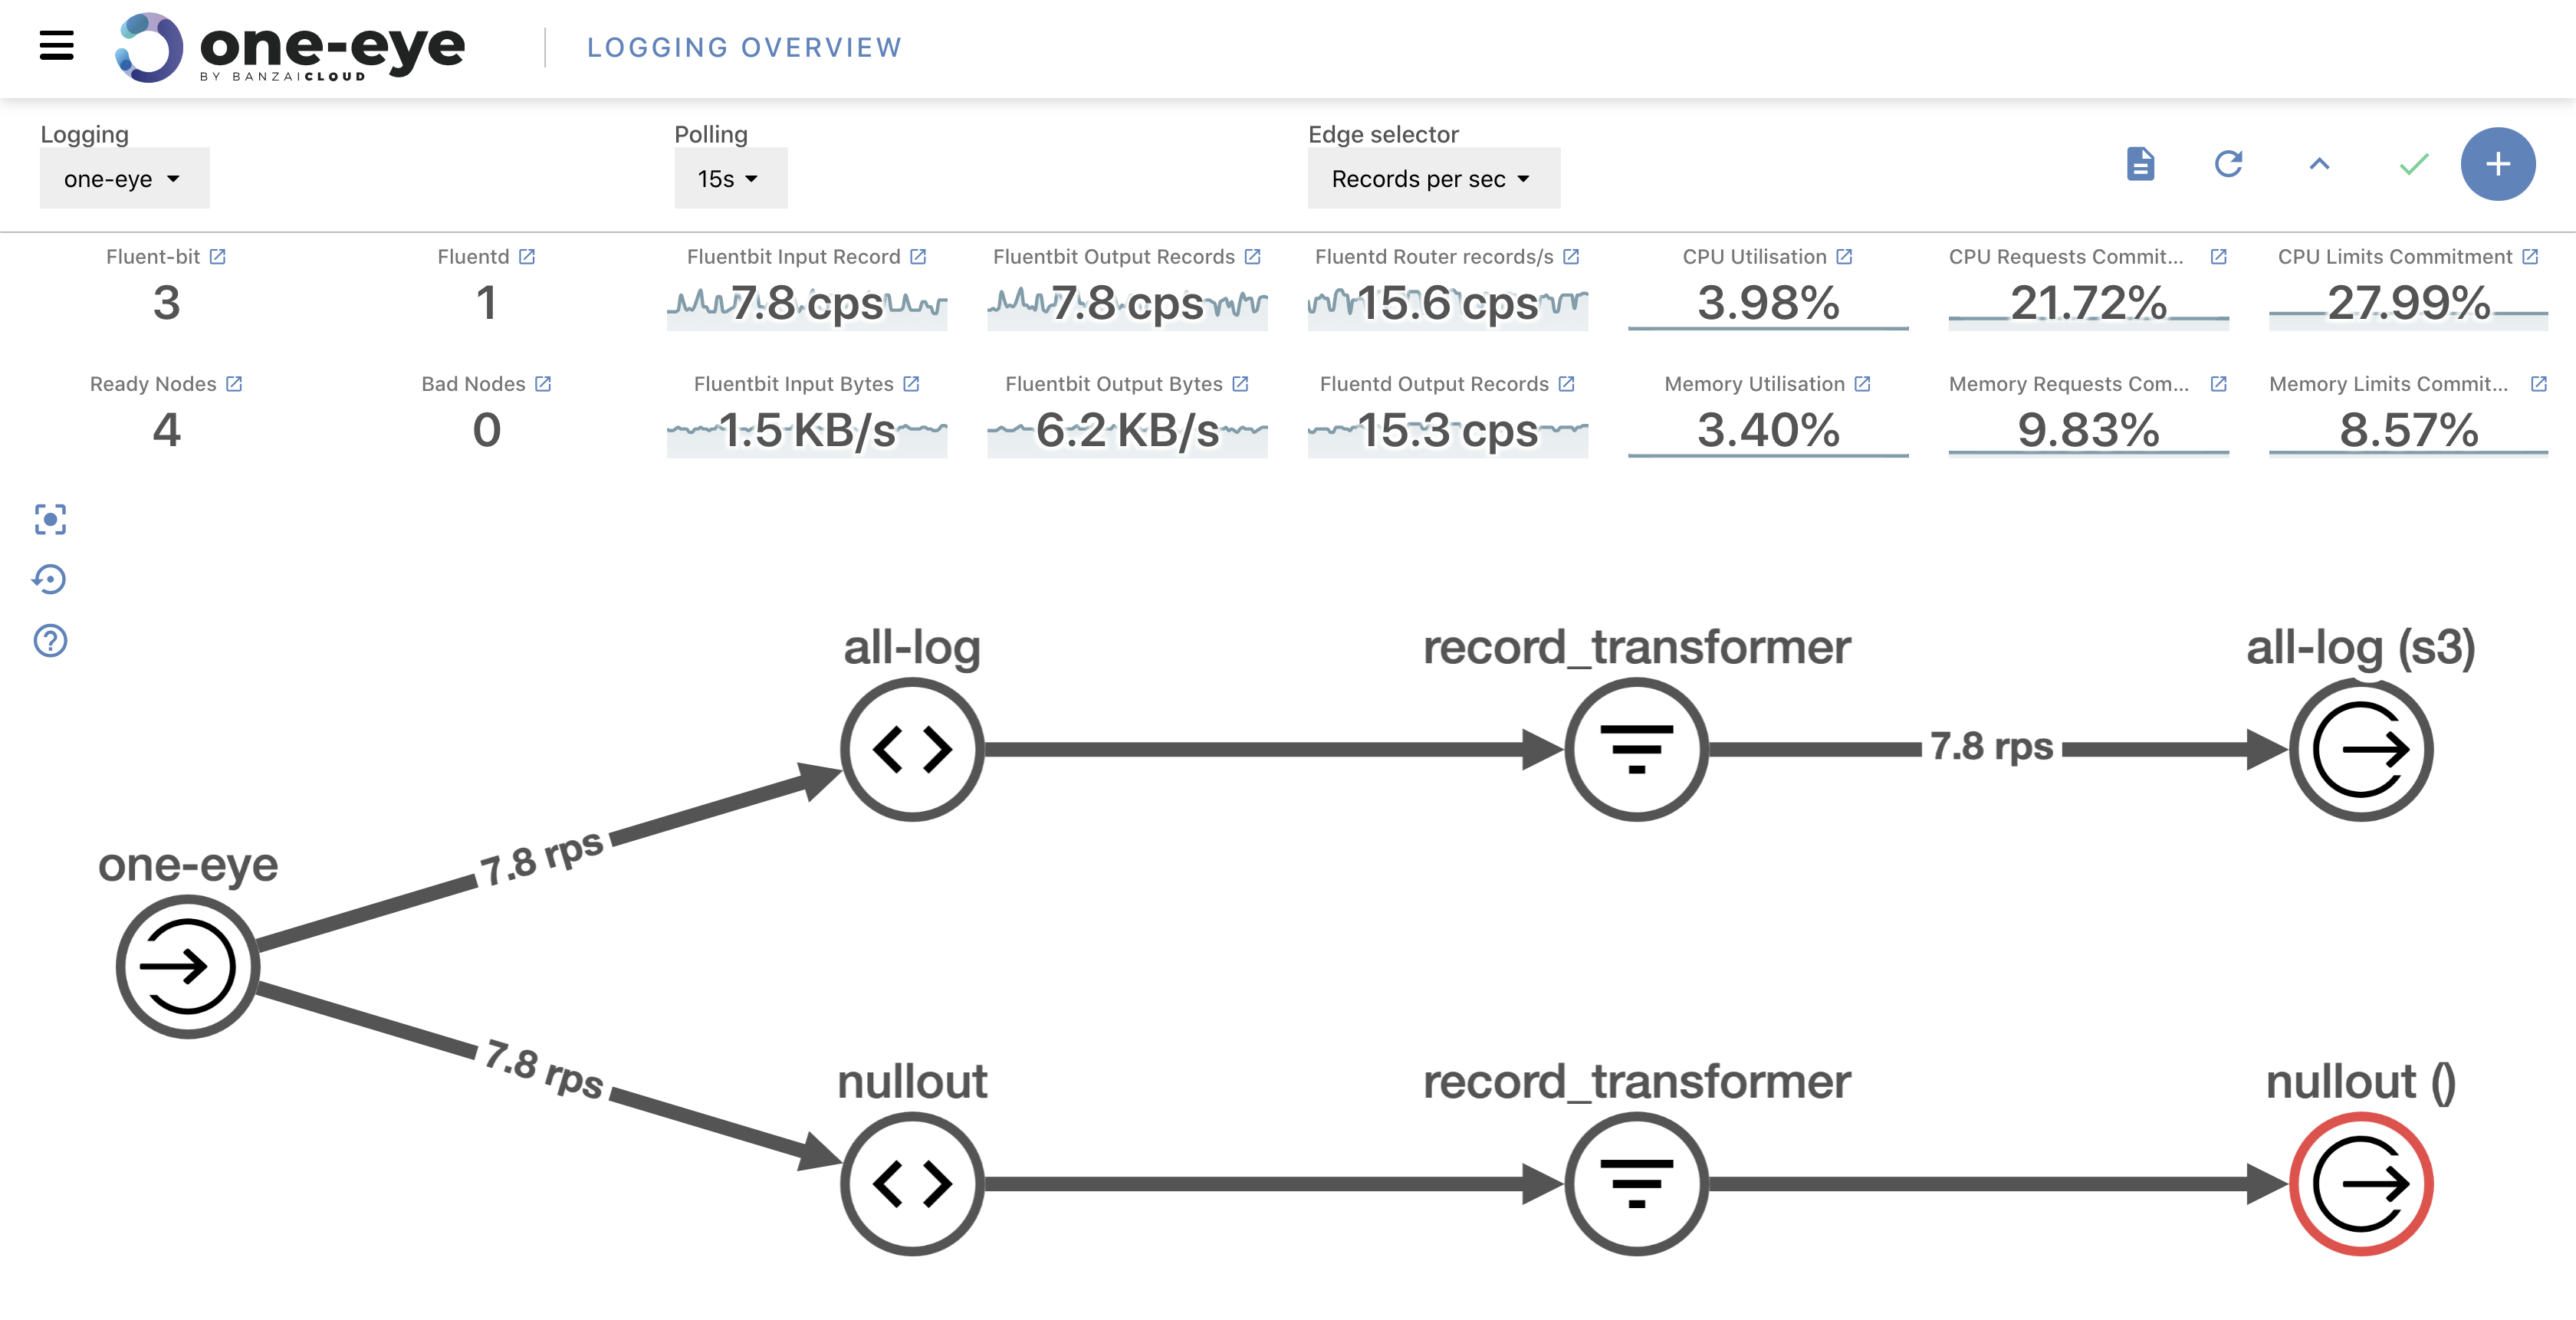
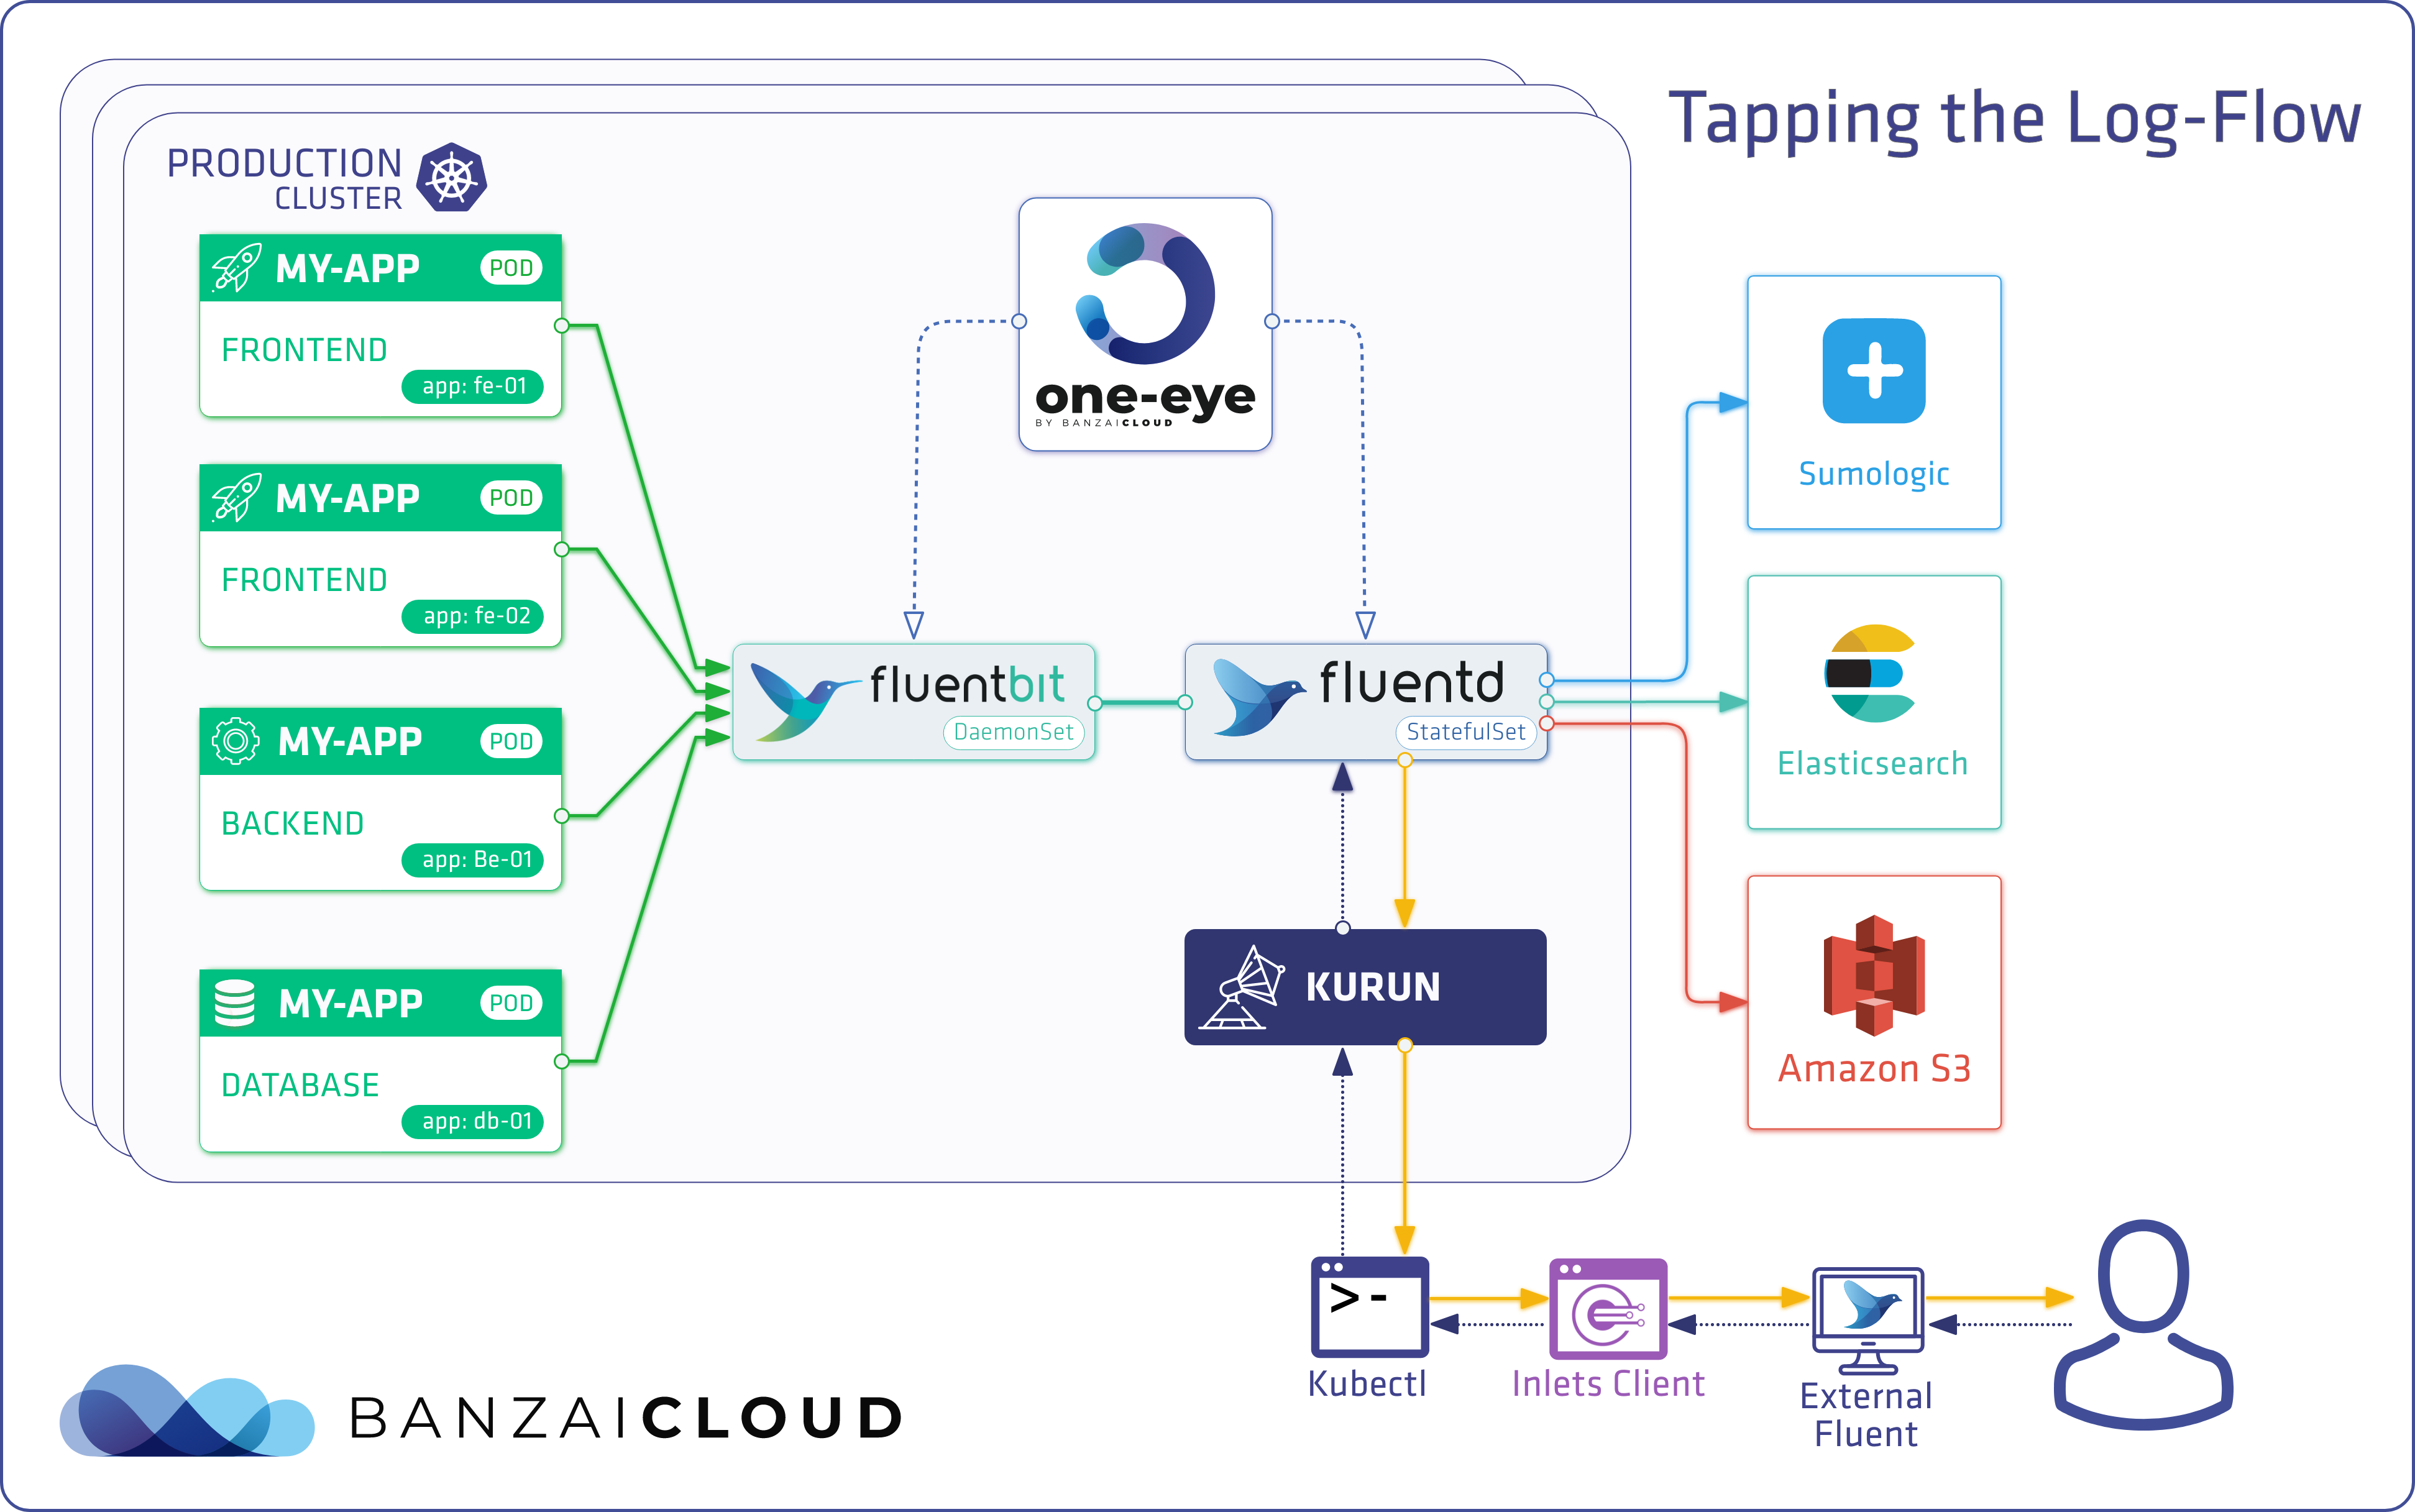
One Eye deploys the Logging Operator, which handles log shipping.
If you’re not familiar with the Logging Operator please read our introduction blog post.
Without going into details, Logging Operator configures a fluentd S3 output. You can define the
s3_object_key_format as a parameter in the plugin. This format can contain any metadata that’s available in your logs. Our reference format is as follows:
${clustername}/%Y/%m/%d/${$.kubernetes.namespace_name}/${$.kubernetes.pod_name}/${$.kubernetes.container_name}/%H:%M_%{index}.%{file_extension}
The above example translates to something like this:
one-eye-cluster/2020/07/30/kube-system/kube-apiserver-kind-control-plane/kube-apiserver/09:00_0.gz
This key format remains human-readable, but also offers the opportunity to filter by keys, via the terms employed above. The logs stored in chunks are gzip compressed. The chunk size depends on the S3 output’s timekey setting, and the gzip format supports streamed data processing.
One Eye Log Restoration 🔗︎
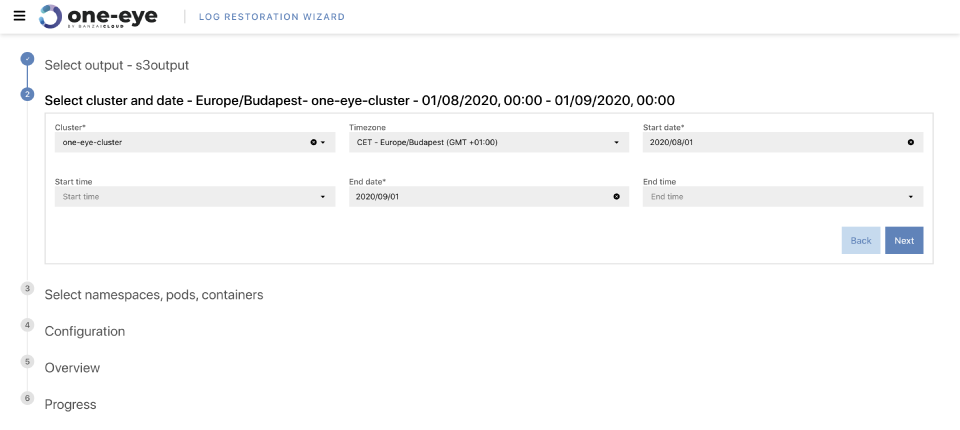
Let’s go through the filtering features available in the UI, which are easier to understand. The first thing you have to choose is the time range that you want to retrieve the logs from.
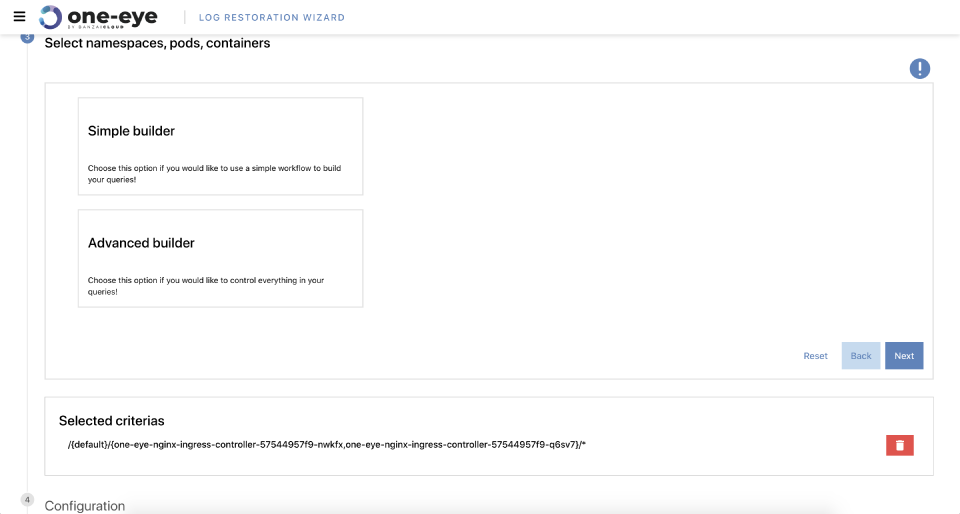
In the next step there are a couple of options. If you already know the expression you want to load logs with, use the Advanced option and write your query. If you need help building your expression, which we recommend, use the Simple expression builder.
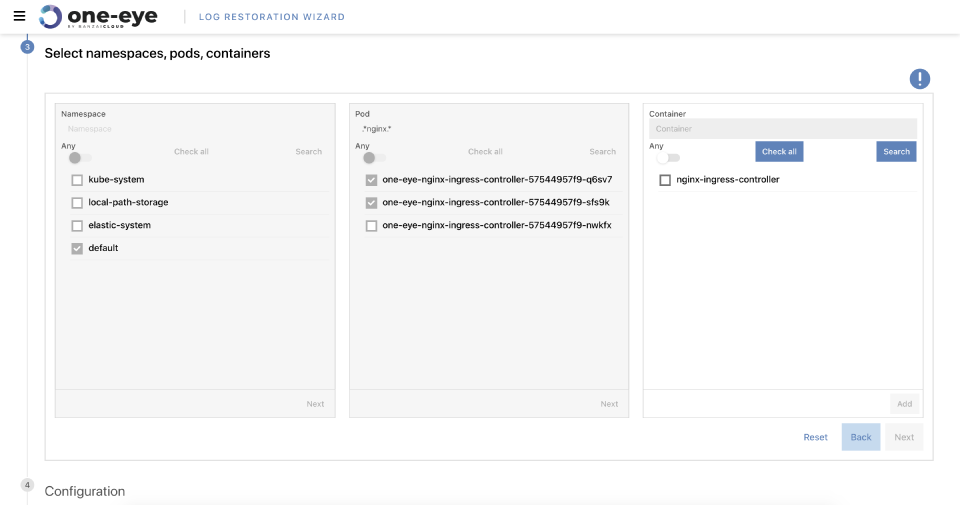
The UI lists object patterns, based on the time range you selected. This helps to reduce the scope of the query. If you don’t want to narrow the scope use the any option. You can also use Go regexp to narrow your searches.
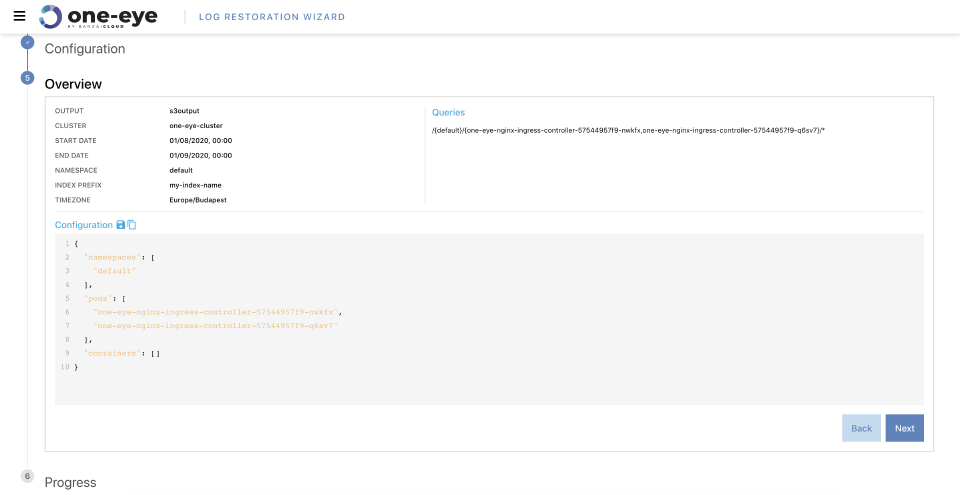
Once you’ve finished your query expressions, you’ll be shown a summary page with your choices on it. We advise that you review it twice, because scraping huge ranges with many objects can take a lot of time.
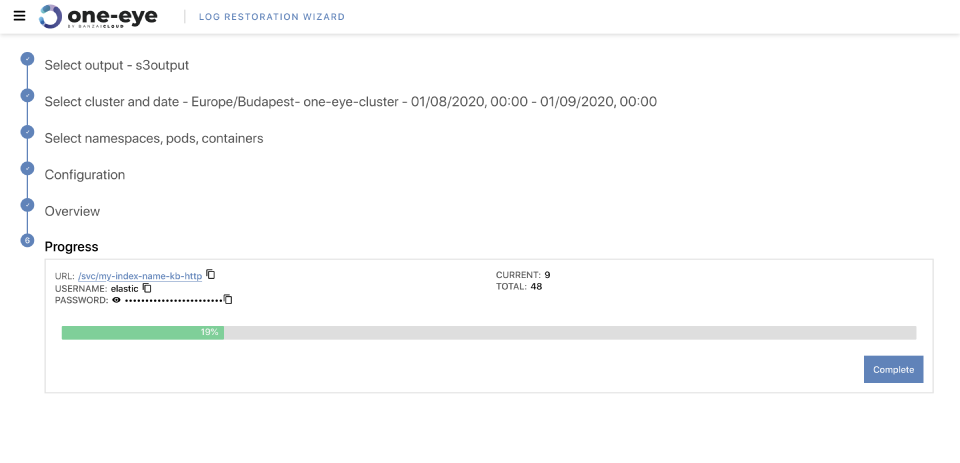
The last step is to submit the job. You’ll then get a status bar that tells you how the job of scraping your archived logs is progressing.
After the job is finished, you can navigate to the Kibana dashboard to explore your warmed up logs.
Log restoration in depth 🔗︎
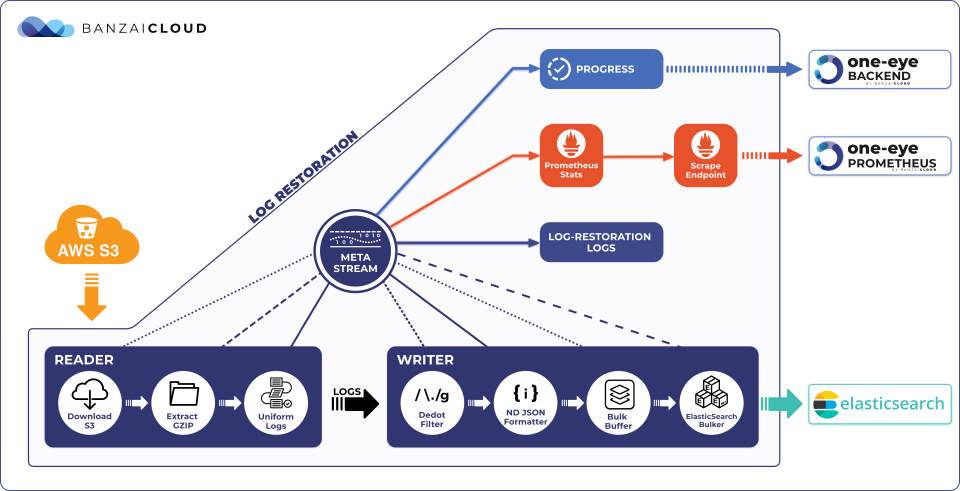
It looks pretty simple, doesn’t it? Well, under the hood it’s a bit more complicated. Let’s go through the Log restoration sub-system architecture.

- The S3 output saves the logs to the given S3 bucket with a pre-defined object key, which structures the data in such a way that log-restoration is able to perform filtering.
- It’s possible to save multiple clusters’ logs to the same S3 bucket by defining a unique name for the cluster, this means cross-cluster logs are also retrievable from the same bucket. However, one job is limited to one cluster for now.
One Eye UIoffers an out-of-the box solution for starting/managing/customizing log-restoration jobs.One Eye Backendstarts the log-restoration job as a Kubernetes job, and polls the Prometheus endpoint to monitor its progress. It also starts the targeted instances of Elasticsearch and Kibana.Log-restoration jobtransfers the data to the newly initialized Elasticsearch instance and exposes the Prometheus endpoint for scraping.
Filtering 🔗︎
You can customize the subset of logs you want to restore by setting various filters based on key attributes. A filter consists of multiple criteria. A criteria is a filter expression containing namespaces, pods, and containers. Each attribute is represented as an RE2 regular expression. Empty filters and criteria are interpreted as .*.
API representation of a restoration job:
{
  "cluster": "one-eye-cluster",
  "from": "2020-08-03T16:27:51.69398+00:00",
  "to": "2020-08-14T16:27:51.693982+00:00",
  "filters": [
    {
      "namespaces": [
        ".*"
      ],
      "pods": [
        ".*-kb-.*",
        "elastic-operator.*"
      ],
      "containers": [
        ""
      ]
    },
    {
      "namespaces": [],
      "pods": [],
      "containers": [
        "fluent.*"
      ]
    }
  ]
}
We know this seems a bit complex at first glance, which is why we added the expression builder to our UI. With the API you can automatize jobs and integrate it into a CICD system, as well.
Log-restoration job 🔗︎
We designed this system to exploit Kubernetes’ natural advantages as much as possible. The restoration job is actually a Kubernetes job. The job exposes Prometheus metrics, which all fit into the One Eye ecosystem. The log-restoration is a standalone binary which was implemented in a way that uses a chain of modules to process logs. This way the code is reusable, easy to maintain, and easy to extend.
What we did, we did in keeping with the UNIX philosophy of “Do one thing, and do it well”, so the job consists of several modules on a chain. This way the modules are relatively independent from the data, and can be used in multiple cases.
-
S3 downloader: Downloads all objects from the Amazon S3 object store, and forwards the data as a stream. -
gzip extractor: Decompresses the streamed data from gzip. -
uniform logs: Transforms the payload to a common log format, which ensures that the modules used after this point will receive a standardized format. -
dedot filter: Logs keys that may have restrictions, like how Elasticsearch interprets dots as hierarchy separators; this module simply replace dots with underscores. -
NDJSON formatter: Converts the log lines into NDJSON format. (required by Elasticsearch bulk input) -
Bulk buffer: Buffering module which receives NDJSON lines, and forwards data only when the target buffer size is exceeded (or buffers are flushed). -
elasticsearch bulker: Calls the Elasticsearch Bulk API endpoint. -
Reader: Chain of modules to generate a uniform log format from a set of object keys. -
Writer: Chain of modules to transfer the uniform logs to an endpoint.Let’s assume, you want to create an
Amazon S3to aSumologiclog-restoration job. In this case the implementation requires only to write a few modules in aWriterchain. However, single components - likededot filter- can be re-used. Only the formatter and transporter components needs to be implemented. -
meta stream: All modules are able to report metadata into a stream which is being processed during the log-restoration process. This meta contains logs, Prometheus metrics, and progress reports, but it’s possible that it will be extended to contain more.
The first version of the job is a single-threaded application that transports data from the reader to the writer component. In future releases, we will add an async transport layer to handle multiple readers and writers that will enhance high traffic performance.
What’s next? 🔗︎
The first version of the log restoration supports only S3 and Elasticsearch as backend. We used the standard Go bindings wherever it was feasible.
- Amazon S3: aws-sdk-go
- Elasticsearch: go-elasticsearch
- Kibana: REST API
Although the log-restoration component is fairly new, we have already had several ideas on how to extend it.
- Asynchron reader and writer chains
- Support other object storage like GCS, Azure Storage
- Support other endpoints like fluentd, Kafka, etc.
If you want to try out this awesome new feature, stay tuned for the new One Eye 0.4.0 release!


