


Today we are happy to announce a new release of the Banzai Cloud logging operator. It’s been a long time from the first commits till today, and is always nice to look back, learn and reflect on the evolution of the project.

The first major release, June 2018 🔗︎
This was the very first release, and among the first operators we made. The operator pattern was pretty new, and the goal of the first logging operator was fairly simple - automate the manual fluent ecosystem configurations we were doing for our customers with the Pipeline platform. The operator was able to route logs based on static app labels, deployed fluent-bit and fluent, made sure proper mTLS certificates are in place and configured them. Surprisingly it worked quite well, and the initial community feedback was amazing. Compared to what we have today, it had a single CRD to define the input, filters, and outputs for a logging flow.
The second major release, September 2019 🔗︎
With more than one year of production experience and a growing community, we revisited the design of the logging operator. Sometimes admitting that you could have done better is painful. We threw away everything we had and started fresh. It was a total rewrite from scratch, we even considered to start a completely new project.
With v2 we changed the question of How do I solve the problem with this particular tool? to
How do you want to configure and automate logging on your Kubernetes cluster?.
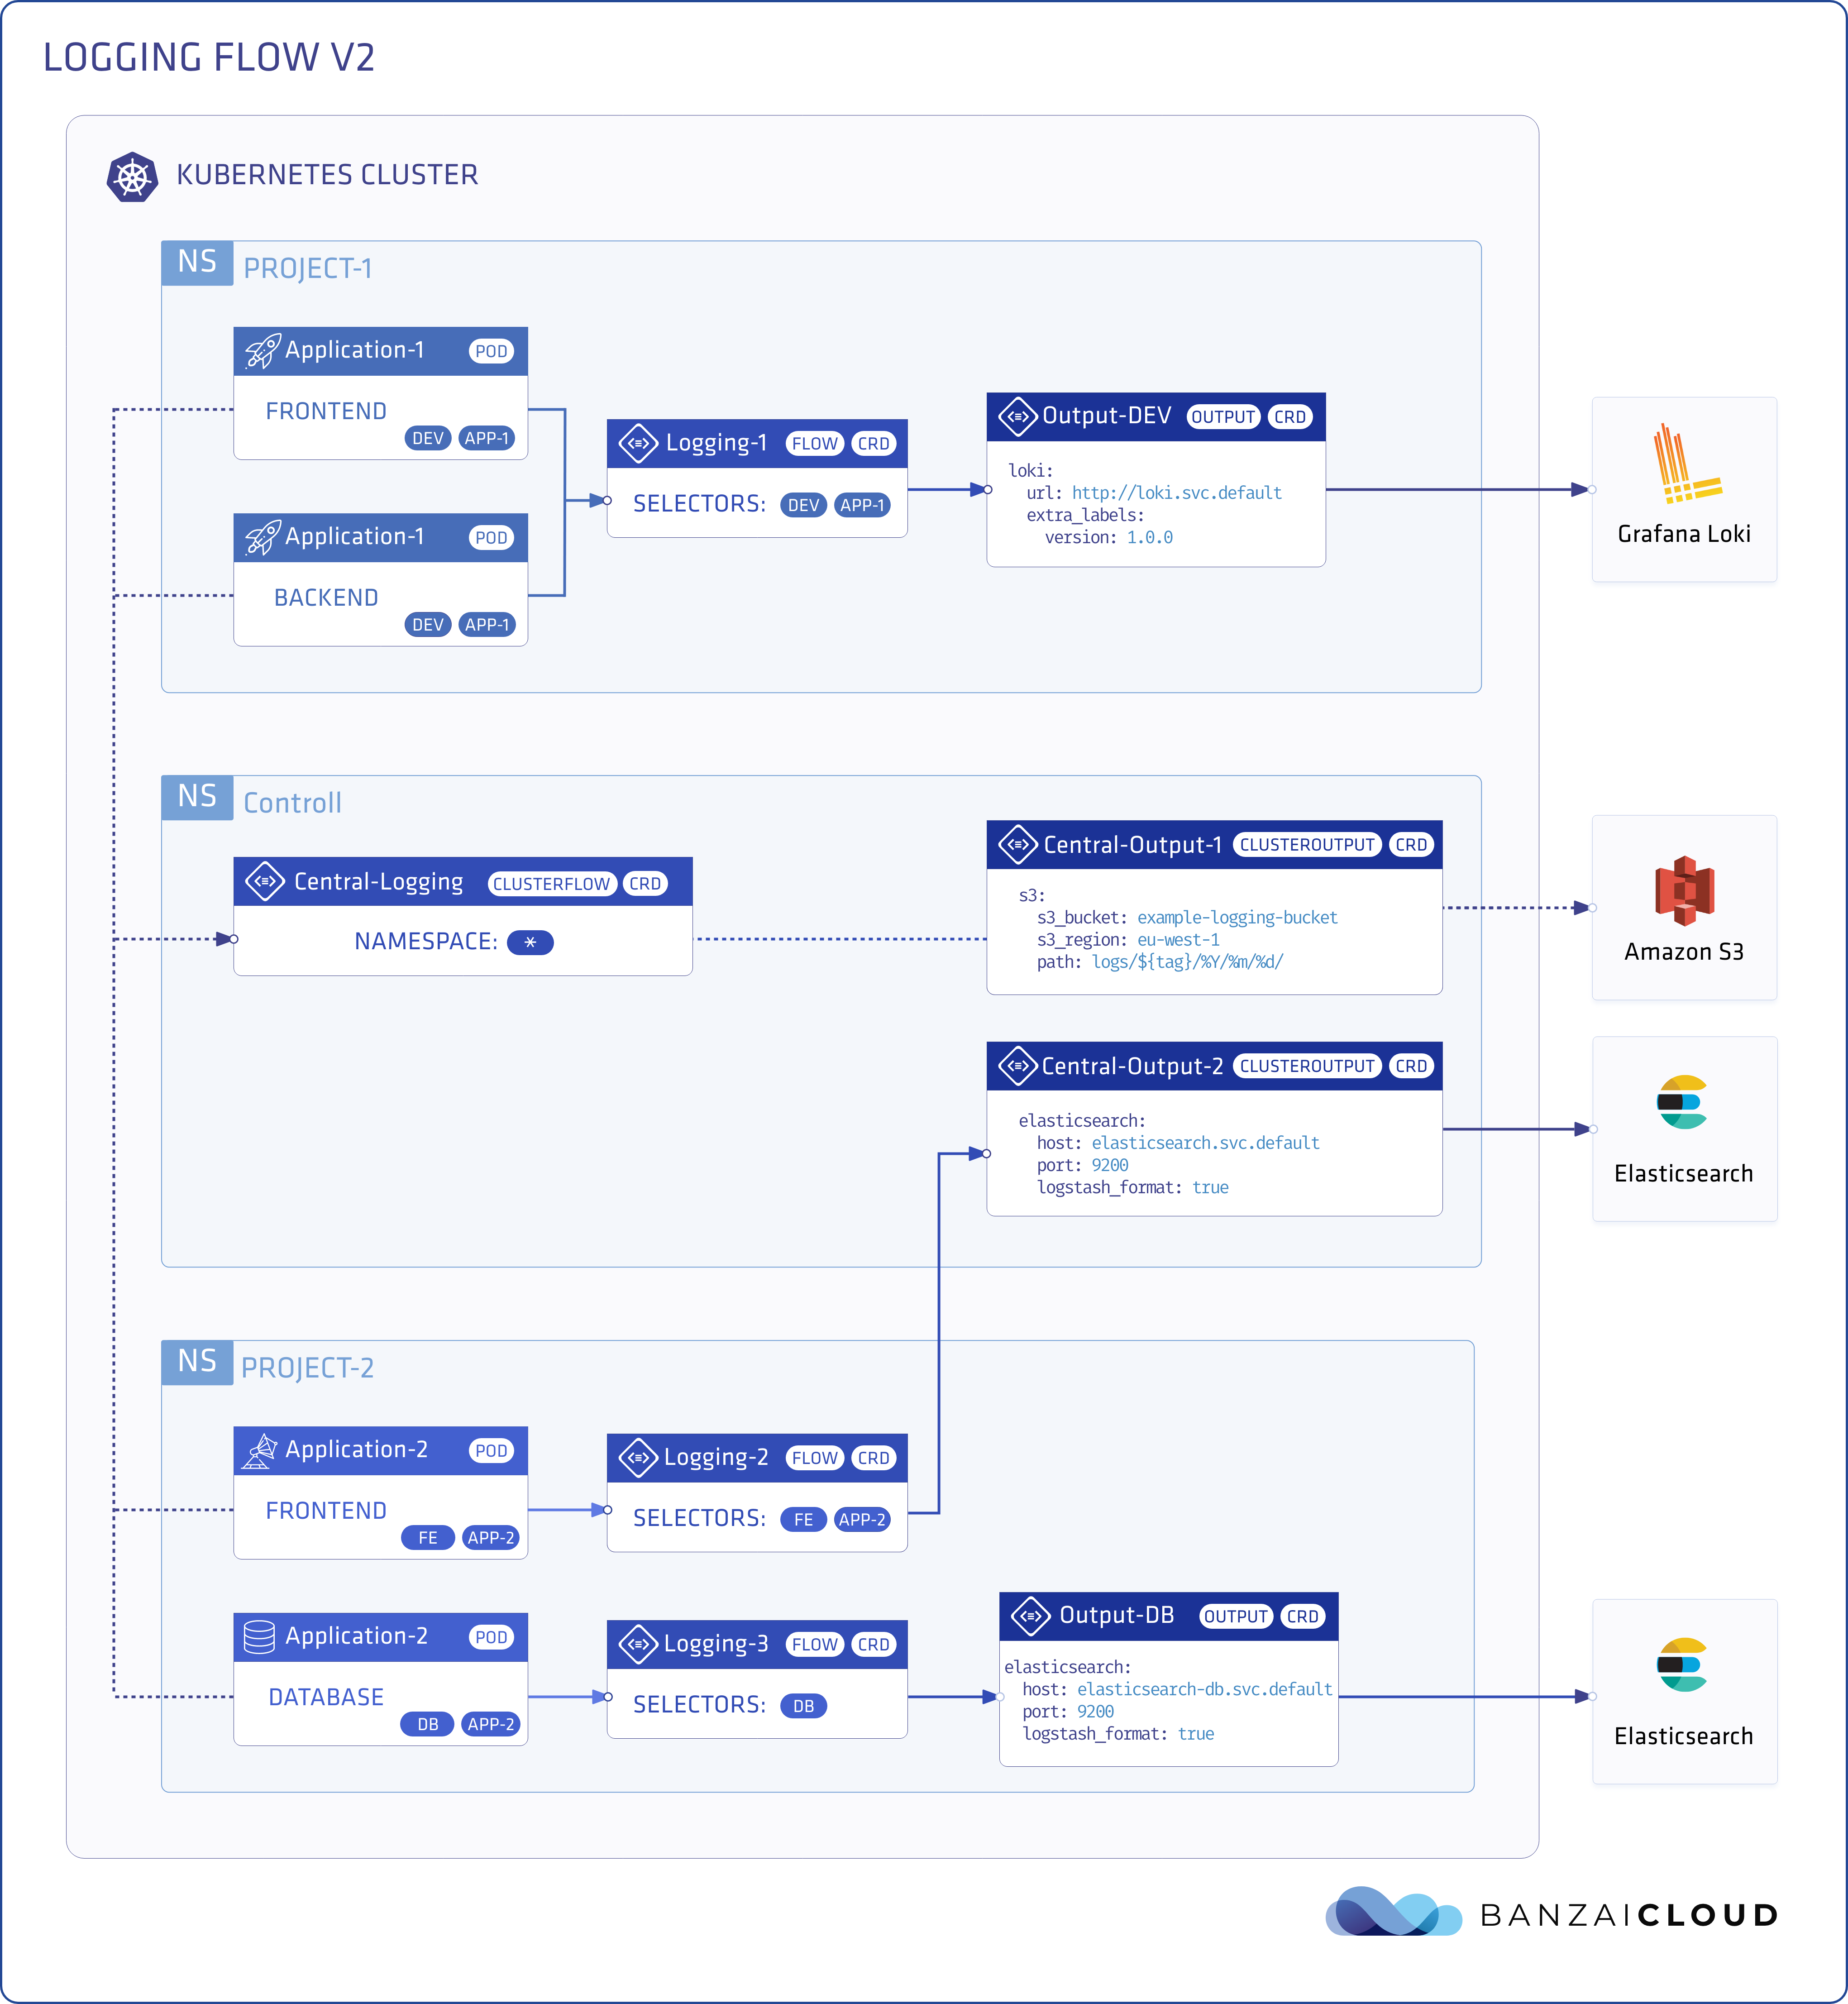
In the v2 of the logging operator we came up with new design principles as Logging, Flow, Output,
ClusterFlow, and ClusterOutput resources. The new design allows the users
to define label selectors like in any Kubernetes service and define namespace scoped log flows via Flows and cluster-wide log flows via ClusterFlows.
If you are not familiar with these concepts please read The Kubernetes logging operator reloaded post. It’s a pretty good introduction to v2.
After the release interest started to grow exponentially, several people joined the community by using and contributing to the project. We have a friendly and active slack channel where people share their production experience, and talk about issues or questions they might have.
The logging operator v3 🔗︎
For those who skipped the history part or are new to the logging operator lets start with some important facts:
- It is built on
fluentdandfluentbit - Does configuration check and input validation
- Supports more than 25 fluentd plugins
- Secures connections between components
- Enables a sophisticated routing logic
Now let’s dig into some of the new features and enhancements.
Routing enhancements 🔗︎
The core concept of the logging operator is to effectively select and transform the relevant logs based on Kubernetes metadata. But why is the routing so important? Can’t we just shovel and move everything for example into an Elasticsearch? The answer is yes and no.
It is possible to transfer everything to a destination but it won’t be as effective as transferring the right inputs to the right places. Think about structured versus unstructured logs. If you want to analyze your logs you would choose structured logs over unstructured. The more sophisticated your routing the more effective (and cost-optimal) your log processing can be (more on this later).
So let’s see the routing in V2.
You had two options: either use Flow or ClusterFlow. With a Flow you implicitly select the namespace where you would like to create it.
apiVersion: logging.banzaicloud.io/v1beta1
kind: Flow
metadata:
  name: my-logs
  namespace: my-namespace
selectors:
  app: nginx
In contrast, a ClusterFlow collects logs from all namespaces.
This concept covered a lot of use-cases but as you can imagine there are always some exceptions.
Get logs from specific namespaces 🔗︎
There were 2 options to handle these cases.
- Create a Flow in each namespace to cover all of them
- Create a ClusterFlow and filter out the unwanted logs
The first option can be problematic if users can edit Flow definitions in their namespaces and accidentally modify or delete them. The second approach seems to be ineffective since we control the routing of messages so why filter it twice?
In v3 we introduced namespaces as a routing attribute.
Exclude logs instead of selecting them 🔗︎
There were several cases where users needed all logs except logs from some specific pods
or namespaces. So we decided to introduce the exclude statement as well. However to achieve a consistent system we had to redesign the selector syntax.
Welcome the match attribute 🔗︎
A match is a list of select and exclude statements. The expressions are evaluated in order.
apiVersion: logging.banzaicloud.io/v1beta1
kind: Flow
metadata:
  name: flow-sample
spec:
  match:
    - exclude:
        labels:
          env: dev
    - select:
        labels:
          app: nginx
The formula is simple. If a select matches the record, it is selected. If the exclude matches the record, it is dropped. If neither of that happens the record is dropped. In the example above, we drop everything that has an env: dev label and select only records with app: nginx label.
Add more metadata 🔗︎
To select (or exclude) logs more precisely we added more metadata attributes. From now on you can use namespaces, hosts and container_names associated
with the logs.
Example usage of the new metadata
apiVersion: logging.banzaicloud.io/v1beta1
kind: Flow
metadata:
  name: flow-sample
spec:
  match:
    - exclude:
        labels:
          env: dev
        namespaces:
        - sandbox
        - dev
        hosts:
        - master01
        - master02
        - master03
    - select:
        container_names: sidecar
But why is all this important? Let’s go through a production scenario to illustrate the importance of these changes.
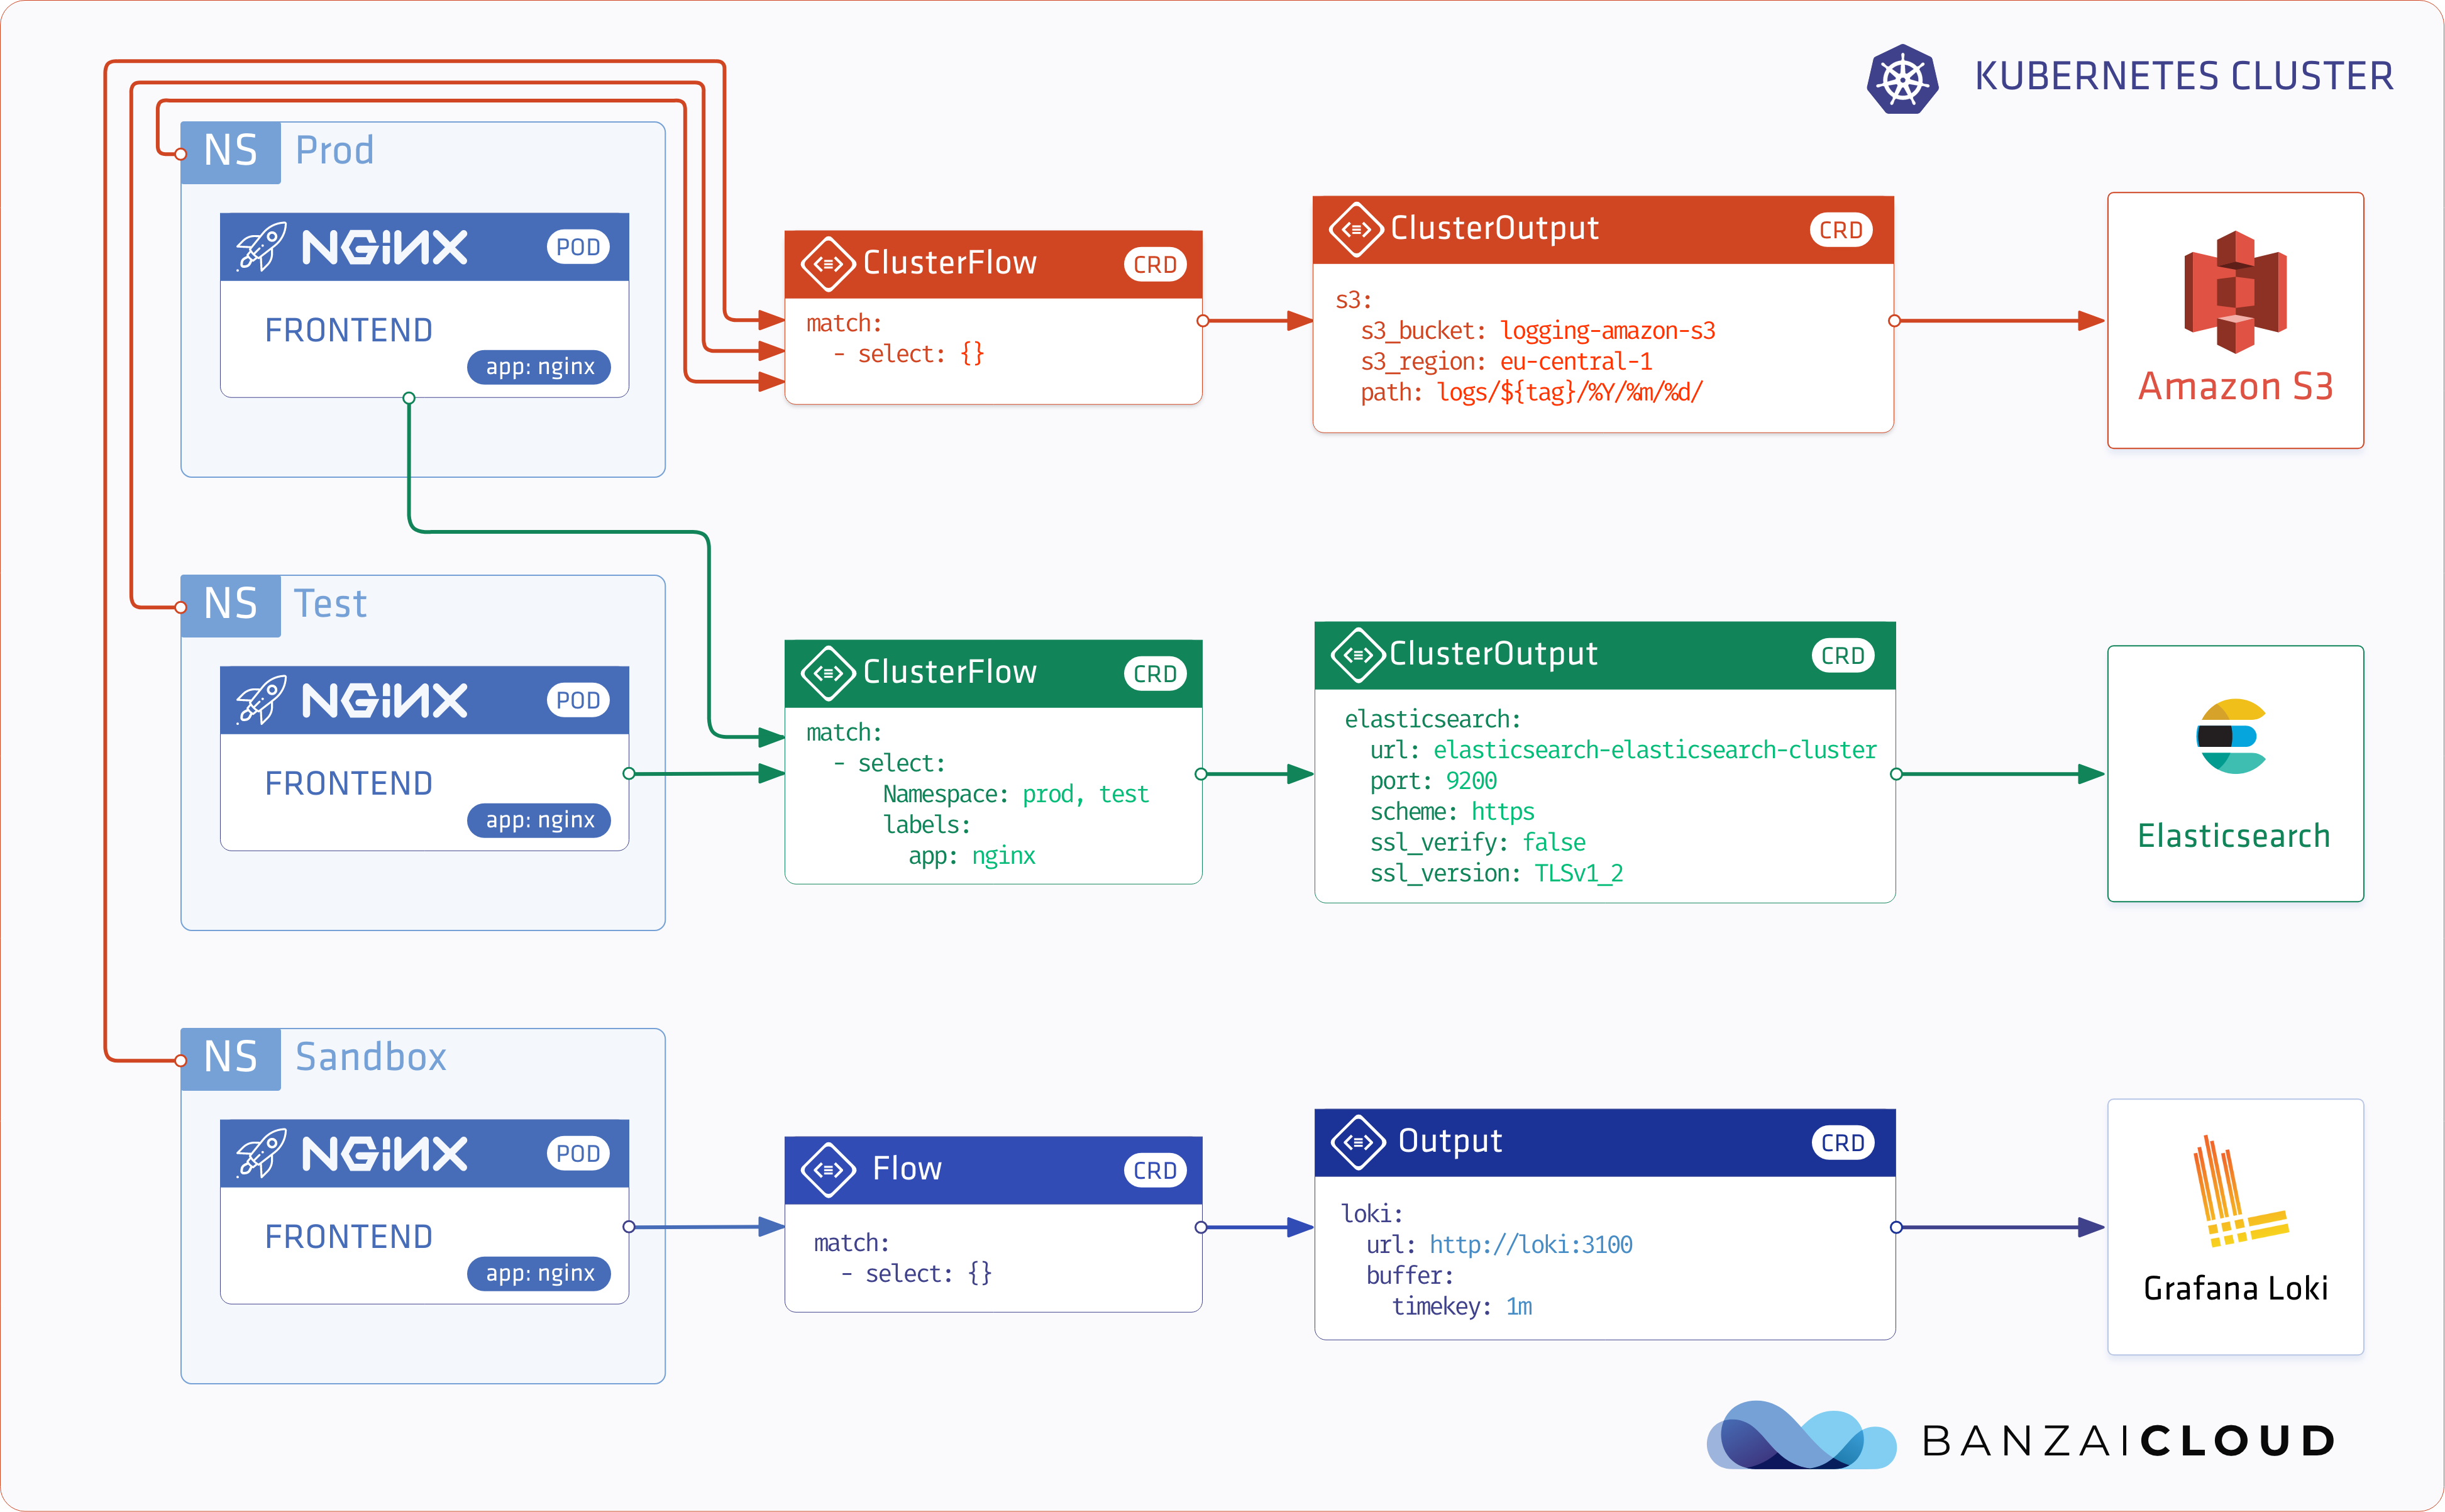
We want to archive every log message, so the first pattern we use is to archive everything. In this case searchability and indexing doesn’t matter. Why is this important? There can always be mistakes and you may not think about a log that could be really useful later.
apiVersion: logging.banzaicloud.io/v1beta1
kind: ClusterFlow
metadata:
  name: archive-everything
spec:
  match:
    - select: {}
  outputRefs:
    - s3-archive
So we have every record stored but it takes some time to retrieve those logs. We want to have up-to-date information about our nginx instances’ access logs. We store those logs in Elasticsearch, so that we can visualize them in Kibana. It is common that our developers run custom nginx instances, so we specifically want logs from the prod and test namespaces.
Note: starting from version 3 you can define a list of namespaces in the ClusterFLow
apiVersion: logging.banzaicloud.io/v1beta1
kind: ClusterFlow
metadata:
  name: nginx
spec:
  match:
    - select:
        labels:
          app: nginx
        namespaces:
        - prod
        - test
  outputRefs:
    - elasticsearch-nginx
We also have a sandbox namespace for developers to try new things out. They decided to use Loki for development purposes. They can create their disposable Loki instance in this namespace. By creating a Flow with an empty selector and with the Loki output this scenario is handled as well.
Note: logging operator takes care of routing and duplicating log messages for different flows as well.
apiVersion: logging.banzaicloud.io/v1beta1
kind: Flow
metadata:
  name: debug-logs
  namespace: sandbox
spec:
  match:
    - select: {}
  outputRefs:
    - sandbox-loki
‘nuff of raw yaml’s, what’s next? 🔗︎
The logging operator handles quite a few scenarios already but there is still lots of room for improvement. Among our customers there is an increasing need to collect logs from multiple clusters running in different datacenters or clouds, in an automated way.
If you are not familiar with our Pipeline platform note that we allow our customers to build multi and hybrid clouds with Kubernetes in 4 different ways
Collecting logs from these Kubernetes clusters are paramount for them, but collecting logs from external sources and inspecting them is equally important. These complex scenarios are handled by our ultimate observability product One Eye, which brings log inspection, correlation with metrics/traces and logging operator extensions (as host logs, kubelet, cloudwatch, systems, K8s event logs, EKS controlplane logs, etc). If you’d like to check One Eye from the perspective of federated monitoring, please read our post about the Thanos Operator.
One Eye can handle CRDs, dependencies to manage observability tools from CLI or even from your own CICD system and it comes with a nice UI, where you can visually define, (re)configure or check the logging operator logging flows.