One of the core features of our application and devops container management solution, the Banzai Cloud Pipeline platform, is multi-dimensional autoscaling based on default and custom metrics. Most such solutions gather Prometheus metrics and base Horizontal Pod Autoscaling only on basic CPU & memory metrics. However, scaling on these metrics is often not flexible enough to adapt to the increased load and traffic.
Therefore, Banzai Cloud Pipeline allows you to scale based on:
- custom Prometheus metrics, and
- complex Prometheus queries.
In addition, with the wide adoption of Istio-based service meshes, autoscaling based on custom Istio metrics becomes also possible. Network metrics, latencies, failure rates, and many more metrics can be scraped from Istio with our Istio operator and are now available on Prometheus, so you can use them to make scaling decisions with our HPA operator.
Learn more about the different types of autoscaling features supported and automated by the Banzai Cloud Pipeline platform platform:
tl;dr 🔗︎
- An introduction to redesigned custom metrics support in Pipeline and its HPA Operator.
- An example of autoscaling a Spring Boot deployment using Istio metrics from Prometheus
- A deep dive behind the scenes into what happens when you add a custom metric
- A summary of our switch to another Custom Metrics Adapter, the kube-metrics-adapter
Redesigned support for custom metrics 🔗︎
For the reasons listed above, we’ve decided to go with another Custom Metrics Adapter, the [kube-metrics-adapter] (https://github.com/zalando-incubator/kube-metrics-adapter).
kube-metrics-adapter is a general purpose metrics adapter that can collect and serve metrics from multiple sources. For each source there’s a Collector implementation; for now, we are most interested in its Prometheus collector.
The Prometheus Collector is a generic collector. It maps Prometheus queries to metrics that can be used for deployment autoscaling by an HPA controller. Its approach differs from that of the Prometheus Adapter, which has a predefined ruleset - contains queries that are run against Prometheus and is used to transform metrics into custom metrics - executed periodically. All matching metrics are fetched (since these queries have to be generic and target all pods and deployments), transformed and exposed as custom metrics. In contrast, Prometheus collector only collects metrics returned by custom queries, whose definitions vary by deployment, and target only a single deployment/pod or service, reducing the total number of metrics stored. One downside to this solution is that, currently, it’s up to the user to avoid queries that perform poorly.
Autoscale a Spring Boot application using Istio 🔗︎

I’ve selected one of our popular spotguides, the Sprint Boot with MySQL database, in order to quickly launch a lightweight web application container alongside a MySQL server. I’m using Banzai Pipeline Beta to rapidly boot up a Kubernetes cluster on any one of the six cloud providers we support, or on-prem. Prometheus & Grafana Monitoring, as well as Istio, are default features, and can easily be turned on with a UI switch (Pipeline handles the rest). In this example, I’ll launch a Kubernetes cluster on Google Cloud with Monitoring and Service Mesh turned on, and deploy a Spring Boot Spotguide on top of it. Cluster creation is part of our spotguide's wizard, however, since Service Mesh is a relatively new feature in Pipeline, we cannot (as of yet) enable it from the spotguide's flow, so we’ll have to create the cluster beforehand.
I’ve recorded these steps in the short video below:
Once you have your Spring Boot container and MySQL server up and running, you can pull the link to the demo application https://spring-boot-custom-metrics-demo.sancyx5g25.sancyx.try.pipeline.banzai.cloud/actuator/health/kubernetes from the Spotguide Summary page. This is a demo application, and a good starting point for typical Spring web applications. A GitHub repo has already been created, where you can find a kind of skeleton code (just like with our other spotguides). By default, the application url will only return a health check status, which is wired into Kubernetes’ liveness & readiness checks. Then, JVM metrics will be exposed to Prometheus and the repo will be integrated into our CI/CD flow, so, once you commit your business logic, it will be automatically deployed to the cluster. Read more about our spotguides, here.
Note: The Pipeline CI/CD module mentioned in this post is outdated and not available anymore. You can integrate Pipeline to your CI/CD solution using the Pipeline API. Contact us for details.
You can download the Kubernetes config from the cluster list or details page to get the kubectl access to the cluster you will need later from your local machine.
I’m using the hey tool (go get -u github.com/rakyll/hey) to generate a load against the Spring application; the command below will issue 50 requests per second, 10000 requests in total:
hey -n 10000 -q 50 https://spring-boot-custom-metrics-demo.sancyx5g25.sancyx.try.pipeline.banzai.cloud/actuator/health/kubernetes
Now, open Monitoring (link available in our Spotguide Summary or Cluster details page) to check out the metrics that are available and to decide on your Prometheus query. Because we enabled Service Mesh, all network communications will be routed through Envoy proxies, sending metrics to the Istio Telemetry service, which is scraped by Prometheus.
I’ll base my example query on the istio_requests_total metric, which is related to the Spring containers:
sum(rate(istio_requests_total{destination_service="spring-boot-custom-metrics-demo-spotguide-spring-boot.default.svc.cluster.local",destination_service_name="spring-boot-custom-metrics-demo-spotguide-spring-boot",destination_service_namespace="default",destination_workload="spring-boot-custom-metrics-demo-spotguide-spring-boot"}[1m]))
Make sure to add the appropriate label filters in order to exclusively select those metrics relevant to your pod/deployment.
Select the spring-boot-custom-metrics-demo-spotguide-spring-boot deployment from the Horizontal Pod Autoscaler menu on the deployment list page to reach the HPA Edit page. There, you can set up cpu, memory and custom metrics, by entering the name of a custom metric or query.
Now, if you generate another load (50 request/sec) for a longer period of time, the replica count should be increased in the HPA belonging to the deployment:
hey -n 50000 -q 50 https://spring-boot-custom-metrics-demo.sancyx5g25.sancyx.try.pipeline.banzai.cloud/actuator/health/kubernetes

...

kubectl get hpa

NAME                                                   REFERENCE                                                 TARGETS      MINPODS   MAXPODS   REPLICAS   AGE
spring-boot-custom-metrics-demo-spotguide-spring-boot   Deployment/spring-boot-custom-metrics-demo-spotguide-spring-boot   245866m/40   1         10        7          80s
After the load has ended, the number of replicas will slowly be reduced to their default minimum value:
kubectl get hpa

NAME                                                   REFERENCE                                                 TARGETS   MINPODS   MAXPODS   REPLICAS   AGE
spring-boot-custom-metrics-demo-spotguide-spring-boot   Deployment/spring-boot-custom-metrics-demo-spotguide-spring-boot   266m/40   1         10        1          32m
Behind the scenes 🔗︎
Let’s take a deep dive into what happens behind the scenes when you add a custom metric to a deployment using the Pipeline UI. The flow is very much like it is with resource metrics, which you may be familiar with from a previous series of posts, but for now, let’s focus on the API & annotation changes related to custom metrics.
The Pipeline UI uses HPA API to create/update metrics:
PUT {{pipeline_url}}/api/v1/orgs/:orgId/clusters/:clusterId/hpa

{
  "scaleTarget": "example-deployment-name",
  "minReplicas": 1,
  "maxReplicas": 10,
  "customMetrics": {
    "customMetricName": {
      "query": "sum({kubernetes_pod_name=~\"^example-deployment-name-pod.*\",__name__=~\"example-metric-name\"})",
      "targetAverageValue": "100"
    }
  }
}
You can use targetValue instead of targetAverageValue, if you want to specify an absolute value. The difference is that the metric values obtained by targetAverageValue are averaged using the current pod replica count.
What Pipeline actually does is add the following annotations to your deployment:
    hpa.autoscaling.banzaicloud.io/maxReplicas=10
    hpa.autoscaling.banzaicloud.io/minReplicas=1
    prometheus.customMetricName.hpa.autoscaling.banzaicloud.io/query=sum({kubernetes_pod_name=~\"^example-deployment-name-pod.*\",__name__=~\"example-metric-name\"})
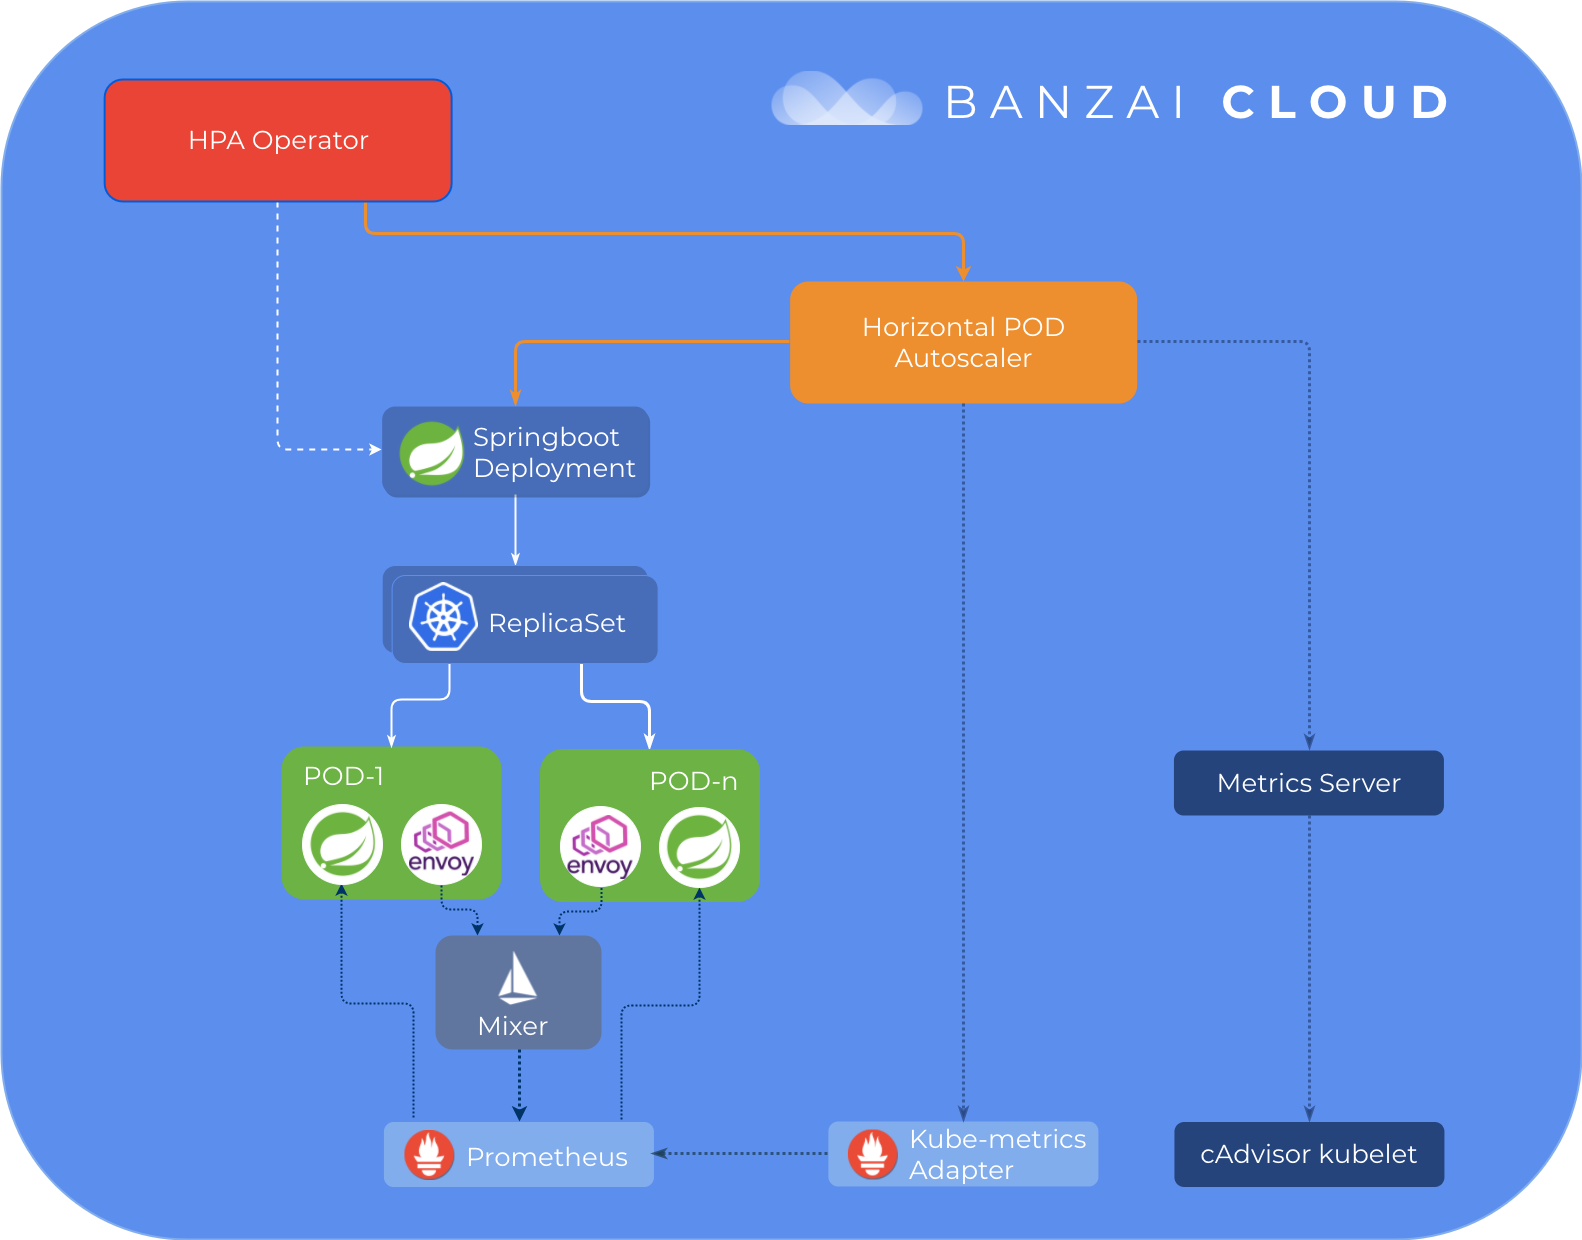
All this is achieved through the HPA operator, which manages HPA resources based on deployment annotations. Pipeline deploys an HPA operator chart in a post hook after cluster creation is complete, which then deploys the kube-metrics-adapter chart and metrics-server, in case metrics.api hasn’t been registered. This process may vary depending on your cloud provider and K8s version, which may already have some of these features installed.
In our case, the freshly created HPA object will look like this:
apiVersion: v1
items:
- apiVersion: autoscaling/v1
  kind: HorizontalPodAutoscaler
  metadata:
    annotations:
    ...
      autoscaling.alpha.kubernetes.io/current-metrics: '[{"type":"Object","object":{"target":{"kind":"Pod","name":"example-deployment-name-customMetricName","apiVersion":"v1"},"metricName":"customMetricName","currentValue":"222m"}}]'
      autoscaling.alpha.kubernetes.io/metrics: '[{"type":"Object","object":{"target":{"kind":"Pod","name":"example-deployment-name-customMetricName","apiVersion":"v1"},"metricName":"customMetricName","targetValue":"40"}}]'
      metric-config.object.customMetricName.prometheus/per-replica: "true"
      metric-config.object.customMetricName.prometheus/query: sum({kubernetes_pod_name=~\"^example-deployment-name-pod.*\",__name__=~\"example-metric-name\"})
    ...
  spec:
    maxReplicas: 10
    minReplicas: 1
    scaleTargetRef:
      apiVersion: apps/v1
      kind: Deployment
      name: example-deployment-name
  status:
    currentReplicas: 1
    desiredReplicas: 1
kind: List
metadata:
  resourceVersion: ""
  selfLink: ""
Notice that the custom metric is of the Object type, and is bound to a Pod resource with the name example-deployment-name-customMetricName. Kube-metrics-adapter also uses the annotation query to obtain a metric value, which is exposed at the following endpoint /apis/custom.metrics.k8s.io/v1beta1/namespaces/default/pods/example-deployment-name-customMetricName/customMetricName and is exactly where the HPA controller will be looking:
$ kubectl get --raw "/apis/custom.metrics.k8s.io/v1beta1/namespaces/default/pods/*/customMetricName" | jq .
{
  "kind": "MetricValueList",
  "apiVersion": "custom.metrics.k8s.io/v1beta1",
  "metadata": {
    "selfLink": "/apis/custom.metrics.k8s.io/v1beta1/namespaces/default/pods/%2A/customMetricName"
  },
  "items": [
    {
      "describedObject": {
        "kind": "Pod",
        "namespace": "default",
        "name": "example-deployment-name-customMetricName",
        "apiVersion": "v1"
      },
      "metricName": "customMetricName",
      "timestamp": "2019-03-13T20:23:32Z",
      "value": "222m"
    }
  ]
}
Happy Autoscaling!
About Banzai Cloud Pipeline 🔗︎
Banzai Cloud’s Pipeline provides a platform for enterprises to develop, deploy, and scale container-based applications. It leverages best-of-breed cloud components, such as Kubernetes, to create a highly productive, yet flexible environment for developers and operations teams alike. Strong security measures — multiple authentication backends, fine-grained authorization, dynamic secret management, automated secure communications between components using TLS, vulnerability scans, static code analysis, CI/CD, and so on — are default features of the Pipeline platform.


