


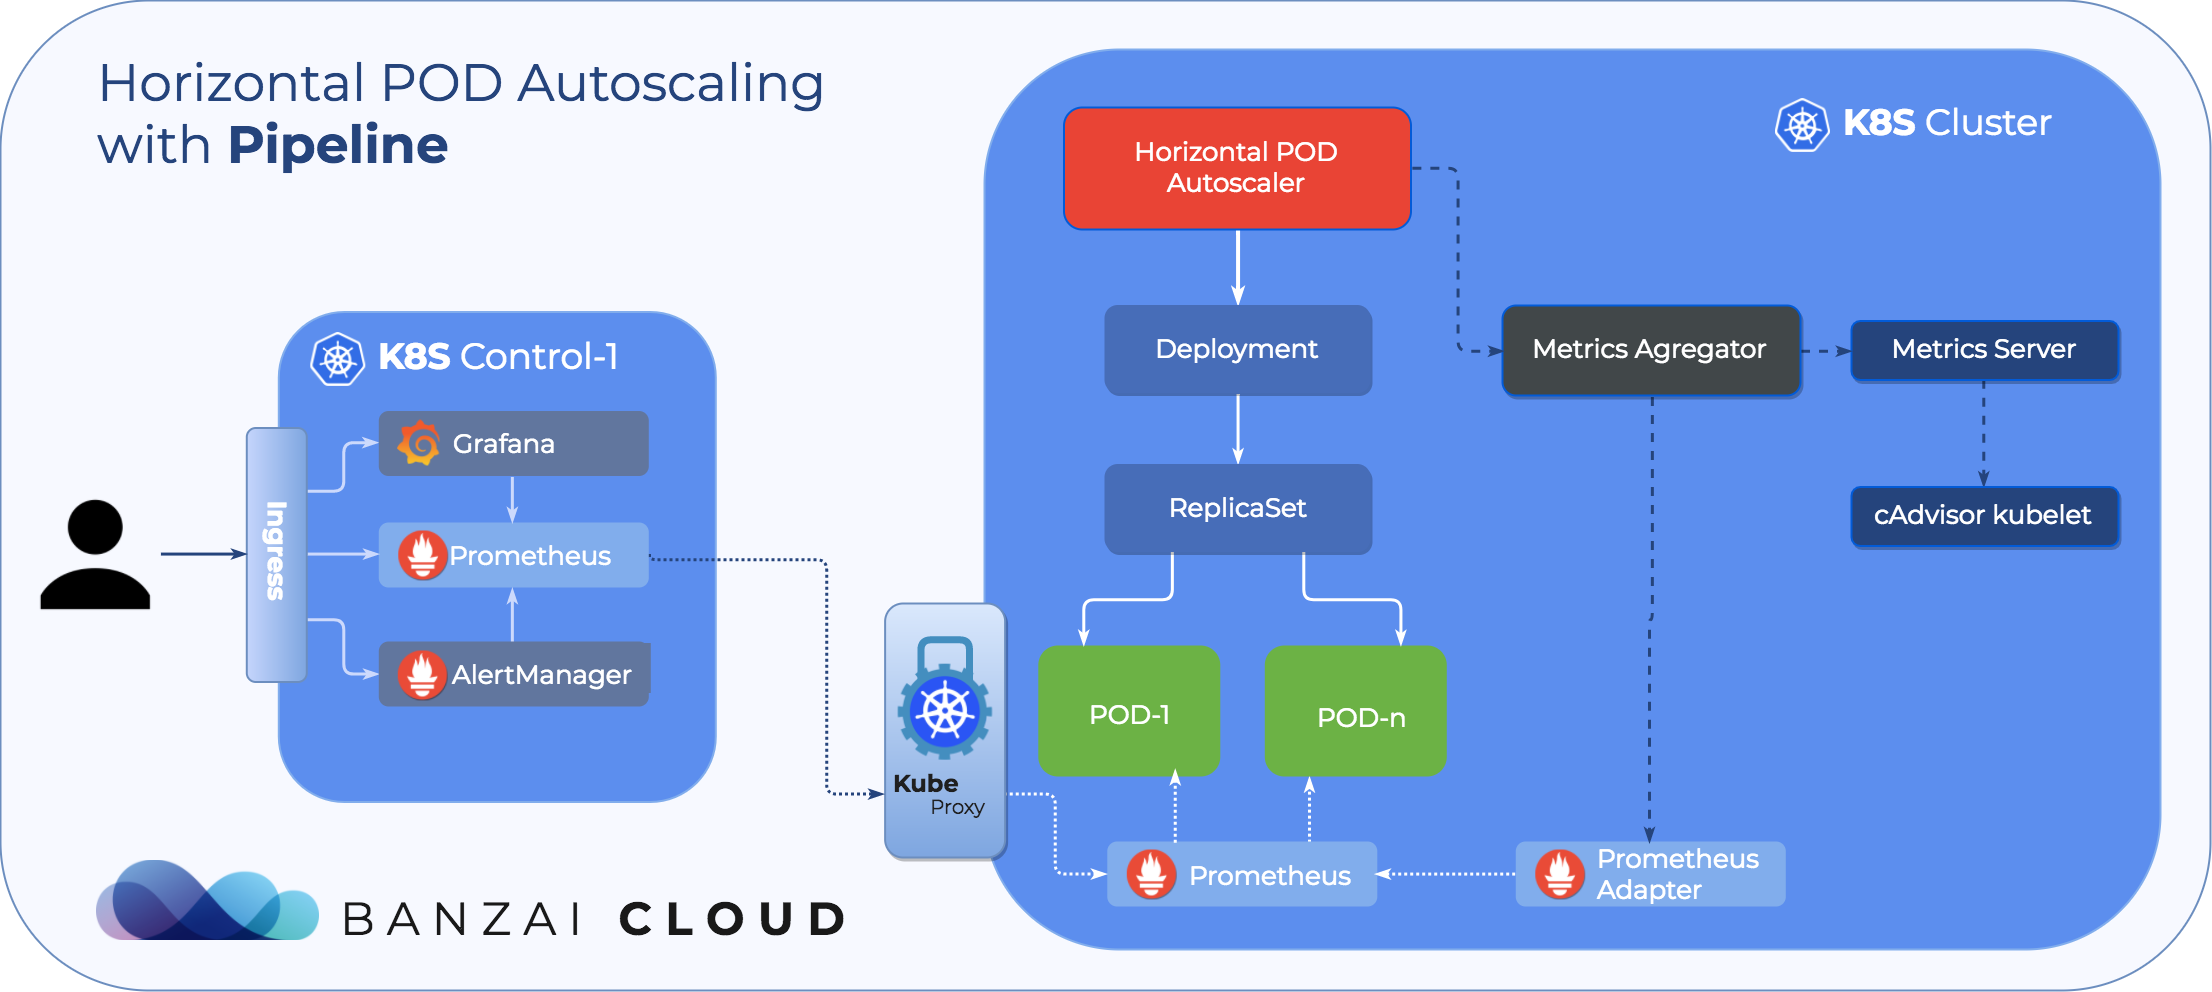
If you followed our blog series on Autoscaling on Kubernetes, you should already be familiar with Kubernetes’ Cluster autoscaler and the Vertical Pod Autoscaler used with Java 10 applications. This post will show you how to use the Horizontal Pod Autoscaler to autoscale your deployments based on custom metrics obtained from Prometheus. As a deployment example we’ve chosen our JEE Petstore example application on Wildfly to show that, beside metrics like cpu and memory, which are provided by default on Kubernetes, using our Wildfly Operator, all Java and Java Enterprise Edition / Wildfly specific metrics are automatically placed at your fingertips, available in Prometheus, allowing you to easily autoscale deployments.
Learn more about the different types of autoscaling features supported and automated by the Banzai Cloud Pipeline platform platform:
tl;dr: 🔗︎
The Pipeline platform supports and configures all these autoscaling options for you - with out of the box monitoring and metrics.
For custom metrics we open sourced Helm charts to deploy Metrics Adapter for Prometheus and Metrics Server in our Banzai Cloud Chart repository.
How Horizontal Pod Autoscaler works 🔗︎
Before we start, let’s recap the basic idea of autoscaling in Kubernetes. Autoscaling has two dimensions:
- Cluster Autoscaling, which deals with node scaling operations
- And the Horizontal Pod Autoscaler, which automatically scales the number of pods in a deployment or replica set
Cluster Autoscaling, together with the Horizontal Pod Autoscaler, can be used to dynamically adjust computing power, as well as the level of parallelism that your system needs to meet SLAs. While Cluster Autoscaling is highly dependent on the underlying capabilities of the cloud provider that’s hosting your cluster, the HPA operates independently of your IaaS/PaaS provider.
The HPA is included in Kubernetes by default, and is implemented as a control loop, with a period controlled by the controller manager’s --horizontal-pod-autoscaler-sync-period flag, whose default value is 30 seconds.
The controller manager queries resource utilization against the metrics specified in each HorizontalPodAutoscaler definition.
Note that the Vertical Pod Autoscaler is a
specialcase - for further information about VPA read this post
There are three kinds of metrics:
- per-pod resource metrics - like
cpu,memorywhose metrics are fetched from the resource metrics API for each pod targeted by the HorizontalPodAutoscaler, then compared against atargetAverageUtilizationvalue or a rawtargetAverageValuevalue. - per-pod custom metrics - like per-pod resource metrics, but which are fetched from the custom metrics API and for who you can’t specify
targetAverageUtilizationvalues, only rawtargetAverageValuevalues. - object metrics - a single metric that is fetched (which describes the object in question), and compares it to the target value
Metrics are fetched either from the resource metrics API (for per-pod resource metrics), or custom ones from Custom Metrics API. The latter was introduced in Kubernetes 1.6, and enables HPA to access arbitrary metrics. Kubernetes 1.7 introduced the aggregation layer that allows 3rd party applications to extend the Kubernetes API by registering themselves as API add-ons. The Custom Metrics API, along with the aggregation layer, make it possible for monitoring systems like Prometheus to expose application-specific metrics to the HPA controller.
A Pipeline deployment will automatically install and dynamically configure Prometheus to collect metrics in a centralized (or federated Prometheus) cluster
To start autoscaling your deployments, all you have to do is to create a HorizontalPodAutoscaler resource, like the one below, which is an example of how to scale replica count for a wildfly-example deployment based on average cpu and memory usage.
apiVersion: autoscaling/v2beta1
kind: HorizontalPodAutoscaler
metadata:
  name: wildfly-example
spec:
  scaleTargetRef:
    apiVersion: extensions/v1beta1
    kind: Deployment
    name: wildfly-example
  minReplicas: 1
  maxReplicas: 5
  metrics:
  - type: Resource
    resource:
      name: cpu
      targetAverageUtilization: 80
  - type: Resource
    resource:
      name: memory
      targetAverageValue: 1000Mi
As we’ve said, HPA is included by default in Kubernetes, while in order to use custom metrics you have to deploy Metrics Adapter for Prometheus so that the Metrics Server is able to query Prometheus.
You can find Helm charts to deploy Metrics Adapter for Prometheus and Metrics Server in our Chart repository.
It’s important to check your relabel rules in Prometheus for kubernetes-pods, because Metrics Server searches by pod and namespace, so they should be targeted as follows:
- source_labels: [__meta_kubernetes_namespace]
  action: replace
  target_label: namespace
- source_labels: [__meta_kubernetes_pod_name]
  action: replace
  target_label: pod
Example of scaling an example JEE application using custom metrics from Prometheus 🔗︎
As usual, our starting point requires that we have a cluster up and ready. To create a Kubernetes cluster in any of the supported cloud providers with Pipeline, follow the steps described in our previous post about Cluster Autoscaler.
Since Cluster Autoscaler and Horizontal Pod Autoscaler are complimentary, we advise that you enable autoscaling for your node pools, so that they are automatically expanded.
Aggregation API is enabled by default on AKS from version 1.9.0 onwards, and the same is true for GKE clusters from version 1.7.0 onwards, so make sure you use at least version 1.9. When utilizing Amazon clusters, Pipeline takes care of enabling Aggregation API for you.
The below HTTP request examples are from our Postman collection described here. Use Postman collection Create Deployment requests to deploy Helm charts.
-
Deploy our Prometheus chart for Monitoring and
Prometheus AdapterPOST {{url}}/api/v1/orgs/{{orgId}}/clusters/{{cluster_id}}/deployments { "name": "banzaicloud-stable/pipeline-cluster-monitor" }Get release name from response and set in the url for
Prometheus Adapterdeployment:POST {{url}}/api/v1/orgs/{{orgId}}/clusters/{{cluster_id}}/deployments { "name": "banzaicloud-stable/prometheus-adapter", "values": { "prometheus": { "url": "http://{PROMETHUES_RELEASE_NAME}-prometheus-server.default.svc/prometheus" } } }TLS certificates are disabled by default. If you want to enable them, you have to set tls.enable=true and generate your certificates, and set tls.key & tls.certificate.
-
Install
Metrics Serverif you’re using Amazon or Azure (on GKE you have it by default)POST {{url}}/api/v1/orgs/{{orgId}}/clusters/{{cluster_id}}/deployments { "name": "banzaicloud-stable/metrics-monitor" } -
Make sure you’re able to query custom metrics from
Metrics Serverso the connection toPrometheus Adapterworks fine:kubectl get --raw "/apis/custom.metrics.k8s.io/v1beta1" | jq . -
Deploy
Wildfly operatorand JEE 7 Petstore Applicationwget https://raw.githubusercontent.com/banzaicloud/wildfly-operator/master/deploy/rbac.yaml wget https://raw.githubusercontent.com/banzaicloud/wildfly-operator/master/deploy/operator.yaml wget https://raw.githubusercontent.com/banzaicloud/wildfly-operator/master/deploy/cr.yaml kubectl apply -f .Wildfly Operator starts the Prometheus JMX exporter as a Java agent and attaches annotations necessary for Prometheus to scrape your pods. If you’re using other Java applications, you can use the Prometheus JMX Operator to get all these out of the box.
-
Generate load for Application
To this end we will use a simple
Goload generator app, which makes number GET requests concurrently to a certain URL. First obtain the Application endpoint:kubectl describe WildflyAppServer Status: External Addresses: Application: 35.225.18.78:8080 Management: 35.225.18.78:9990 Nodes: wildfly-example-65c687d55f-fr4g7Install and run load test:
go get -u github.com/rakyll/hey hey -n 10000 -q 15 http://35.225.18.78:8080/applicationPetstore/shopping/searchresult.xhtml -
List available POD related metrics from Metrics API
kubectl get --raw "/apis/custom.metrics.k8s.io/v1beta1" | jq . | grep "pods/"Alternatively, you can open up the
PrometheusUI to check all the available metrics and choose the right ones.For demonstrative purposes, and to simulate a realistic use case, we inserted a random sleep time in our Petstore Application code. As a result of the load test we see that
org_xnio_Xnio_BusyWorkerThreadCounthas increased sharply, and so we choose this metric. -
Create HorizontalPodAutoscaler resource
    apiVersion: autoscaling/v2beta1
    kind: HorizontalPodAutoscaler
    metadata:
      name: wildfly-example
    spec:
      scaleTargetRef:
        apiVersion: extensions/v1beta1
        kind: Deployment
        name: wildfly-example
      minReplicas: 1
      maxReplicas: 5
      metrics:
      - type: Pods
        pods:
          metricName: **org_xnio_Xnio_BusyWorkerThreadCount**
          targetAverageValue: 10
After some time, if you describe your HPA you should see something like the below:
    kubectl describe hpa wildfly-example
    Name:                                             wildfly-example
    Namespace:                                        default
    Labels:                                           <none>
    Annotations:                                      <none>
    CreationTimestamp:                                Wed, 27 Jun 2018 01:19:35 +0200
    Reference:                                        Deployment/wildfly-example
    Metrics:                                          ( current / target )
      "org_xnio_Xnio_BusyWorkerThreadCount" on pods:  17 / 10
    Min replicas:                                     1
    Max replicas:                                     10
    Conditions:
      Type            Status  Reason              Message
      ----            ------  ------              -------
      AbleToScale     False   BackoffBoth         the time since the previous scale is still within both the downscale and upscale forbidden windows
      ScalingActive   True    ValidMetricFound    the HPA was able to successfully calculate a replica count from pods metric org_xnio_Xnio_BusyWorkerThreadCount
      ScalingLimited  False   DesiredWithinRange  the desired count is within the acceptable range
    Events:
      Type     Reason                        Age   From                       Message
      ----     ------                        ----  ----                       -------
      Normal   SuccessfulRescale             2m    horizontal-pod-autoscaler  New size: 4; reason: pods metric org_xnio_Xnio_BusyWorkerThreadCount above target
What’s next 🔗︎
At Banzai Cloud Prometheus is one of our favorite tools. It’s no surprise that we’re very enthusiastic about autoscaling based on metrics obtained from Prometheus, and we’re continuing to explore possibilities that will allow us to autoscale based on, not just simple metrics, but more complex Prometheus queries, so stay tuned.
Learn more about the different types of autoscaling features supported and automated by the Banzai Cloud Pipeline platform platform: