


A few weeks ago we opensourced our Koperator , the engine behind our Kafka Spotguide - the easiest way to run Apache Kafka on Kubernetes when it’s deployed to multiple clouds or on-prem, with out-of-the-box monitoring, security, centralized log collection, external access and more.
One of our customers’ preferred features is the ability of our
Koperator
to react to custom alerts, in combination with the default options we provide: options like cluster upscaling, adding new Brokers, cluster downscaling, removing Brokers or adding additional disks to a Broker. As previously discussed - and this is also the case with the
Koperator
- all services and deployments in the Pipeline platform include free Prometheus-based monitoring, dashboards and default alerts.
In today’s post let’s explore a practical example of how reactions to custom alerts work, when using the Koperator .
Note that all the manual steps below are unnecessary when you deploy through Pipeline, and use the Kafka Spotguide.
Monitoring, alerts and actions 🔗︎
Our core belief is that our operator (and all of Pipeline’s components) should react, not only to Kubernetes-related events, but according to application specific custom metrics. We make it simple to trigger an action or monitor a default Kubernetes metric, but we’ve also made a concerted effort to support application-specific metrics, allowing our customers to act, react or scale accordingly.
This is also the case with low-level components - not just higher, Pipeline, plartform-level abstractions - like the Koperator . Since Prometheus is the de facto standard for monitoring in Kubernetes, we have built an alert manager inside the operator, to react to alerts defined in Prometheus.
Instructing the Koperator how to react to an alert is extremely easy; we simply put an annotation in the alert definition.
Now, let’s see how this works in the context of a specific example.
Simple alert rule 🔗︎
As you might have guessed, alert rules depend on a Kafka cluster’s configuration, so they differ from case to case (again, if you deploy Kafka with the Kafka Spotguide, all this is optimally configured and automated). Finding the right metrics, thresholds and durations is a process, and you should use them to fine tune your alerts.
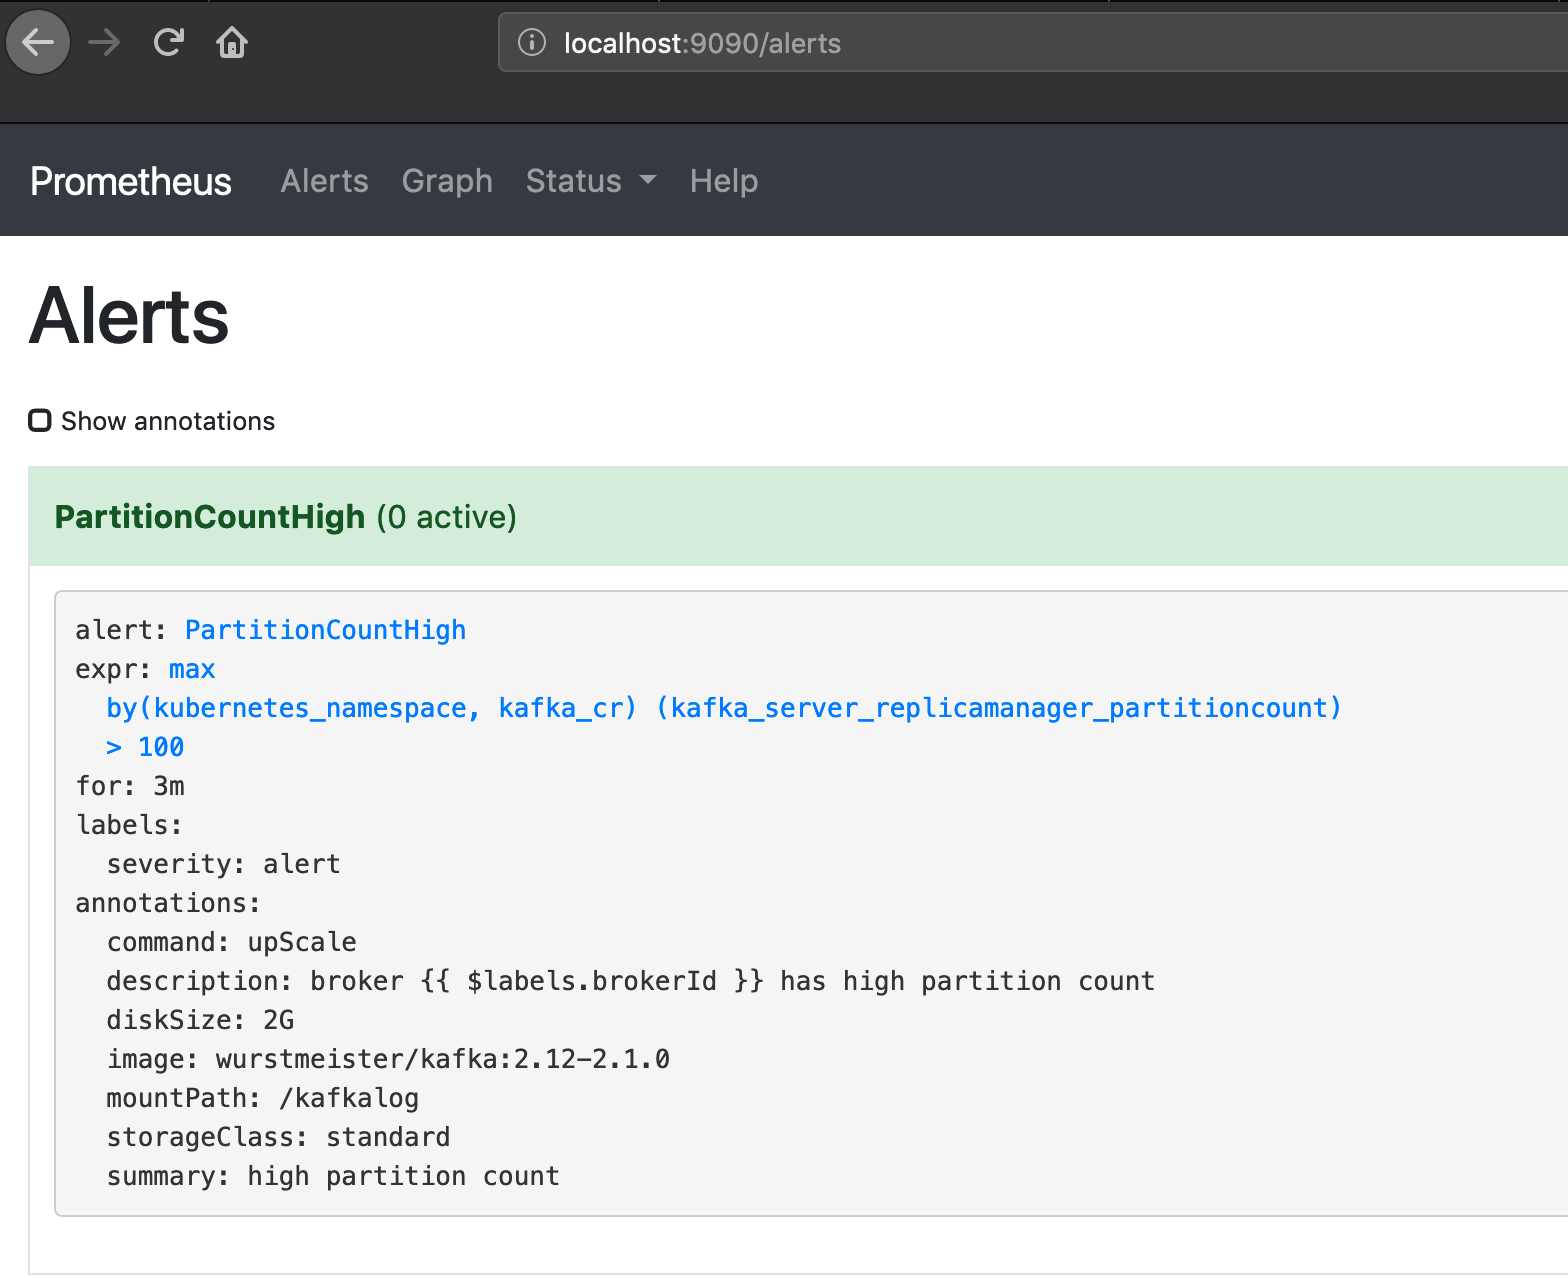
In this example we’re going to use the following alert rule:
prometheus:
  serverFiles:
    alerts:
      groups:
      - name: KafkaAlerts
        rules:
        - alert: PartitionCountHigh
          expr: max(kafka_server_replicamanager_partitioncount)  by (kubernetes_namespace, kafka_cr) > 100
          for: 3m
          labels:
            severity: alert
          annotations:
            description: 'broker {{ $labels.brokerId }} has high partition count'
            summary: 'high partition count'
            storageClass: 'standard'
            mountPath: '/kafkalog'
            diskSize: '2G'
            image: 'wurstmeister/kafka:2.12-2.1.0'
            command: 'upScale'
Prometheus will trigger an upScale action if a Kafka Brokers’ partition count rises above 100 for three minutes.
The
Koperator
requires some information to determine how to react to a given alert. We use specific annotations to accomplish that. There is, of course, the command annotation which determines the action, but users still need to specify, for example, a container image or a storageClass name.
Please save this snippet because we are going to use it later.
Scenario 🔗︎
Install Kafka and the ecosystem 🔗︎
For the purposes of this exercise, we’re going to assume that you already have a Kubernetes cluster up and running. If that’s not the case, you can deploy one with the Pipeline platform on any one of five major cloud providers, or on-prem.
Kafka requires Zookeeper, so please install a copy using the following commands (again, if you choose to use the Kafka Spotguide, this is automated for you).
We are going to use
helmto install the required resources
helm repo add banzaicloud-stable https://kubernetes-charts.banzaicloud.com/
helm install --name zookeeper-operator --namespace=zookeeper banzaicloud-stable/zookeeper-operator
Now, we have a Zookeeper operator that’s looking for a custom CR to instantiate a ZK cluster.
kubectl create --namespace zookeeper -f - <<EOF
apiVersion: zookeeper.pravega.io/v1beta1
kind: ZookeeperCluster
metadata:
  name: example-zookeepercluster
  namespace: zookeeper
spec:
  replicas: 3
EOF
Here, we’re using namespaces to separate Zookeeper and Kafka
kubectl get pods -n zookeeper
NAME                                  READY   STATUS    RESTARTS   AGE
example-zookeepercluster-0            1/1     Running   0          13m
example-zookeepercluster-1            1/1     Running   0          12m
example-zookeepercluster-2            1/1     Running   0          11m
zookeeper-operator-76f7545fbc-8jr9w   1/1     Running   0          13m
We have a three node Zookeeper cluster, so let’s move on and create the Kafka cluster itself.
helm install --name=kafka-operator --namespace=kafka banzaicloud-stable/kafka-operator -f <path_to_simple_alert_rule_yaml>
Now that the Koperator is running in the cluster, submit the CR which defines your Kafka cluster. For simplicity’s sake, we’re going to use the example from the operator’s GitHub repo.
wget https://github.com/banzaicloud/koperator/blob/0.3.2/config/samples/example-secret.yaml
wget https://github.com/banzaicloud/koperator/blob/0.3.2/config/samples/banzaicloud_v1alpha1_kafkacluster.yaml
kubectl create -n kafka -f example-secret.yaml
kubectl create -n kafka -f banzaicloud_v1alpha1_kafkacluster.yaml
We create a Kubernetes Secret before submitting our cluster definition because we’re using SSL for Broker communication.
*Tip: Use
kubensto switch namespaces in your context
kubectl get pods -n kafka
NAME                                                READY   STATUS    RESTARTS   AGE
cruisecontrol-5fb7d66fdb-zvx2s                      1/1     Running   0          6m15s
envoy-66cb98d85b-bzvj7                              1/1     Running   0          7m4s
kafka-operator-operator-0                           2/2     Running   0          8m40s
kafka-operator-prometheus-server-694fcf6d99-fv5k5   2/2     Running   0          8m40s
kafkacfn4v                                          1/1     Running   0          6m15s
kafkam5wm6                                          1/1     Running   0          6m15s
kafkamdpvr                                          1/1     Running   0          6m15s
kafkamzwt2                                          1/1     Running   0          6m15s
Before we move on, let’s check the registered Prometheus Alert rule and Cruise Control State.
kubectl port-forward -n kafka svc/cruisecontrol-svc 8090:8090 &
kubectl port-forward -n kafka svc/kafka-operator-prometheus-server 9090:80
Cruise Control UI will be available on localhost:8090 Prometheus UI will be available on localhost:9090
Everything is up and running, now let’s trigger an alert.
Please note that LinkedIn’s Cruise Control requires some time to become operational: up to 5-10 minutes.
Trigger the upScale action 🔗︎
In our case, simply creating a topic with a high number of partitions will trigger the registered alert. To do/simulate that, let’s create a pod inside the Kubernetes cluster.
kubectl create -n kafka -f - <<EOF
apiVersion: v1
kind: Pod
metadata:
  name: kafka-internal
spec:
  containers:
  - name: kafka
    image: wurstmeister/kafka:2.12-2.1.0
    # Just spin & wait forever
    command: [ "/bin/bash", "-c", "--" ]
    args: [ "while true; do sleep 3000; done;" ]
EOF

kubectl exec -it -n kafka kafka-internal bash
Inside the container, run the following commands to create the Kafka topic:
/opt/kafka/bin/kafka-topics.sh --zookeeper example-zookeepercluster-client.zookeeper:2181 --create --topic alertblog --partitions 30 --replication-factor 3
Kafka 2.2.0 support is on it’s way, which will support creating topics via Kafka itself.
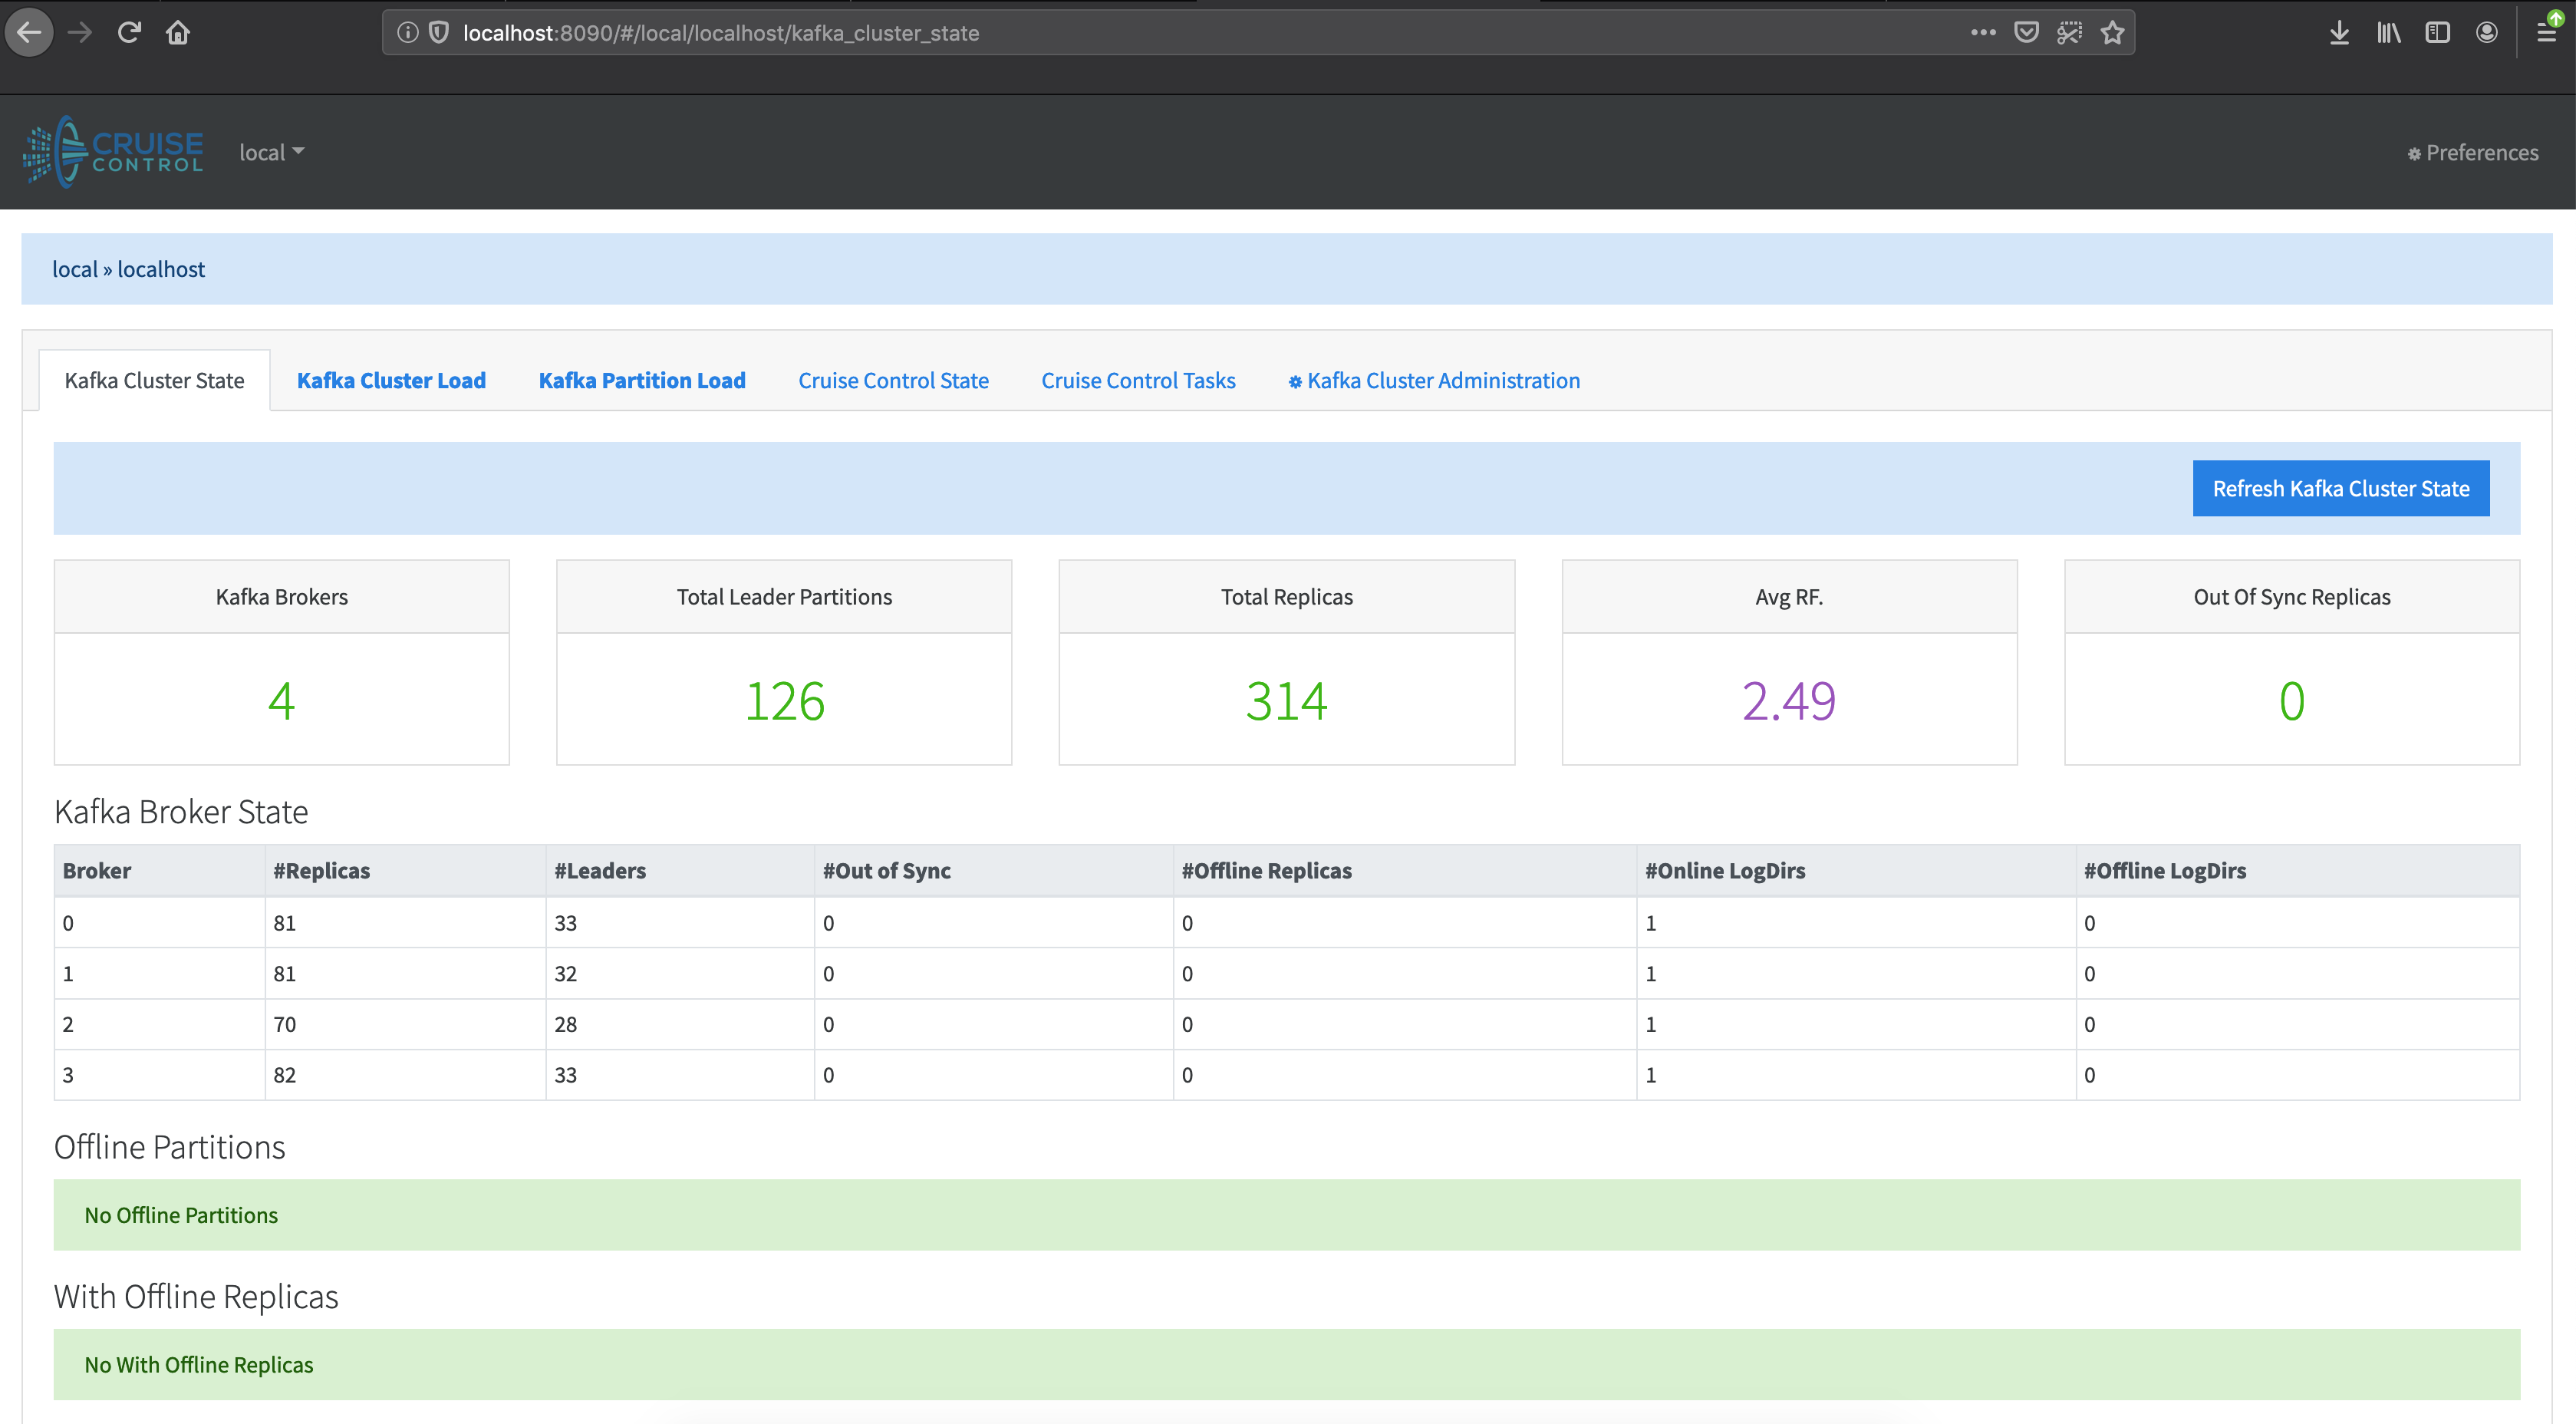
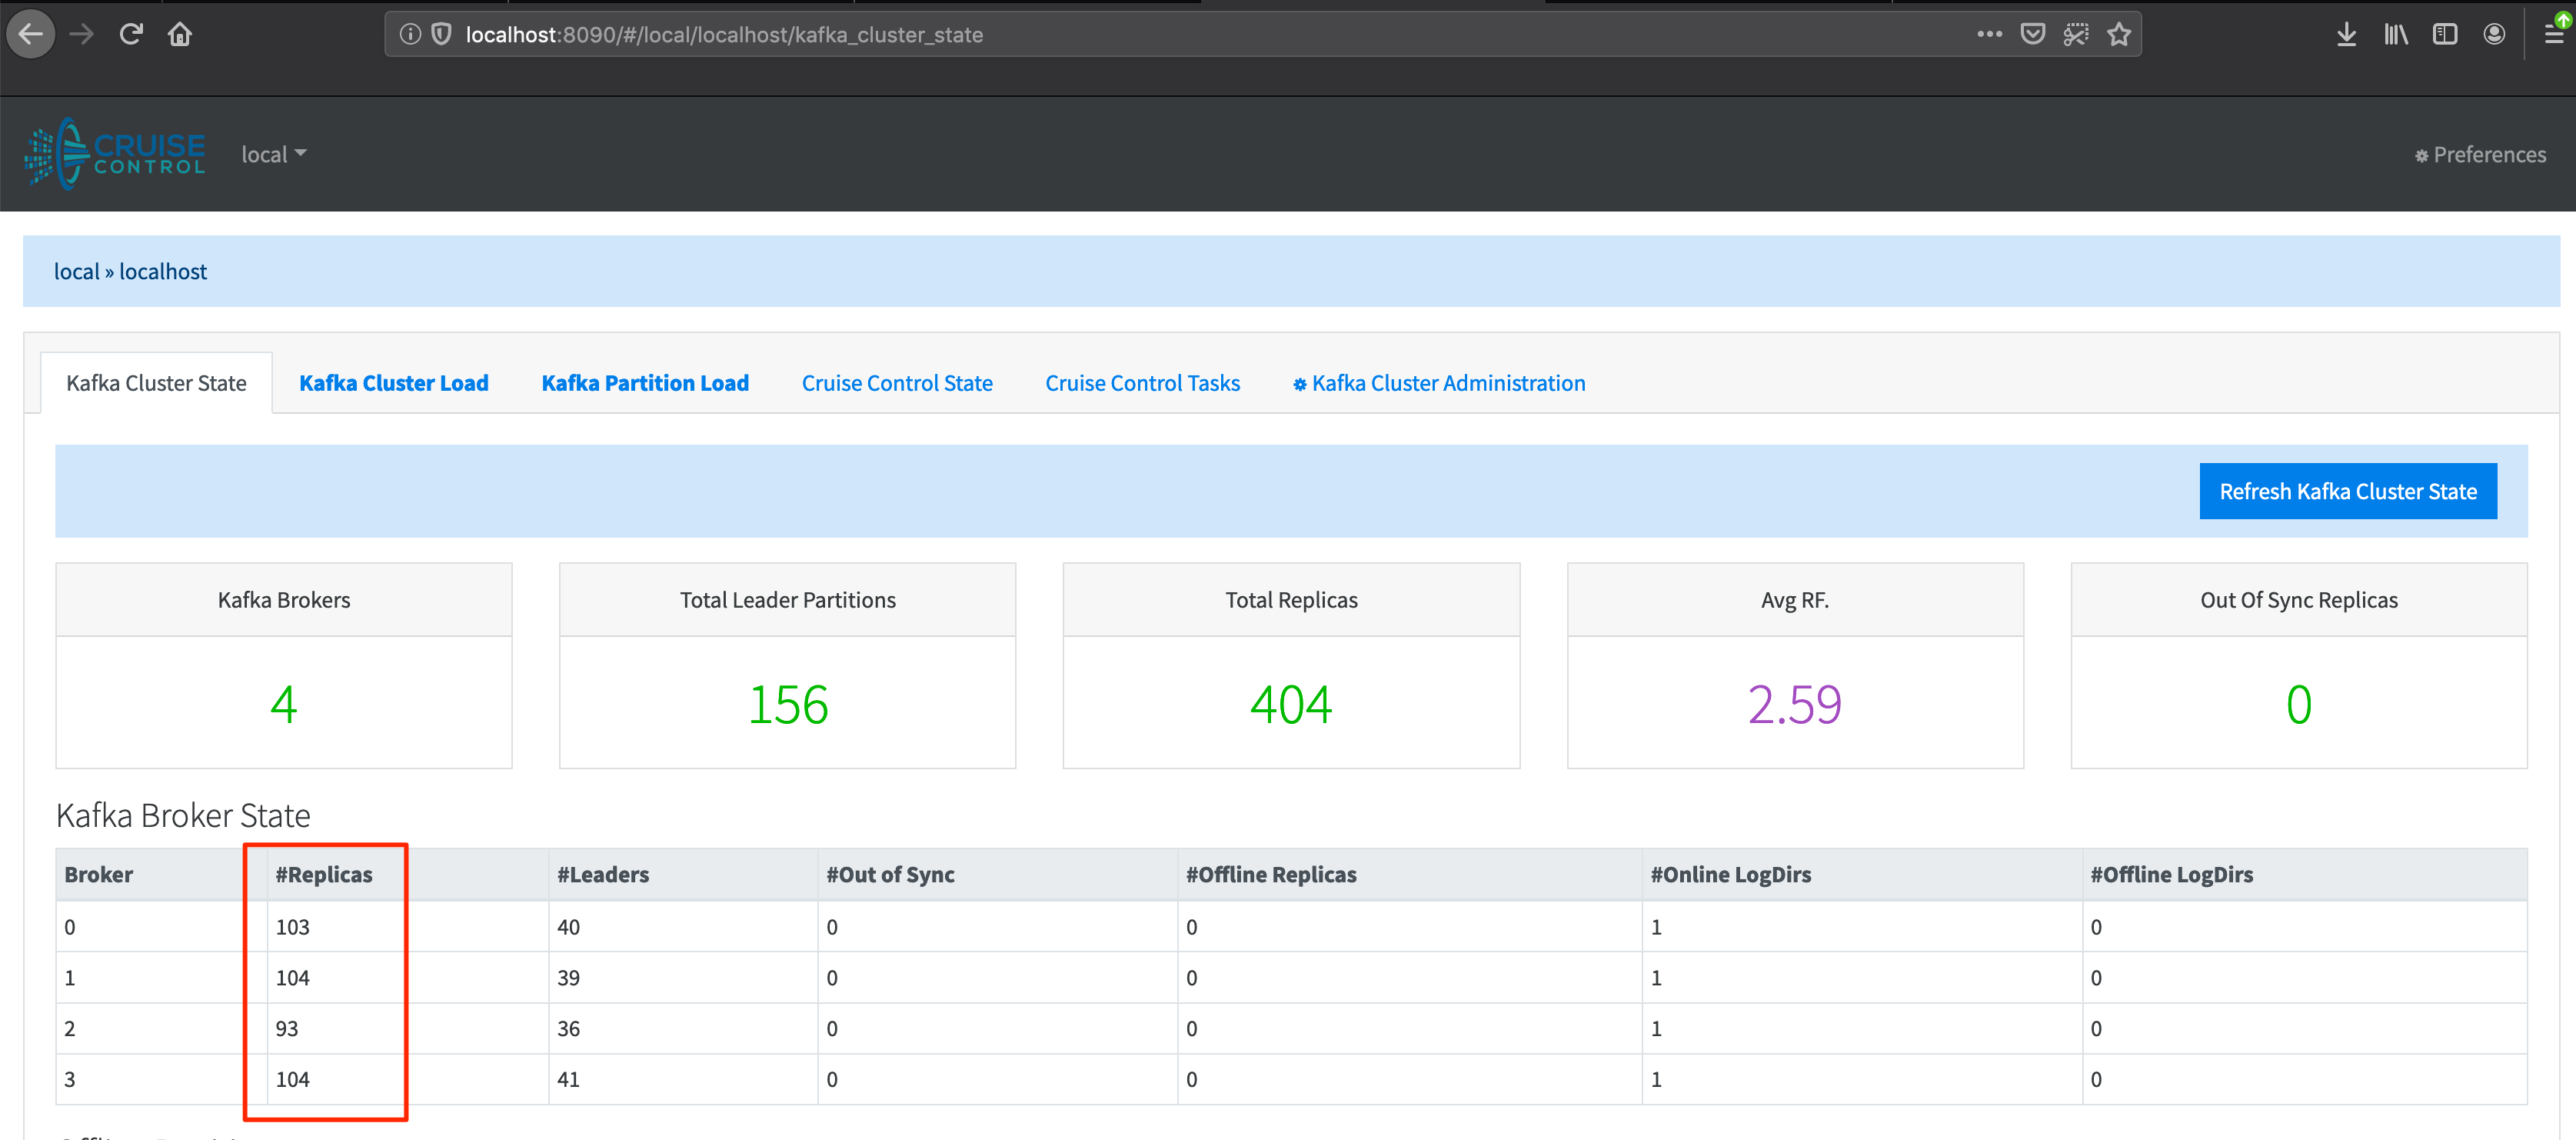
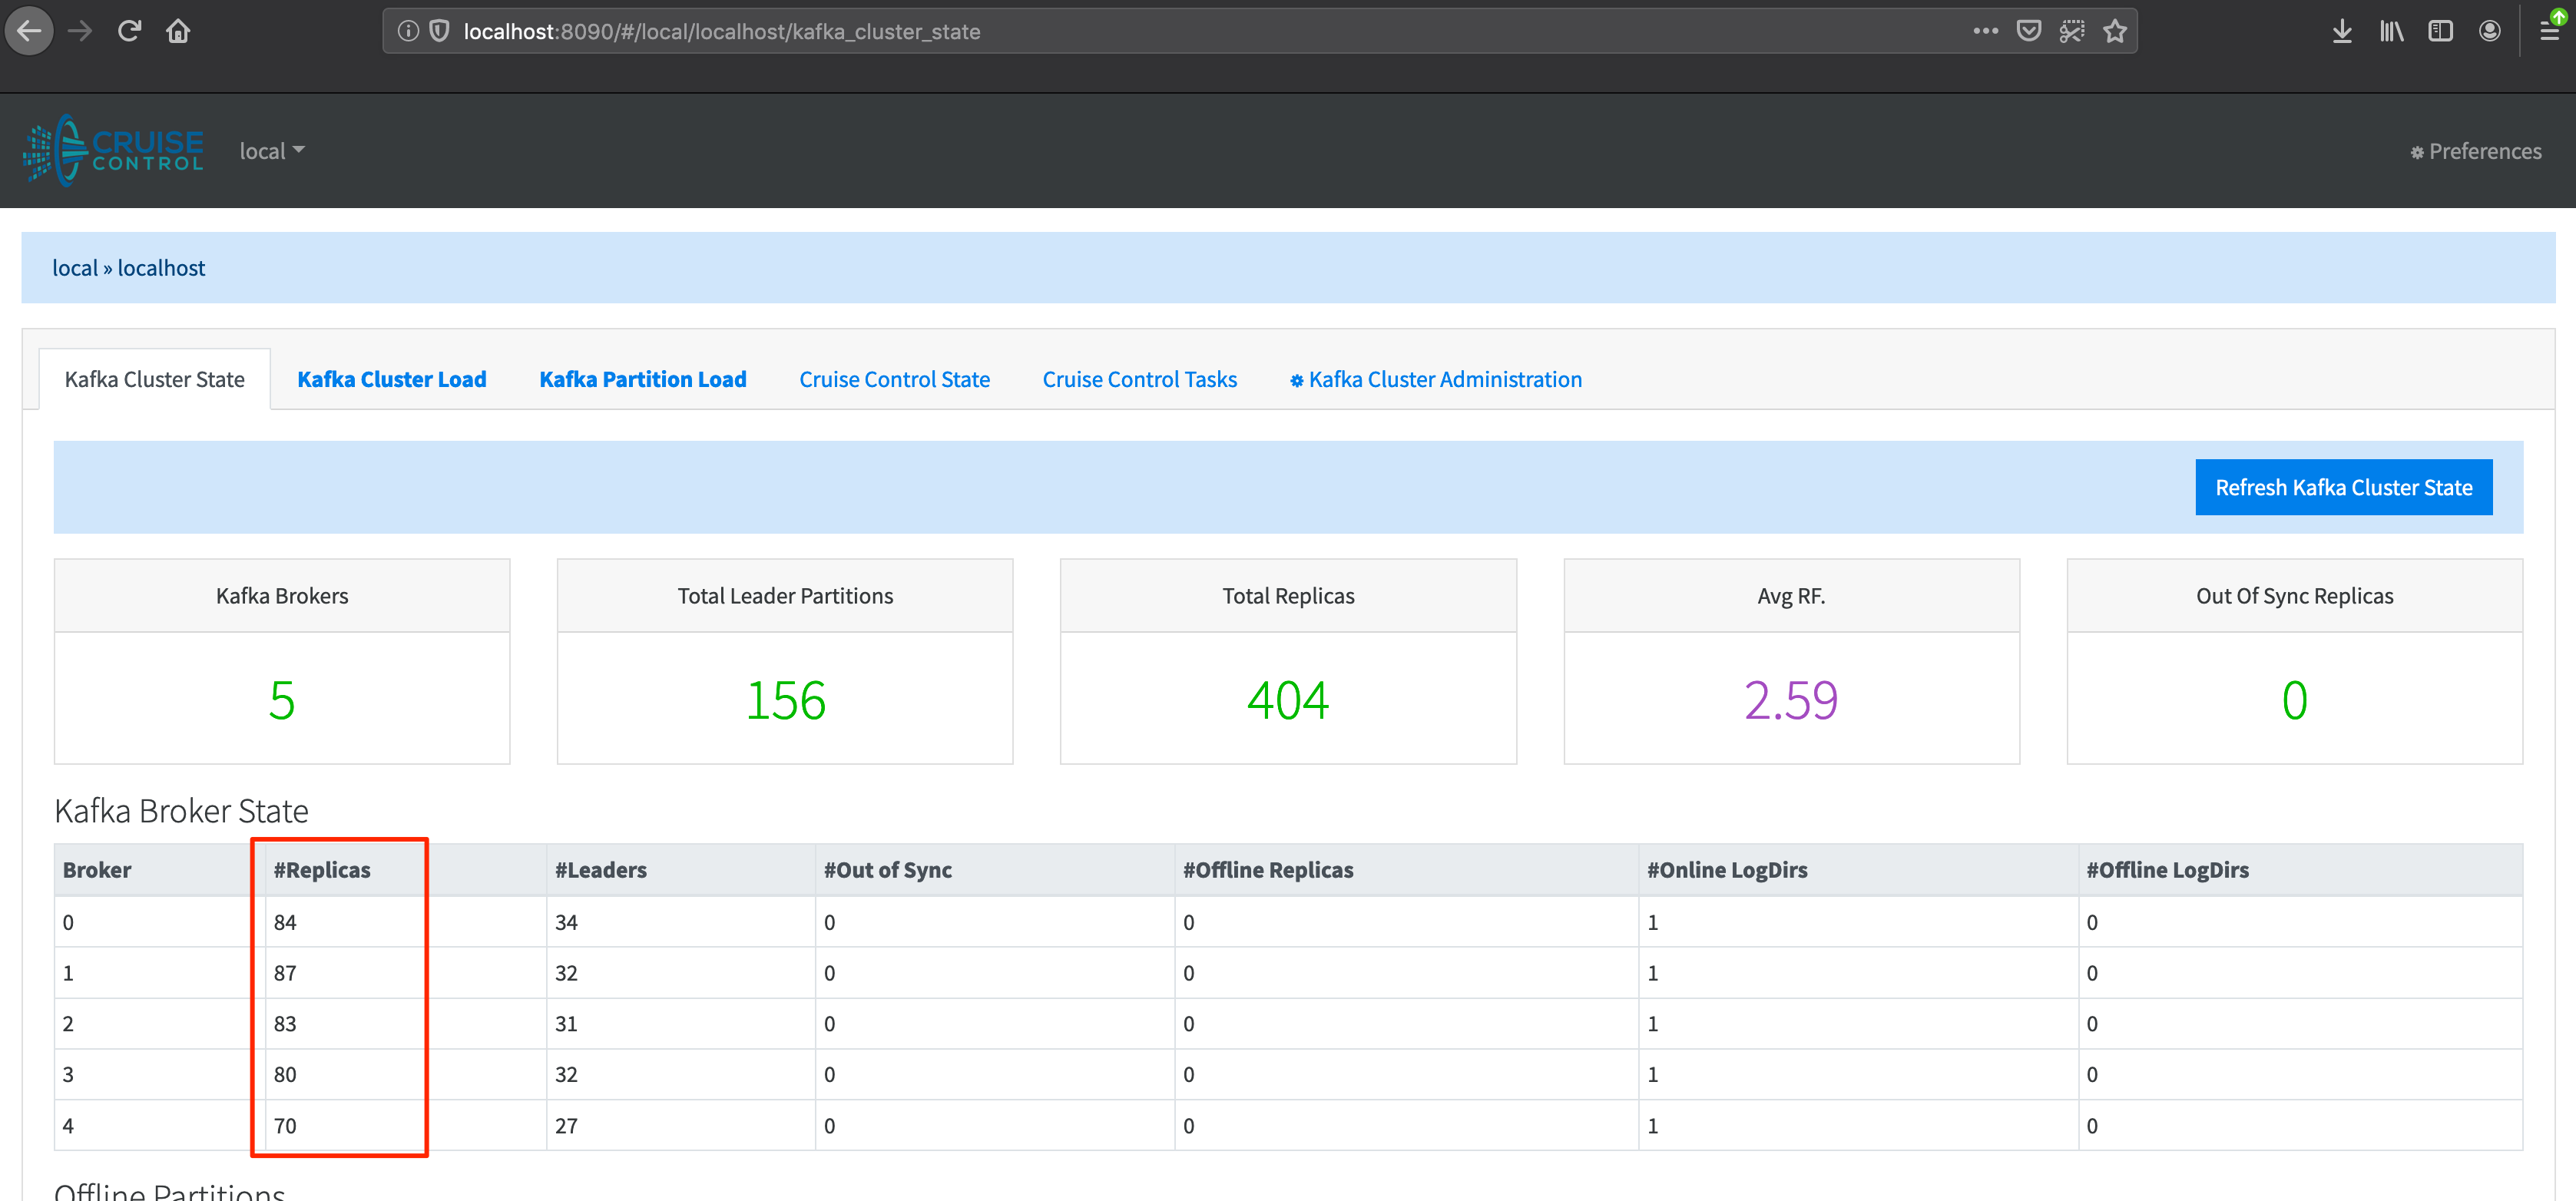
If we check Cruise Control, we can see that three brokers out of four have exceeded the limit for partitions.
As expected, the Prometheus alert has entered a pending state.
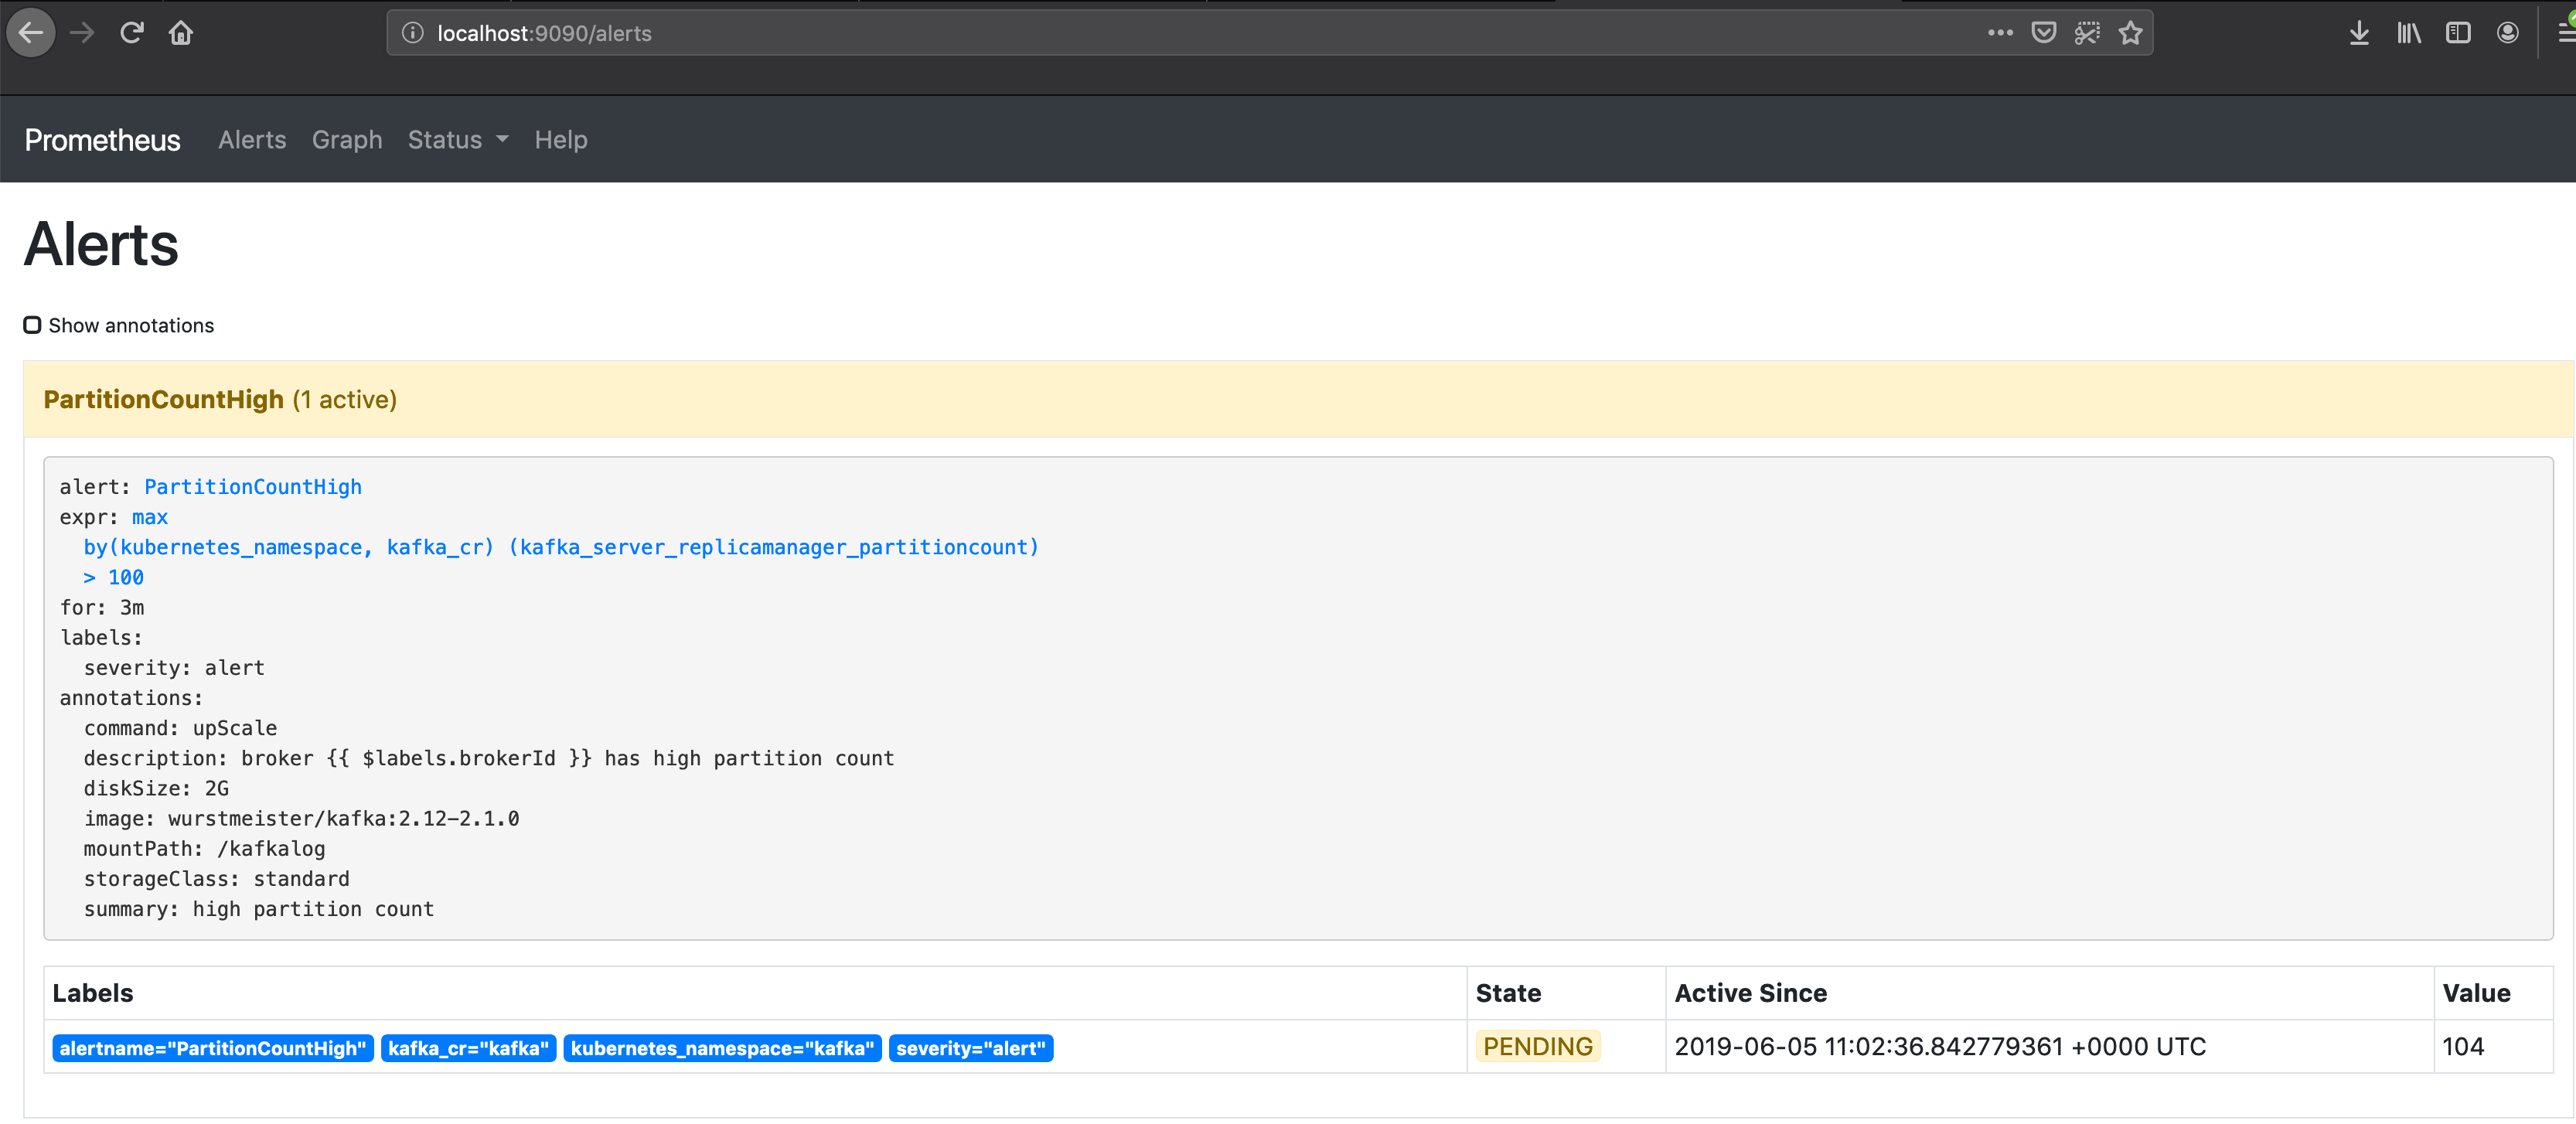
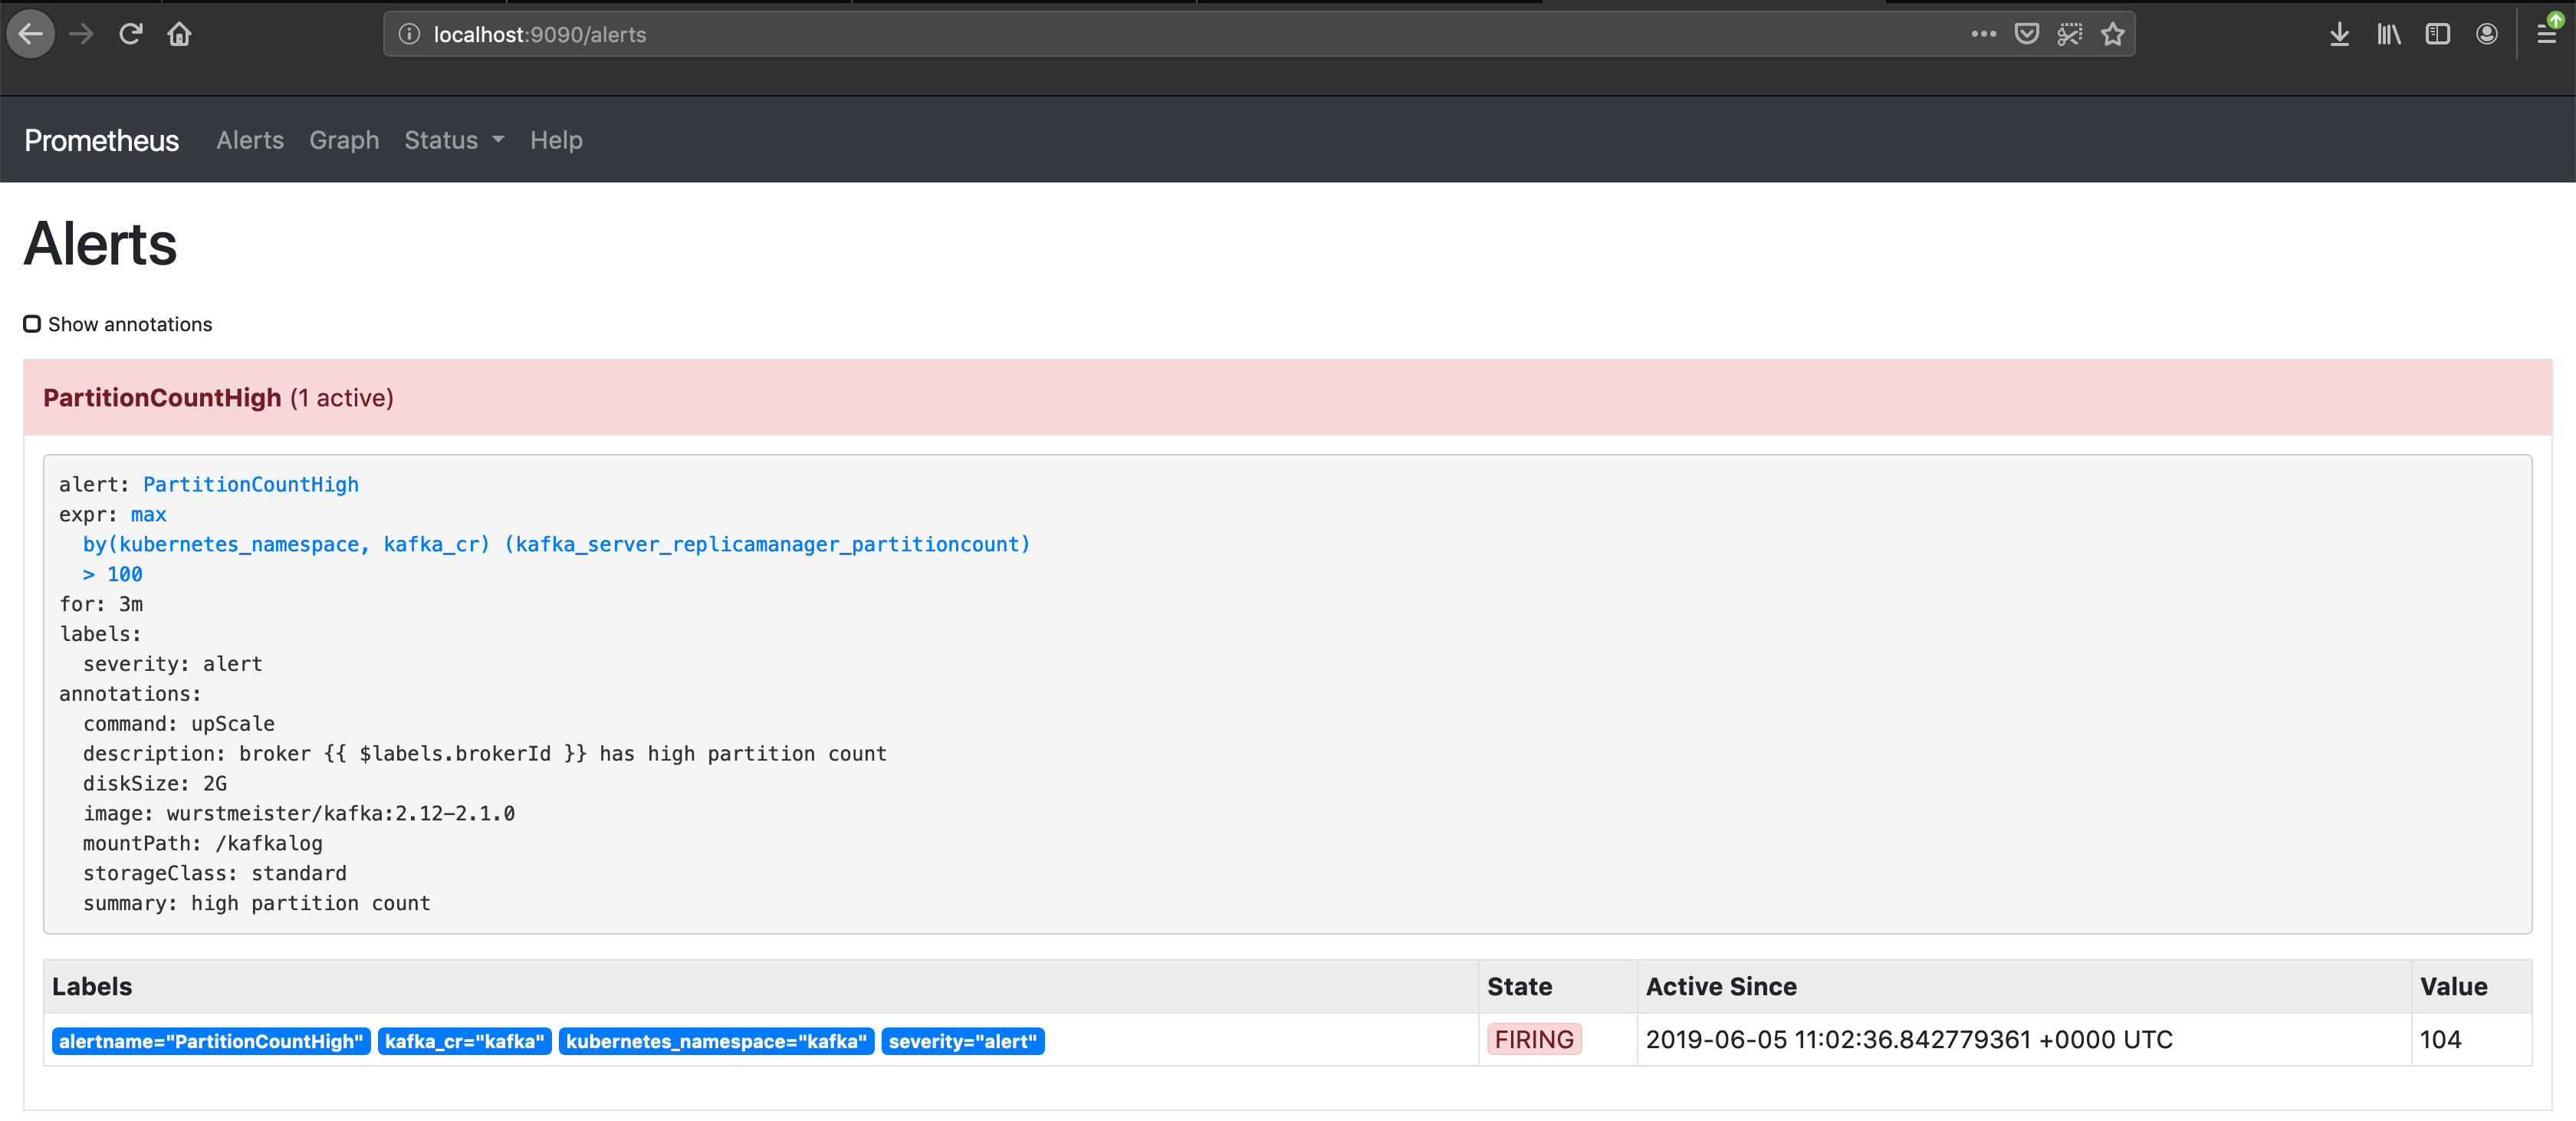
If the alert remains in this state for more than three minutes, Prometheus fires the registered alert:
If we check our Kubernetes resources, we’ll find that the Koperator has already acted and scheduled a new Broker.
kubectl get pods -w
NAME                                                READY   STATUS    RESTARTS   AGE
cruisecontrol-5fb7d66fdb-zvx2s                      1/1     Running   0          90m
envoy-784d776575-jlddd                              1/1     Running   0          89s
kafka-operator-operator-0                           2/2     Running   0          92m
kafka-operator-prometheus-server-694fcf6d99-fv5k5   2/2     Running   0          92m
kafka-internal                                      1/1     Running   0          7m21s
kafka6hfhf                                          1/1     Running   0          90s
kafkacfn4v                                          1/1     Running   0          90m
kafkam5wm6                                          1/1     Running   0          90m
kafkamdpvr                                          1/1     Running   0          90m
kafkamzwt2                                          1/1     Running   0          90m
And, if we check Cruise Control, we can see that a new Broker has been added to the cluster. With the new Broker, the partition count has been brought back below 100.
In summary, this post demonstrated (via a simple example) the capabilities inherent in the Koperator . We encourage you to write your own application-specific alert and give the operator a try. Should you need help, or if you have any questions, please get in touch by joining our #kafka-operator channel on [Slack]/invite-slack/).
About Banzai Cloud 🔗︎
Banzai Cloud is changing how private clouds are built by dramatically simplifying the development, deployment, and scaling of complex applications, and bringing the full power of Kubernetes and Cloud Native technologies to developers and enterprises everywhere. #multicloud #hybridcloud #BanzaiCloud.