


If you spend any of your time dealing with the cloud native world, you’ve probably already heard about Kubeflow. It’s something we’ve been playing with since we first began to explore the possibility of running Tensorflow in a distributed way. That was quite some time ago. Since then, Kubeflow has rapidly evolved, so that it now includes dozens of machine learning (ML) frameworks. The frameworks allow for the training and serving of all kinds of machine learning models. Today, you will learn:
- how to deploy Kubeflow on cluster managed with Banzai Cloud Pipeline,
- use the Banzai Cloud Istio operator to manage resources that require Istio,
- how to integrate authentication flow with an external Dex running on the Banzai Cloud Pipeline control plane, and, finally,
- how to gather logs using Pipeline’s Logging & Monitoring Integrated Service, One Eye.
tl;dr 🔗︎
- a quick overview of Kubeflow components, for those not yet familiar with Kubeflow
- how to deploy Kubeflow on an EKS cluster managed with Banzai Cloud Pipeline
Quick overview of the components you get with Kubeflow 🔗︎
-
Machine Learning Pipelines - are a core component and platform for building and deploying portable and scalable end-to-end ML workflows, based on containers. A pipeline is a description of an ML workflow, including all of the components in the workflow and how they combine to form a graph. A pipeline component is a self-contained set of user code, packaged as a Docker image, which performs one step in the pipeline. For example, a component can be responsible for data preprocessing, data transformation, model training, and so on. There’s an SDK for defining and manipulating pipelines and components, and the Kubeflow Pipelines UI is also available to help you visualize and share your ML workflows. Workflows are run by Argo Workflow which is also included.
-
Metadata - helps you to track and manage the metadata and artifacts that ML workflows produce, where metadata refers to information about executions: (runs), models, datasets. Artifacts, on the other hand, are the files and objects that form the inputs and outputs of the components in your ML workflow.
-
Machine Learning Training Frameworks - train different ML models in Kubeflow like TensorFlow, PyTorch, MXNet, and MPI, which allows for distributed training on Kubernetes. TensorFlow and PyTorch are already stable components of Kubeflow, whereas MXNet and MPI are still in alpha. The approach is the same for all these frameworks: first you define your Tensorflow or PyTorch job in a custom resource, then an operator runs the job on Kubernetes.
-
Model Serving Tools - currently there are two ML model serving tools available, both of which support multiple frameworks - Seldon Core, which is stable, and KFServing, which is in beta. You can find a good comparison of these in Kubeflow docs.
-
Hyperparameter tuning of ML models with Katib. Hyperparameters are variables that control the model training process, like learning rate, number of layers in a neural network, number of nodes in each layer. Normally, to get optimal values for these parameters, you’d need to run an array of training jobs, manually adjusting the hyperparameters to find their optimal values. Using Katib, you can automate this process.
-
Jupyter Notebooks - is a Jupyter Hub-like, cloud native, implementation for starting Jupyter notebooks. You can define, start, and connect to notebooks from its UI. Under the hood, a Notebook CR is created as well as a Notebookcontroller, which operates on these resources, starting your notebook in your user’s own namespace. By default, the implementation allows you to choose from Tensorflow images, but you can start any custom image. For example, you can start a Spark notebook, while running Spark jobs in client mode on Kubernetes. An interesting option that we’re also experimenting with is to connect to remote kernels managed by Jupyter Enterprise Gateway, in order to run Spark jobs on k8s in cluster mode.
-
Spark Operator - is a relatively recent addition, and has not yet been tightly integrated with these other parts. It lets you define your Spark workloads in a cloud native way by using custom resources instead of running spark-submit manually. It supports automatic restarts, in case of failures, as well as scheduling, and gathering metrics.
-
Central Dashboard - is the central user interface (UI) in Kubeflow, and contains links to several UI components, like Notebooks and Pipelines.
If you’re interested, you can find detailed descriptions of these features, here.
Deploying Kubeflow on a Pipeline managed cluster 🔗︎
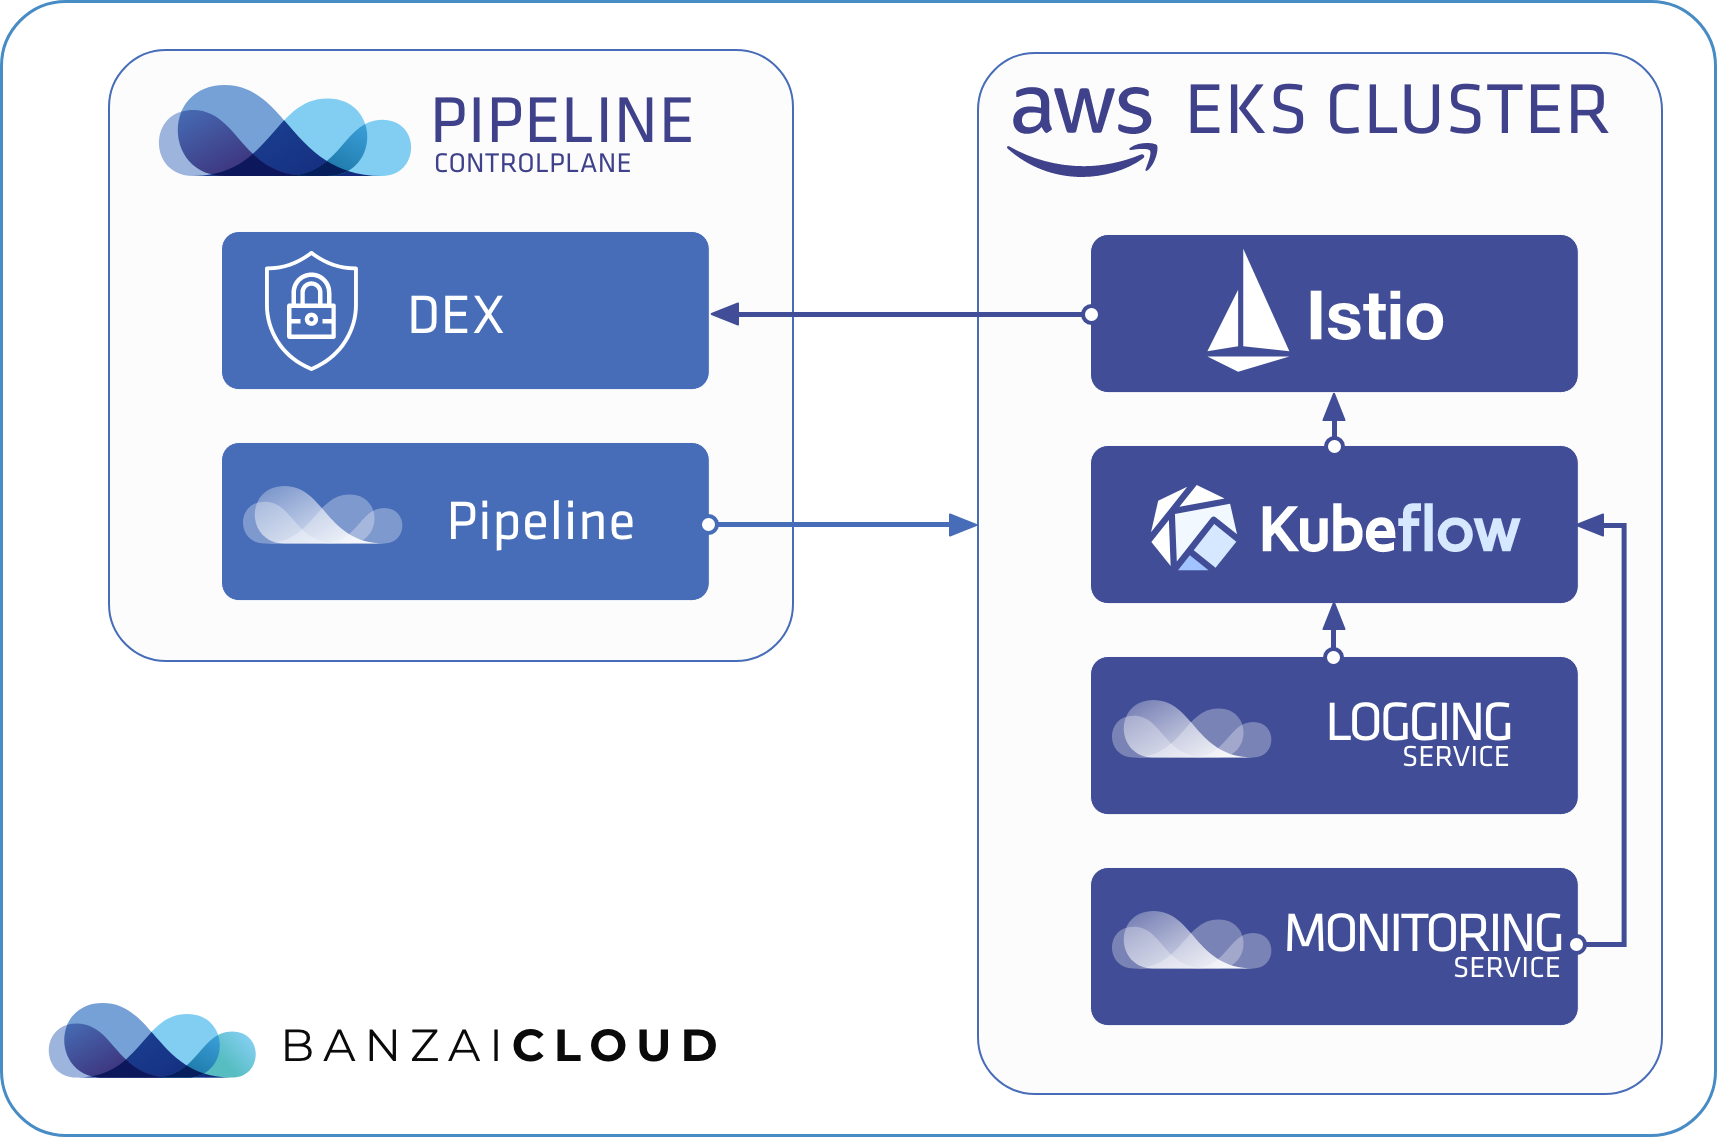
Deploying Kubeflow in a Banzai Cloud Pipeline-managed cluster is about the same as deploying it to any k8s cluster, so we’ll use kfctl, the official CLI to deploy, delete, and upgrade Kubeflow. The advantage of deploying to a cluster managed by Banzai Cloud Pipeline is that you can use your already set up Dex service running on your Banzai Cloud Pipeline Control Plane to authenticate Kubeflow users in the same way you would authenticate Banzai Cloud Pipeline users.
As we said, we’ll use kfctl. Although kfctl is a shell-based tool, it works in a manner similar to that of a Kubernetes operator. You have to specify a yaml file, which must contain a KfDef resource and looks very much like a custom resource, where you can list the application modules you want to install. These applications are kustomize modules defined in a GitHub repository. You can find several setup examples of this in the kfdef folder. We will use kfctl_istio_dex.yaml as a base for our deployment, once we modify it a bit.
Istio is an integral part of the Kubeflow architecture. Accordingly, it is included in each example by default, and it’s the first thing we need to remove from KfDef, since we will use our open source Istio operator to manage Istio resources and will deploy the operator with our Backyards CLI.
Authentication flow is also based on Istio; all incoming traffic goes through an Istio Gateway and an Istio Envoy Filter. This filter calls oidc-authservice, which attempts to authenticate users with an internal or external Dex service.
A detailed description of a Dex authentication flow can be found here: Kubeflow: Authentication with Istio + Dex.
Once the user is authenticated, a Profile resource is created. A profile actually consists of a namespace alongside view, edit, and admin RBAC roles and bindings for that namespace. This method of profile-based user management has yet to be integrated with all of Kubeflow’s components. It is, however, integrated with the core components like Jupyter Notebooks and Pipelines, so that users can only edit notebooks and pipelines in their own namespace, or view others (if others have been shared with them).
Another advantage of deploying Kubeflow to a cluster managed by Banzai Cloud Pipeline is that you can start gathering your logs into a centralized location by enabling Logging and Monitoring Integrated Services. Even if you choose to use basic default settings, specifying only an object storage for your logs, you can quickly store and search all your logs from all namespaces. Of course, this is all done with our open source Logging operator, so you can set up more complex patterns, backend stores, and logging flows.
Demo time 🔗︎
In the following steps we will be using Banzai CLI, Backyards CLI, as usual. Our core readership probably already has these installed, but we’ve included installation commands for everything else. (If you haven’t installed these tools yet, follow the Banzai CLI Install Guide and the Backyards CLI Install Guide)
-
Create a cluster with Banzai Cloud Pipeline
- Install / upgrade the Banzai CLI tool with the following, simple command:
curl https://getpipeline.sh | sh -s auto - You will need an existing Amazon secret, so create one in case you don’t have one:
export SECRET_NAME=aws-demo-secret banzai secret create --magic --name $SECRET_NAME --type amazon - For our demo install, we will create an EKS cluster with a small pool of
m4.xlarge, large enough to be able to deploy all of the Kubeflow applications and an auto scalable pool of GPU nodes for eventual GPU workloads.CLUSTER_NAME=kubeflow-demo banzai cluster create <<EOF { "name": "$CLUSTER_NAME", "location": "us-east-1", "cloud": "amazon", "secretName": "$SECRET_NAME", "properties": { "eks": { "version": "1.14.7", "nodePools": { "pool1": { "spotPrice": "0.20", "minCount": 2, "maxCount": 4, "autoscaling": true, "instanceType": "m5.xlarge" }, "pool2": { "spotPrice": "1.0", "minCount": 0, "maxCount": 2, "autoscaling": true, "instanceType": "p2.xlarge", "image": "ami-0730212bffaa1732a" } } } } } EOF
Just as a side note, it’s not a must that you have GPU instances to install Kubeflow. All applications are able to run on a CPU, as well. Of course, model trainings may benefit considerably from being run on GPU instances. However, if you only want to run, for example, typical Spark jobs or pipelines, you don’t need a GPU at all.
- Install / upgrade the Banzai CLI tool with the following, simple command:
-
Activate Logging and Monitoring
The first prerequisite is to have a Banzai Cloud Pipeline managed bucket, where you can store logs.
-
Create one, if you don’t already have one:
      BUCKET_NAME=kubeflow-demo
      banzai bucket create --cloud amazon --location eu-west-1 $BUCKET_NAME
For the time being, we want to gather all your logs from all your namespaces, which is done by default.
Kubeflowwill create a separate namespace for each user, so it’s good to have them all together. The same way logging flows can be customized, you can configure separate flow outputs for different users/namespaces. -
Activate Monitoring & Logging services with the commands below:
      banzai cluster service --cluster-name $CLUSTER_NAME monitoring activate

      ? Do you want to enable Grafana? Yes
      ? Provider secret: grafanasecret
      ? Do you want to enable Grafana Ingress? No
      ? Do you want to add default dashboards to Grafana? Yes
      ? Please provide storage class name for Prometheus:
      ? Please provide storage size for Prometheus: 100
      ? Please provide retention for Prometheus: 10d
      ? Do you want to enable Prometheus Ingress? No
      ? Do you want to enable Alertmanager? No
      ? Do you want to enable Pushgateway? No
      ? Do you want to edit the cluster service activation request in your text editor? No
      INFO[0069] service "monitoring" started to activate
banzai cluster service --cluster-name $CLUSTER_NAME logging activate ? Do you want to enable TLS? No ? Do you want to enable Metrics? No ? Do you want to enable Loki? Yes ? Do you want to enable Loki Ingress? No ? Do you want to enable cluster output? Yes ? Select log storage provider: Amazon S3 ? Provider secret: aws-demo-secret ? Bucket name: kubeflow-demo ? Do you want to edit the cluster service activation request in your text editor? No INFO[0061] service "logging" started to activate
If you choose to keep the default settings, don’t forget to enable Loki. If you enable both Grafana & Loki, the latter will be set up as a datasource in Grafana, so you will be able to reach your logs there*.
Find out more about Loki and Grafana in earlier blogpost.
-
-
Install our Istio operator with the Backyards CLI
-
Start Banzai cluster shell:
banzai cluster shell --cluster-name $CLUSTER_NAME -
Install/upgrade the Backyards CLI:
Register for the free tier version of Cisco Service Mesh Manager (formerly called Banzai Cloud Backyards) and follow the Getting Started Guide for up-to-date instructions on the installation.
-
Install our Istio operator:
backyards istio install -
Get the address of your Istio Gateway:
export EXTERNAL_ADDR=http://$(kubectl get svc --namespace istio-system -l app=istio-ingressgateway,istio=ingressgateway -o jsonpath='{.items[0].status.loadBalancer.ingress[0].hostname}')
-
-
Install Kubeflow
-
Download kfctl-banzai.v1.0.1.yaml and replace
EXTERNAL_ADDRwith the external address of the EKS cluster we retrieved in the step before, andPIPELINE_CONTROL_PLANE_ADDRwith your Pipeline Control Plane address.- name: oidc_provider value: https://$PIPELINE_CONTROL_PLANE_ADDR/dex - name: oidc_redirect_uri value: $EXTERNAL_ADDR/login/oidc - name: oidc_auth_url value: https://$PIPELINE_CONTROL_PLANE_ADDR/dex/auth -
Download your latest preferred version of kfctl.
-
Once you are ready, you can deploy Kubeflow:
kfctl apply -V -f kfctl-banzai.v1.0.1.yaml
-
-
Allow Kubeflow to authenticate through your Controlplane’s Dex service.
-
To allow authentication through your Dex service, you need to add it as a
kubeflow-oidc-authserviceand as astaticClientin your Dex config:- id: kubeflow-oidc-authservice secret: pUBnBOY80SnXgjibTYM9ZWNzY2xreNGQok redirectURIs: - '$EXTERNAL_ADDR/login/oidc' name: 'Kubeflow'This is pretty much the same for any external Dex. If you have problems with authentication, the first thing to check is
authservicelogs:kubectl logs authservice-0 -n istio-system. -
Make sure your client Id and secret matches the ones set up for the
authservicerunning in youristio-systemnamespace. These are passed as environment variables, which you can check by running:kubectl describe statefulsets.apps authservice -n istio-system. You will also find the variablesREDIRECT_URL,OIDC_PROVIDER, andOIDC_AUTH_URLthere as well, which we have configured in the previous step. It’s worth it to check if they match.
-
-
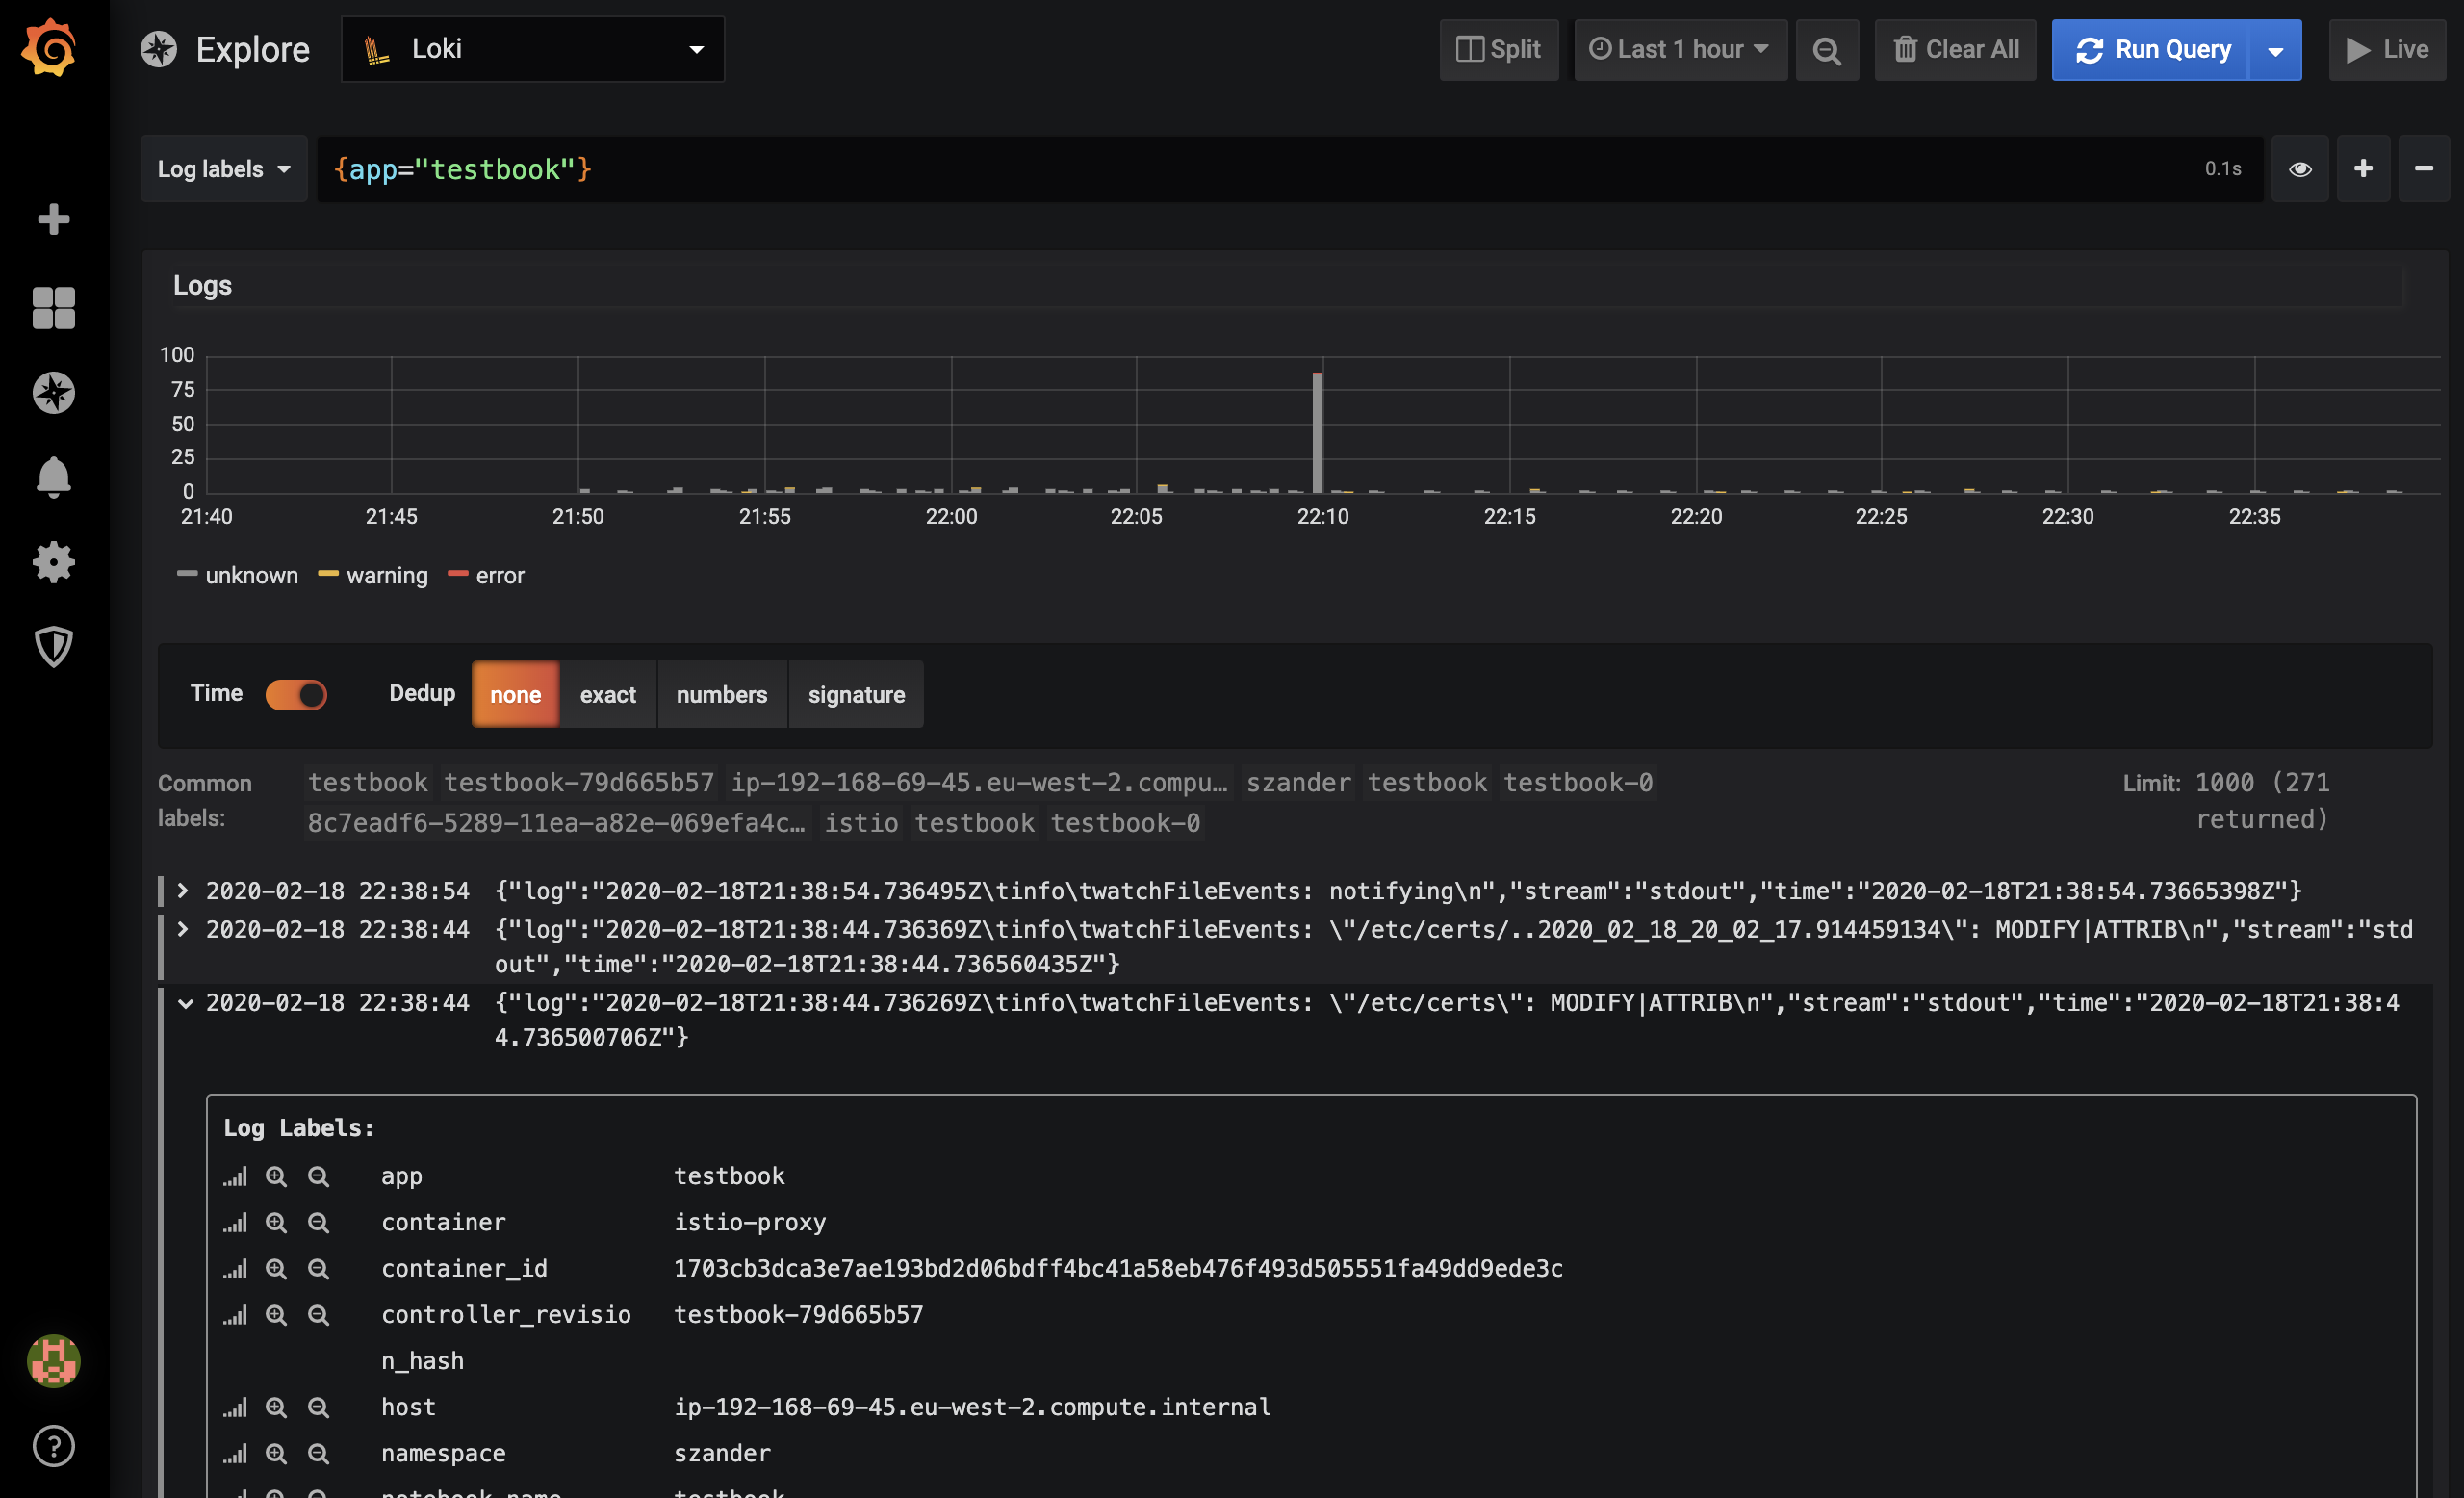
Login, start a Jupyter Notebook and check the logs in Grafana
Now you should be able to login - the same way you login to the Pipeline UI - at
echo $EXTERNAL_ADDRand reach the Dashboard, where you can start a Notebook. Grafana links can be retrieved from the Banzai Cloud Pipeline UI by clicking on the Cluster monitoring box on the cluster details page. Then you can proceed to theExploresection in Grafana, where you can filter your logs by namespace and app labels, and so on.
Next time, we’ll show you how to connect your Jupyter Notebook with Jupyter Enterprise Gateway to run your workload on remote kernels and run your Spark workloads in cluster mode.