


At Banzai Cloud we are passionate about observability, and we expend a great amount of effort to make sure we always know what’s happening inside our Kubernetes clusters.
All clusters provisioned with Pipeline - our multi- and hybrid-cloud container management platform - are provided with, and rely upon, each of the three pillars of observability: federated monitoring, centralized log collection and traces. In order to automate log collection on Kubernetes, we opensourced a logging-operator built on the Fluent ecosystem. If you’d like to brush up on that subject, feel free to browse through our previous posts.
In most cases, especially when running in-production Kubernetes on our CNCF certified Kubernetes distribution, PKE, logs end up in supported third party systems, like Elasticsearch. While this is perfectly fine in a production environment, it might not always be advisable for internal tests, UAT and dev environments; our customers run these a lot, and, when they do, they need to iterate fast and frequently. We’ve added an additional layer of distributed microservices, running in a service mesh that’s orchestrated by our Istio operator and Backyards, the Banzai Cloud automated service mesh, to allow for the inscreasingly nuanced analysis of pre-production logs and traces. This was done in response to users and customers asking for a more developer-friendly solution to the problem of reading and filtering centralized logs.
tl;dr: 🔗︎
- We added Loki support to our logging-operator
- Have opensourced a fluent-plugin-kubernetes-loki plugin
- Read on to learn about Loki and deep dive into a debug flow
“Just give me my log files and grep” 🔗︎
Gathering and filtering logs in Kubernetes is not as straightforward as it could be. In a microservice oriented environment there may be hundreds of pods with multiple versions of the same service. There exist simple command line tools, like stern, that fetch multiple logs from multiple containers, however, these only work on running pods, and there is no archive if a log is rotated. Developers have been starving for a simple tool that fits the context we’ve described. There are some heavy weight production ready solutions like Elasticsearch (mentioned above) or cloud-based services for analytics, but, in simpler use cases, these represent a kind of overkill; you don’t want to have to set up indexers, workers, and everything else, just for tailing log files.
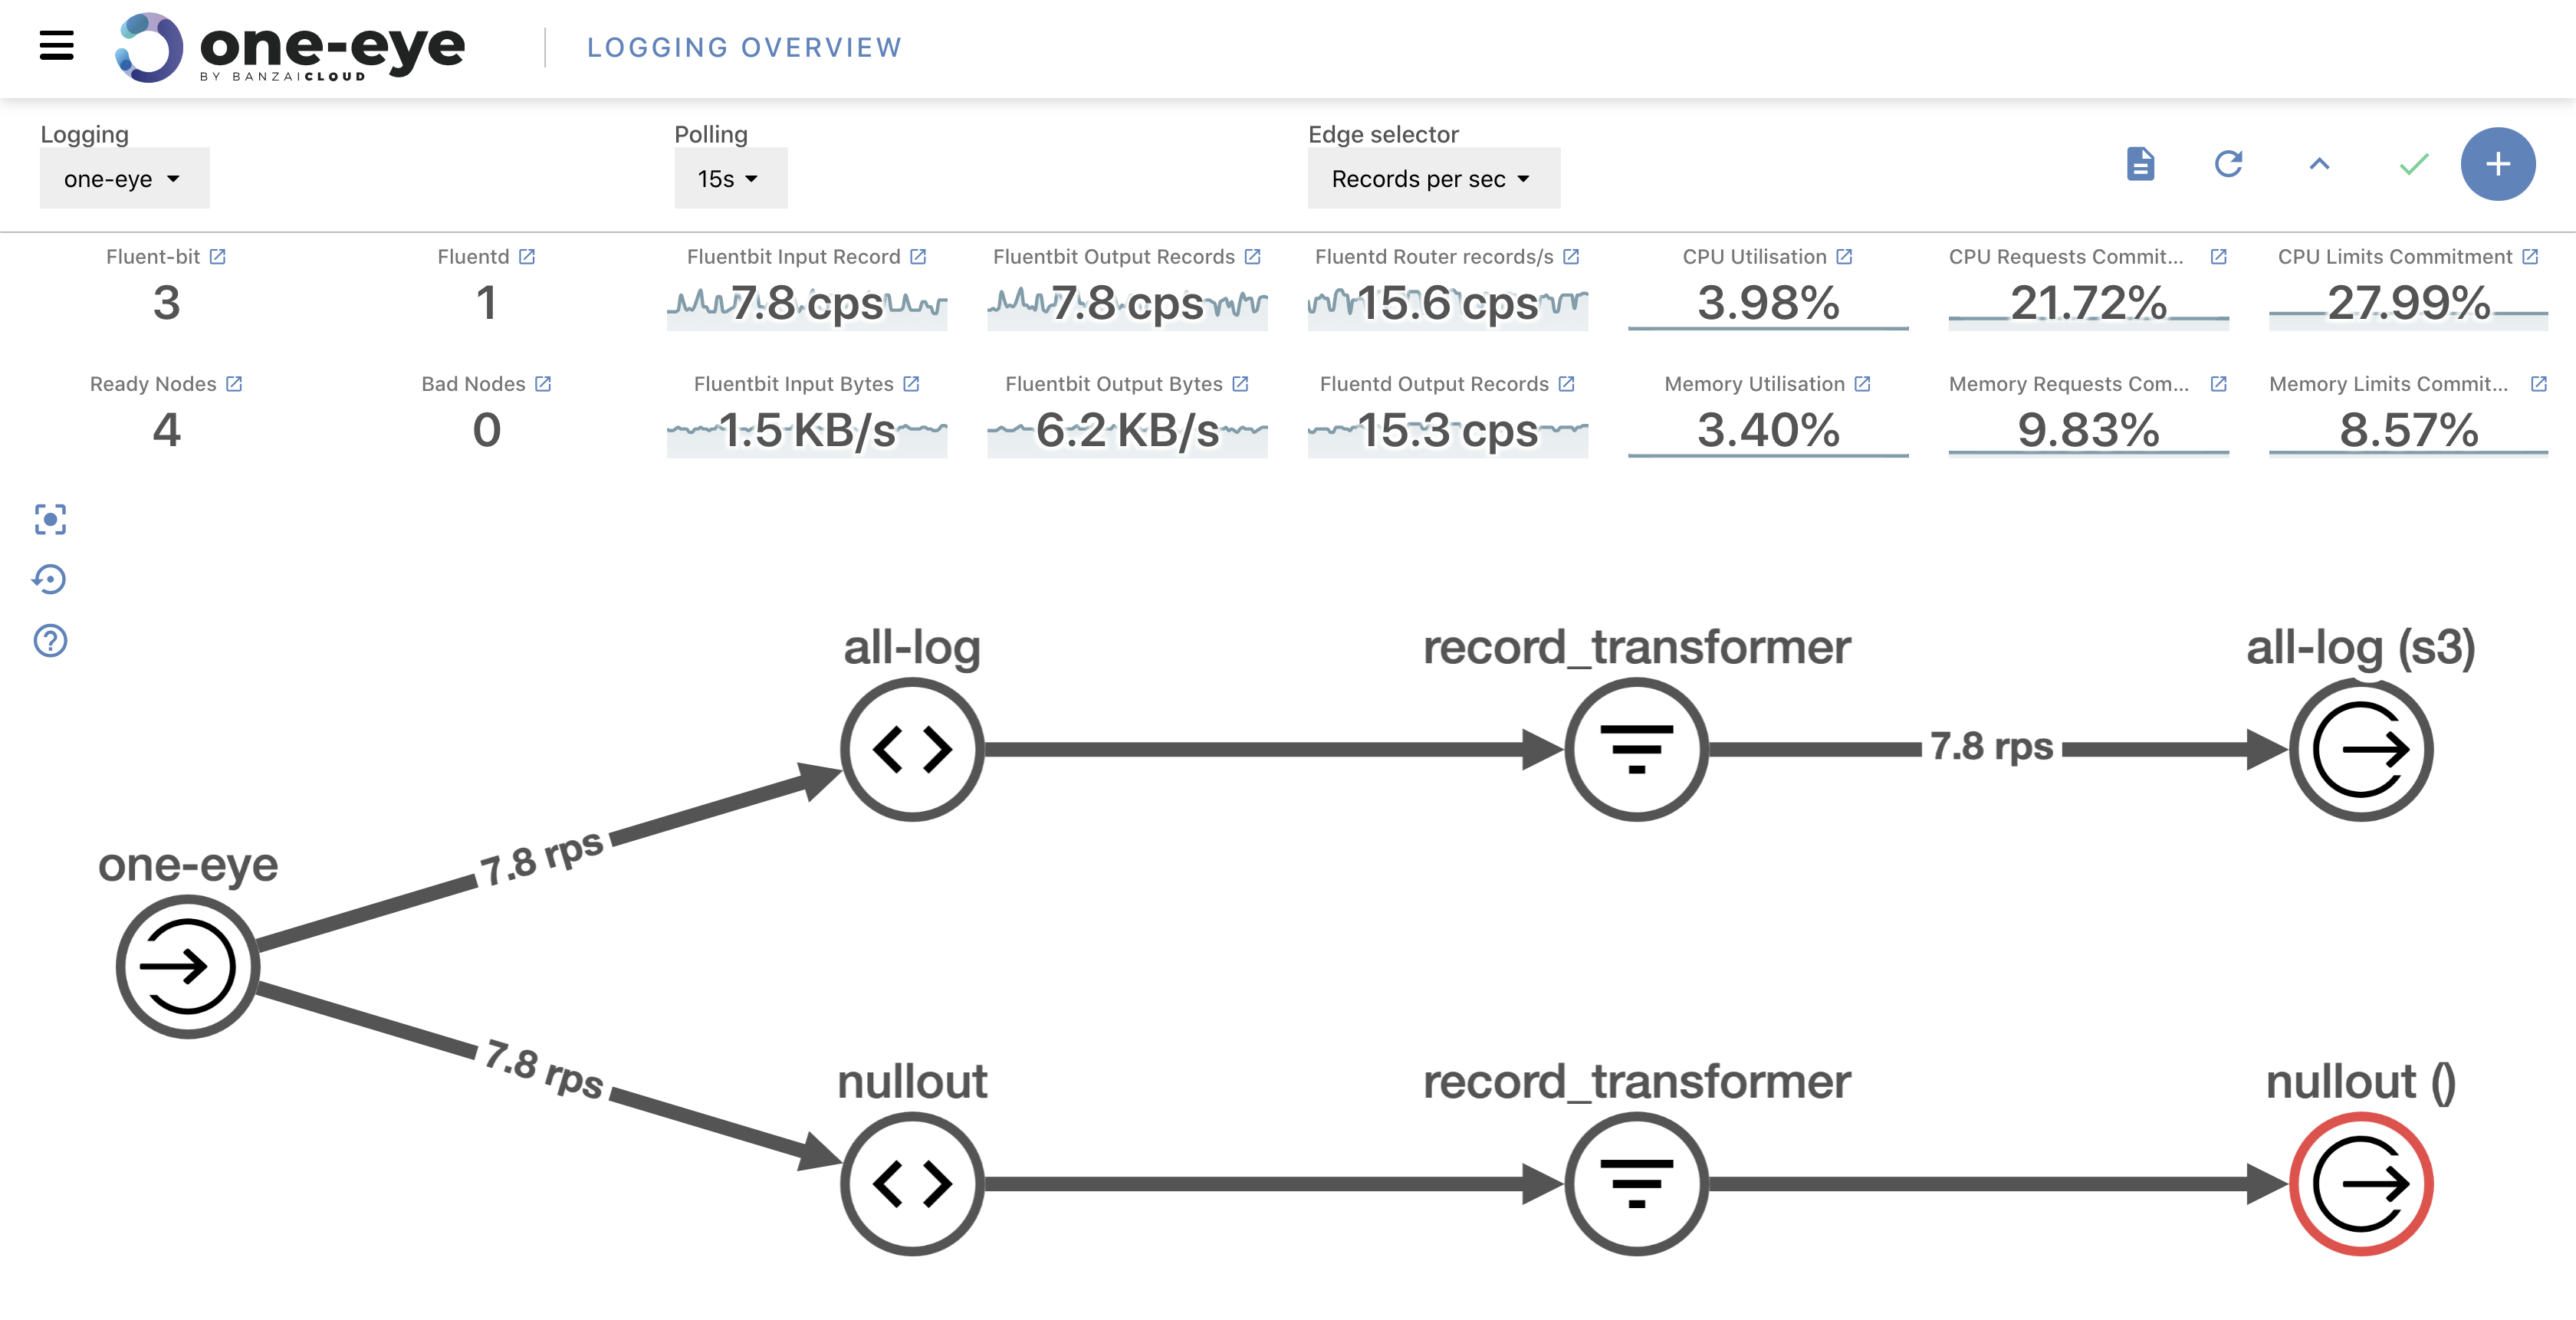
Here’s when Loki comes out of the shadows. For starters, let’s take a look at an example of debugging a workflow. As mentioned previously, all Pipeline clusters and deployments come with out-of-the-box Prometheus-based monitoring, centralized log collection via our logging-operator and insights into applications deployed on service meshes orchestrated by our Istio operator or by Backyards (now Cisco Service Mesh Manager).
1. We receive an incoming alert from Prometheus 🔗︎
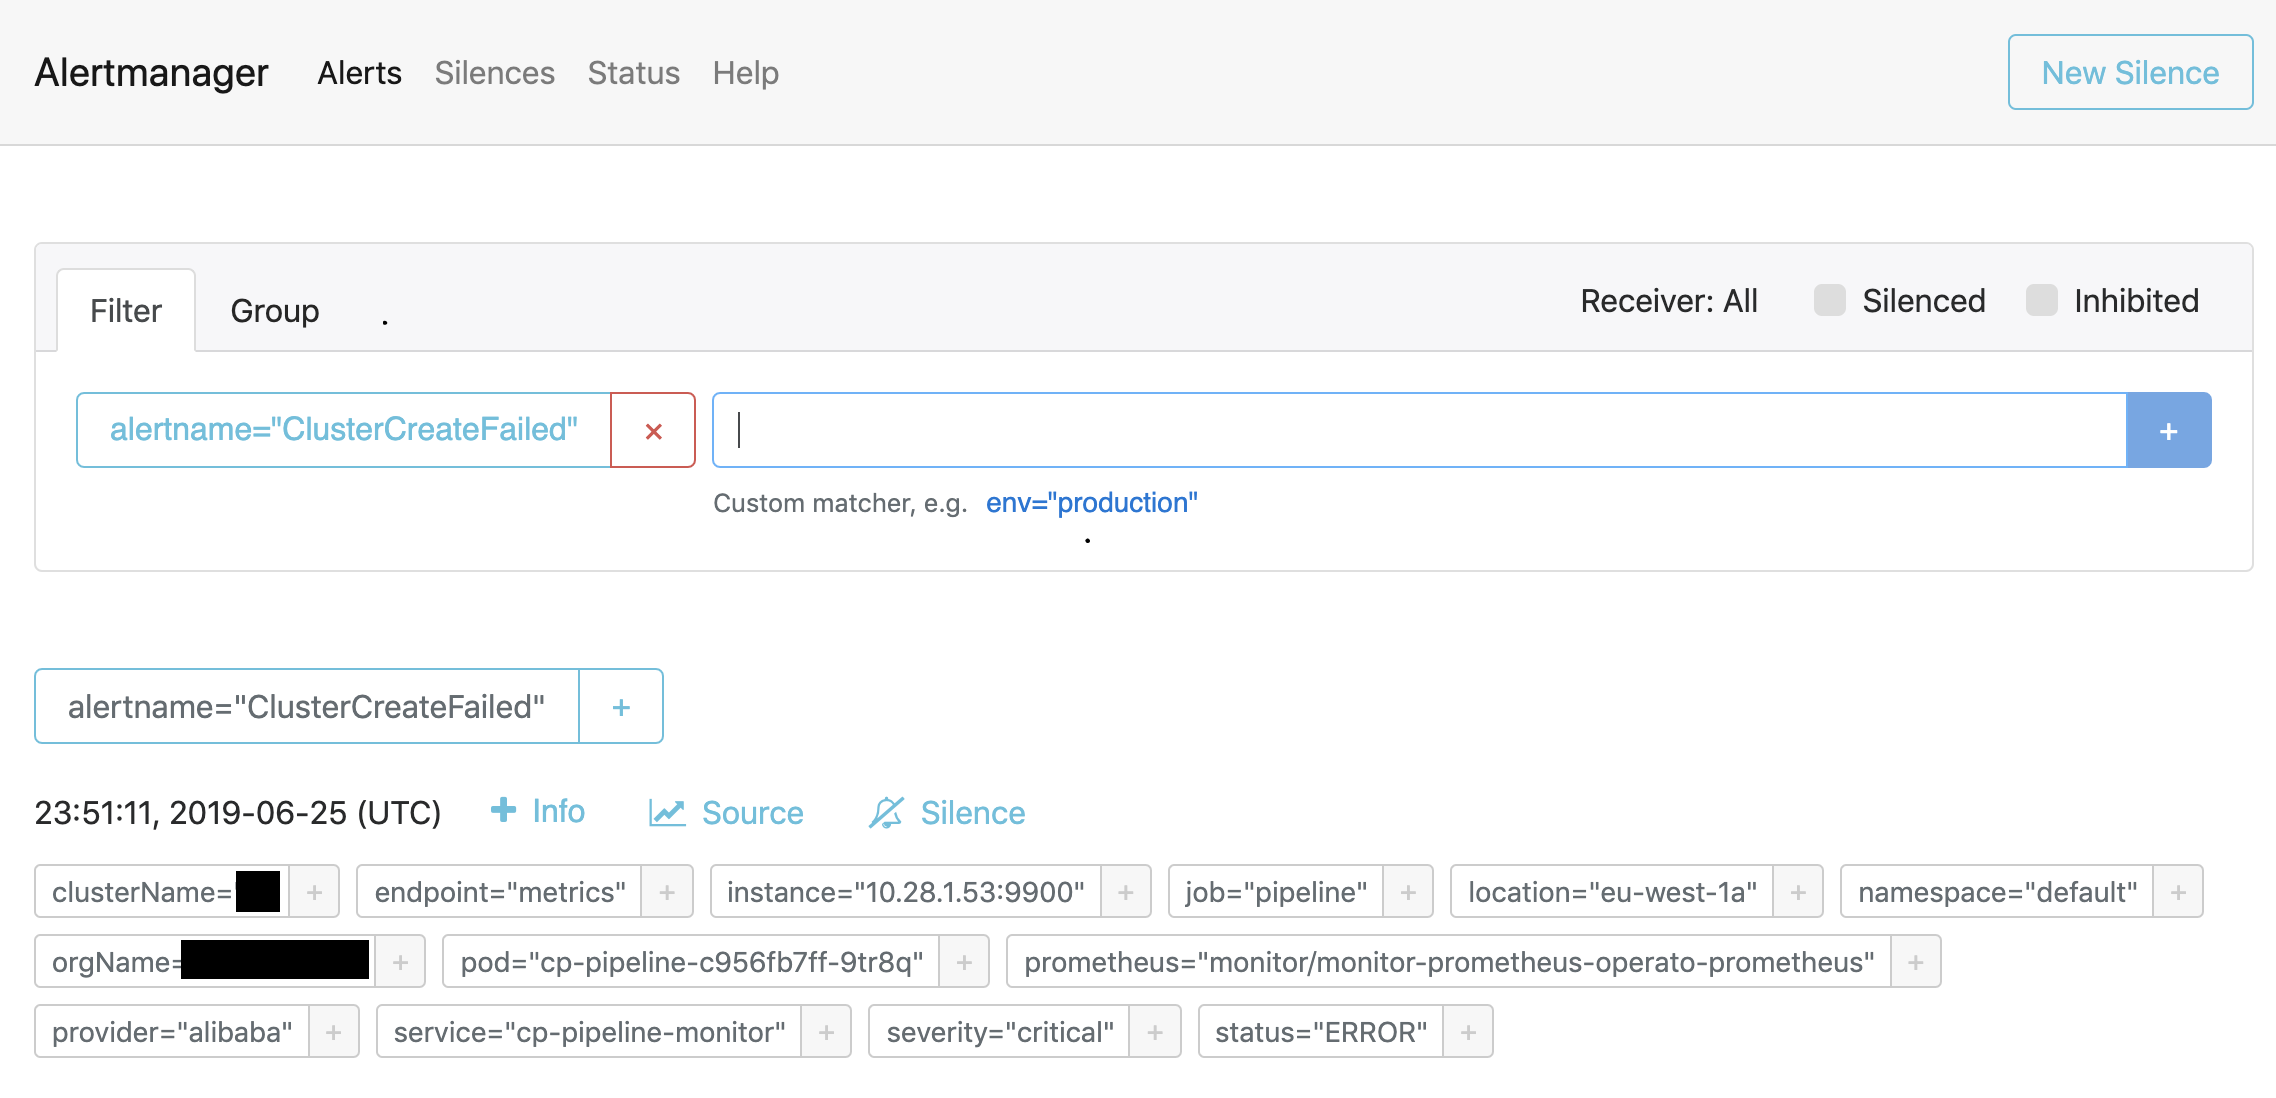
2. We check the Prometheus query and narrow down the problem to one or more pods 🔗︎
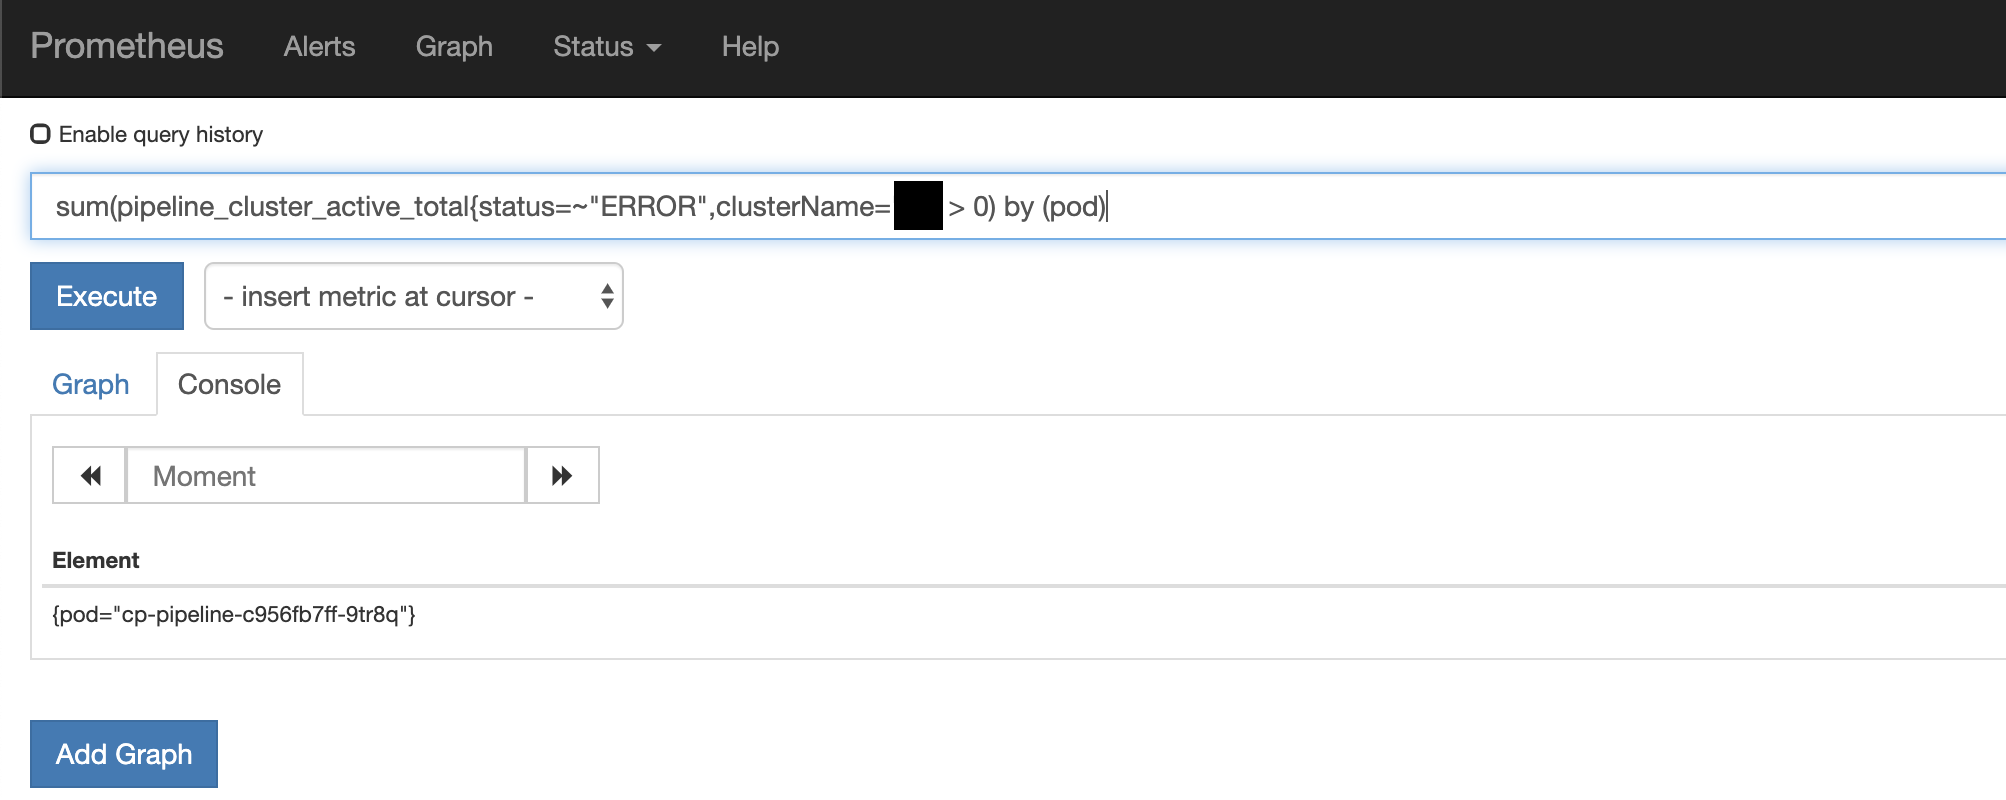
3. Once we have a pod’s name, we can fetch the relevant logs i.e: 🔗︎
$ kubectl logs cp-pipeline-c956fb7ff-9tr8q -c pipeline |grep 'cluster=<cluster_name>'The first two steps were routine operational tasks that have been used in production for a long time. However, the last step, the gathering of the logs of specific pods, can be tricky depending on your environment:
- As in the example above, you can accomplish this with kubectl:
kubectl logs -l key=value | grep XYX - If you already have Elasticsearch installed, you can use
Kibanaor the Elasticsearch API to grab logs - And you can use a custom toolchain if your logs are stored in object stores, like S3
Loki 🔗︎
Loki sells itself by promising “Prometheus-inspired logging for cloud natives.” It does that and much more! Loki is a simple yet powerful tool that facilitates the collection of logs from Kubernetes pods. At its most basic level, Loki works by receiving log lines enriched with labels. Users can then query Loki for the logs, which are filtered via their labels and according to time-range. Simple. So let’s dig into the details.
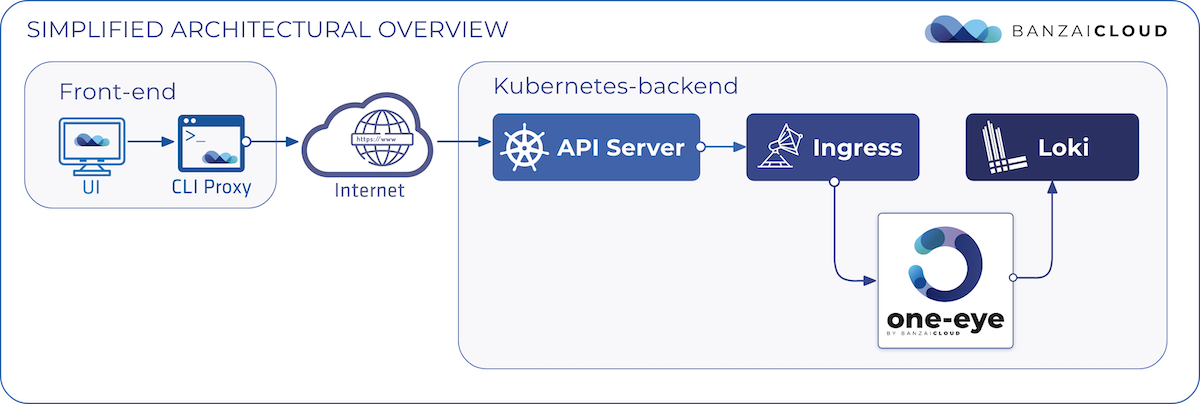
Architecture 🔗︎
Loki has two major components, Promtail, to gather logs and attach labels, and the Loki server, which stores these logs and provides an interface for querying them. This works nicely in a sandbox environment, but not as well in production. Loki solved this problem by adapting a production-ready architecture that’s similar to Cortex, a choice made after the experience of writing that project.
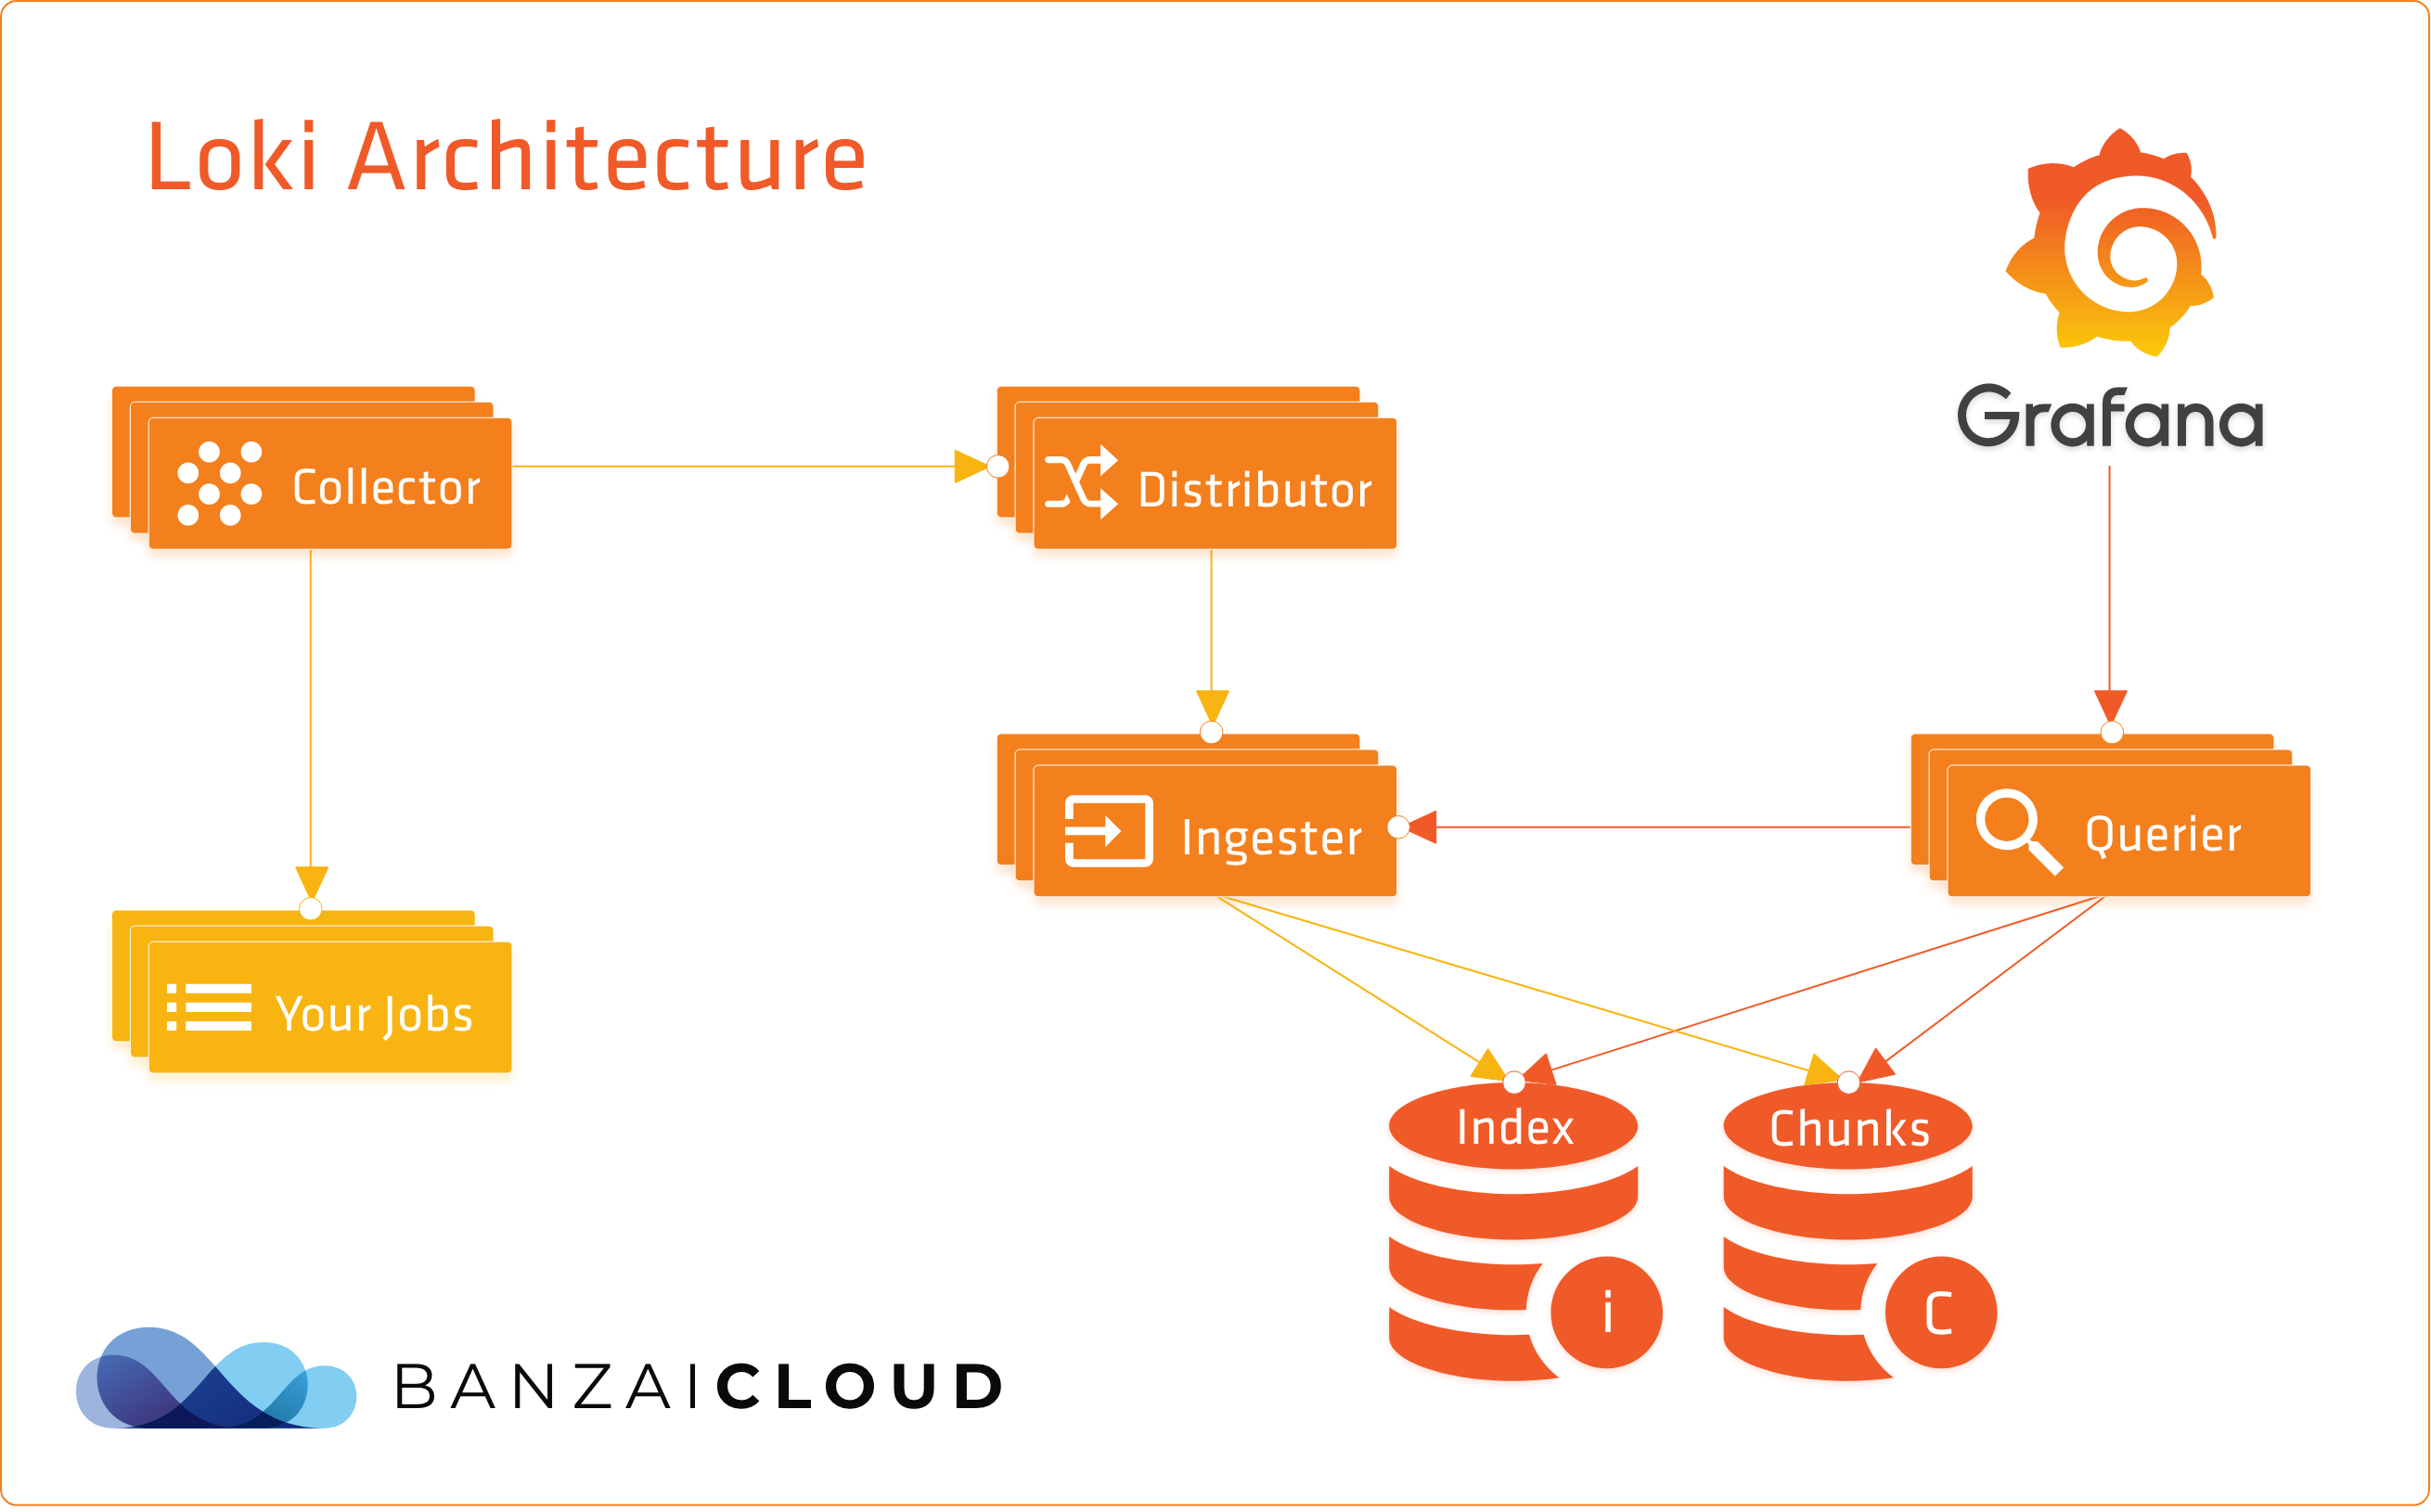
As you can see, the data-ingest and querier flows are separate. Data-ingest begins with log collectors. These read logs and transfer data to a distributor. A distributor behaves like a router. It uses consistent hashing to assign log streams to ingesters. Ingesters create chunks from the different log streams - based on labels - and gzip them. These chunks are regularly flushed to the server, where storage backends for chunks and indexes tend to differ. Chunks usually end up in some kind of object storage (GCS, S3, …), while indexes wind up in key-value stores like Cassandra, Bigtable, and DynamoDB. Loki uses Bolt db for indexes and chunks are stored in files.
In comparison, the querier way of doing things is much simpler. This method is based on time-range and label selectors that query indexes and matching chunks. This method also talks to the ingester for any recent data that might not have been flushed.
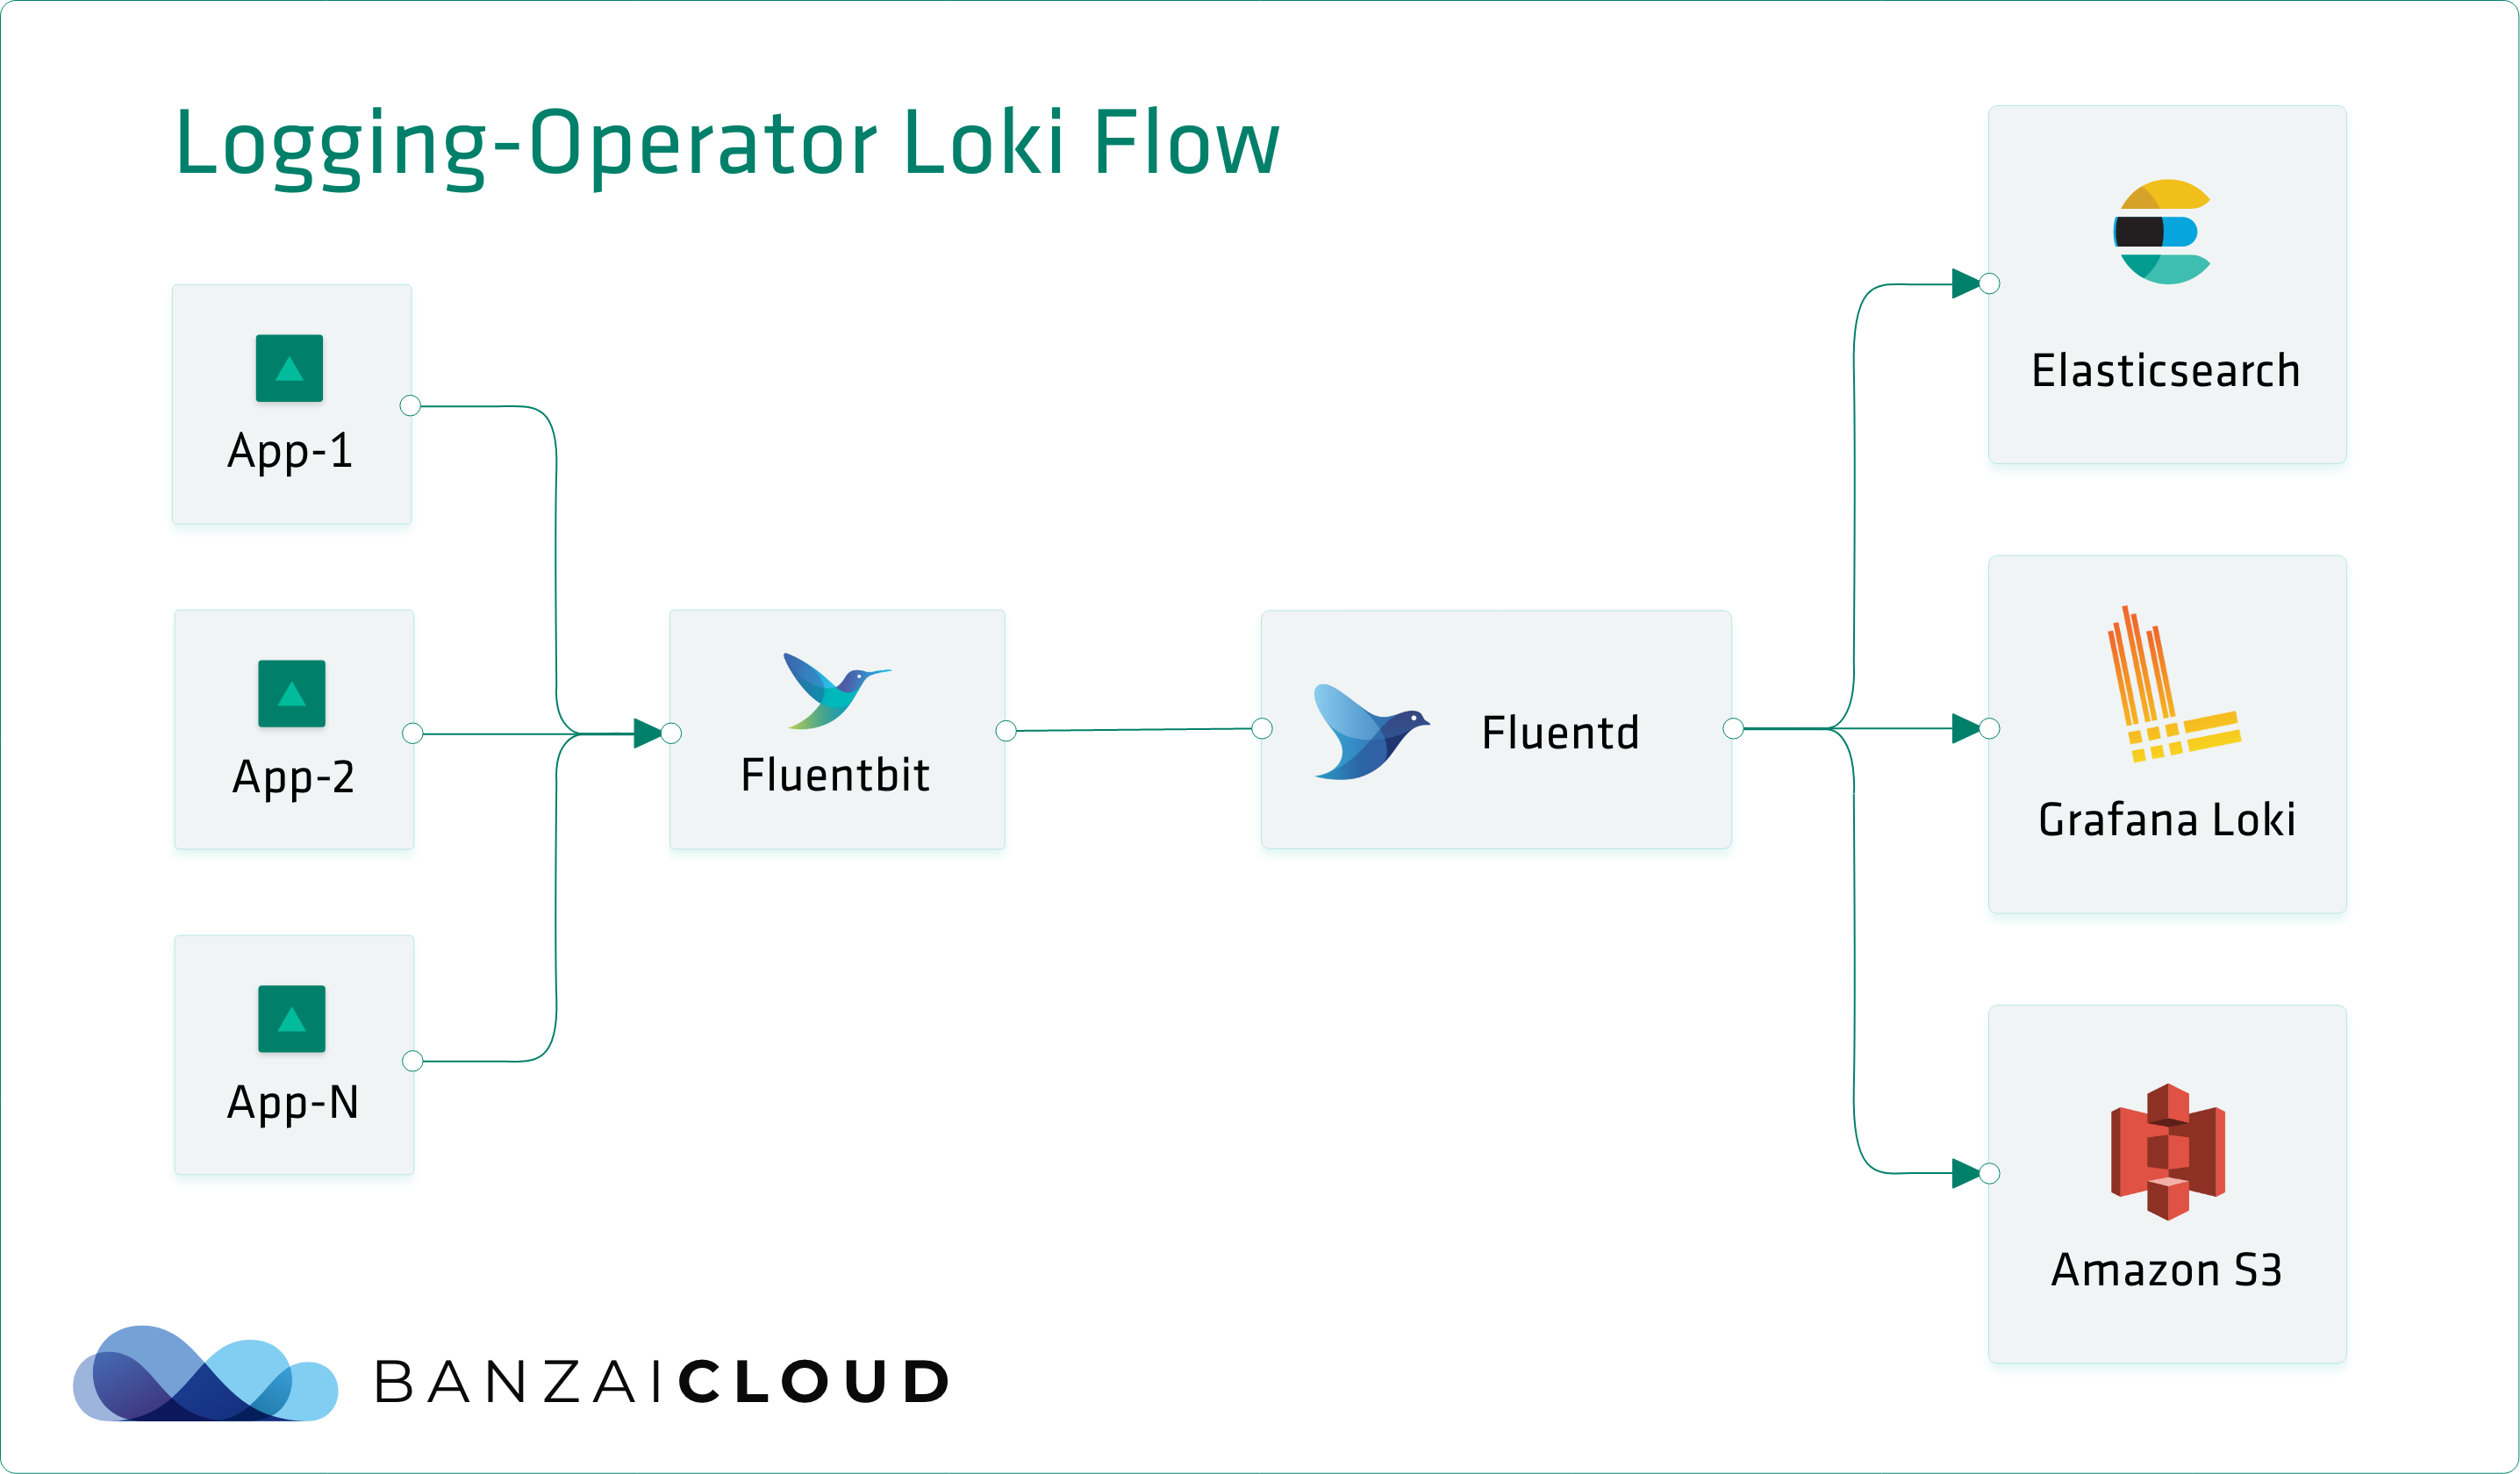
Connecting Loki to existing log flows 🔗︎
Promtail is a great tool when using exclusively Loki for your logging pipeline. However, in a production or even developer environment, this is not usually the case. Typically, you’ll want to transform your logs, measure metrics, archive raw data, ingest to other analyzer tools, etc. And, because fluentd and fluent-bit already provide a powerful logging pipeline, it seems unnecessary to try and shoe-horn Loki into such an environment.
A fluent-plugin-grafana-loki plugin exists in the official repository, but this is a general purpose tool, which lacks the necessary Kubernetes support. However, writing (or in this case extending) fluentd plugins is relatively easy, so Banzai Cloud has opensourced one: fluent-plugin-kubernetes-loki
UPDATE: The following section is outdated we contributed back to the upstream fluentd plugin!
Fluent-plugin-kubernetes-loki 🔗︎
In order to fit Loki into our existing flows, we forked the official fluentd output plugin and enriched it with labeling features. The problem was that fluent-bit already attached metadata to log records, as you can see from the following snippet:
{
   "log":"10.1.0.1 - - [13/Mar/2019:15:42:31 +0000] \"GET / HTTP/1.1\" 200 612 \"-\" \"kube-probe/1.13\" \"-\"\n",
   "stream":"stdout",
   "time":"2019-03-13T15:42:31.308708572Z",
   "kubernetes":{
      "pod_name":"understood-butterfly-nginx-logging-demo-7dcdcfdcd7-h7p9n",
      "namespace_name":"default",
      "pod_id":"1f50d309-45a6-11e9-b795-025000000001",
      "labels":{
         "app":"nginx-logging-demo",
         "pod-template-hash":"7dcdcfdcd7",
         "release":"understood-butterfly"
      },
      "host":"docker-desktop",
      "container_name":"nginx-logging-demo",
      "docker_id":"3a38148aa37aa30e6e2df96af95cbda7a47b0428689bb4152413f4be25532fda"
   }
}
Sadly, this metadata is not Loki compatible.
Our plugin remedies this by grabbing information from the kubernetes key and transforming it into Loki labels.
However, some special characters are forbidden in Loki’s label fields, such as . and -, so these are transformed to _.
Additionally, label names were not initially Prometheus compatible, and it was crucial to our set up that we use the same label keys Prometheus did.
Our first version introduced mappings that looked like this:
transform_map = {
    "namespace_name" => "namespace",
    "pod_name" => "pod",
    "docker_id" => "container_id",
    "container" => "container",
    "annotations" => nil,
}
Note: a
nilvalue means that keys with that value are to be deleted from the record map. Annotations usually have too many special characters and too much information in them to fit filtering.
Note that this plugin is a work in progress, and we add new features frequently. Although we have a lot of our own ideas on how to improve this plugin and make it a turnkey solution for Fluentd and Loki, we also want to ask you - our open source community of users and customers - what you would like to see. Please open an issue or submit a pull-request with your ideas on our Github.
If you want to learn more about Loki, visit the official introduction blog post.
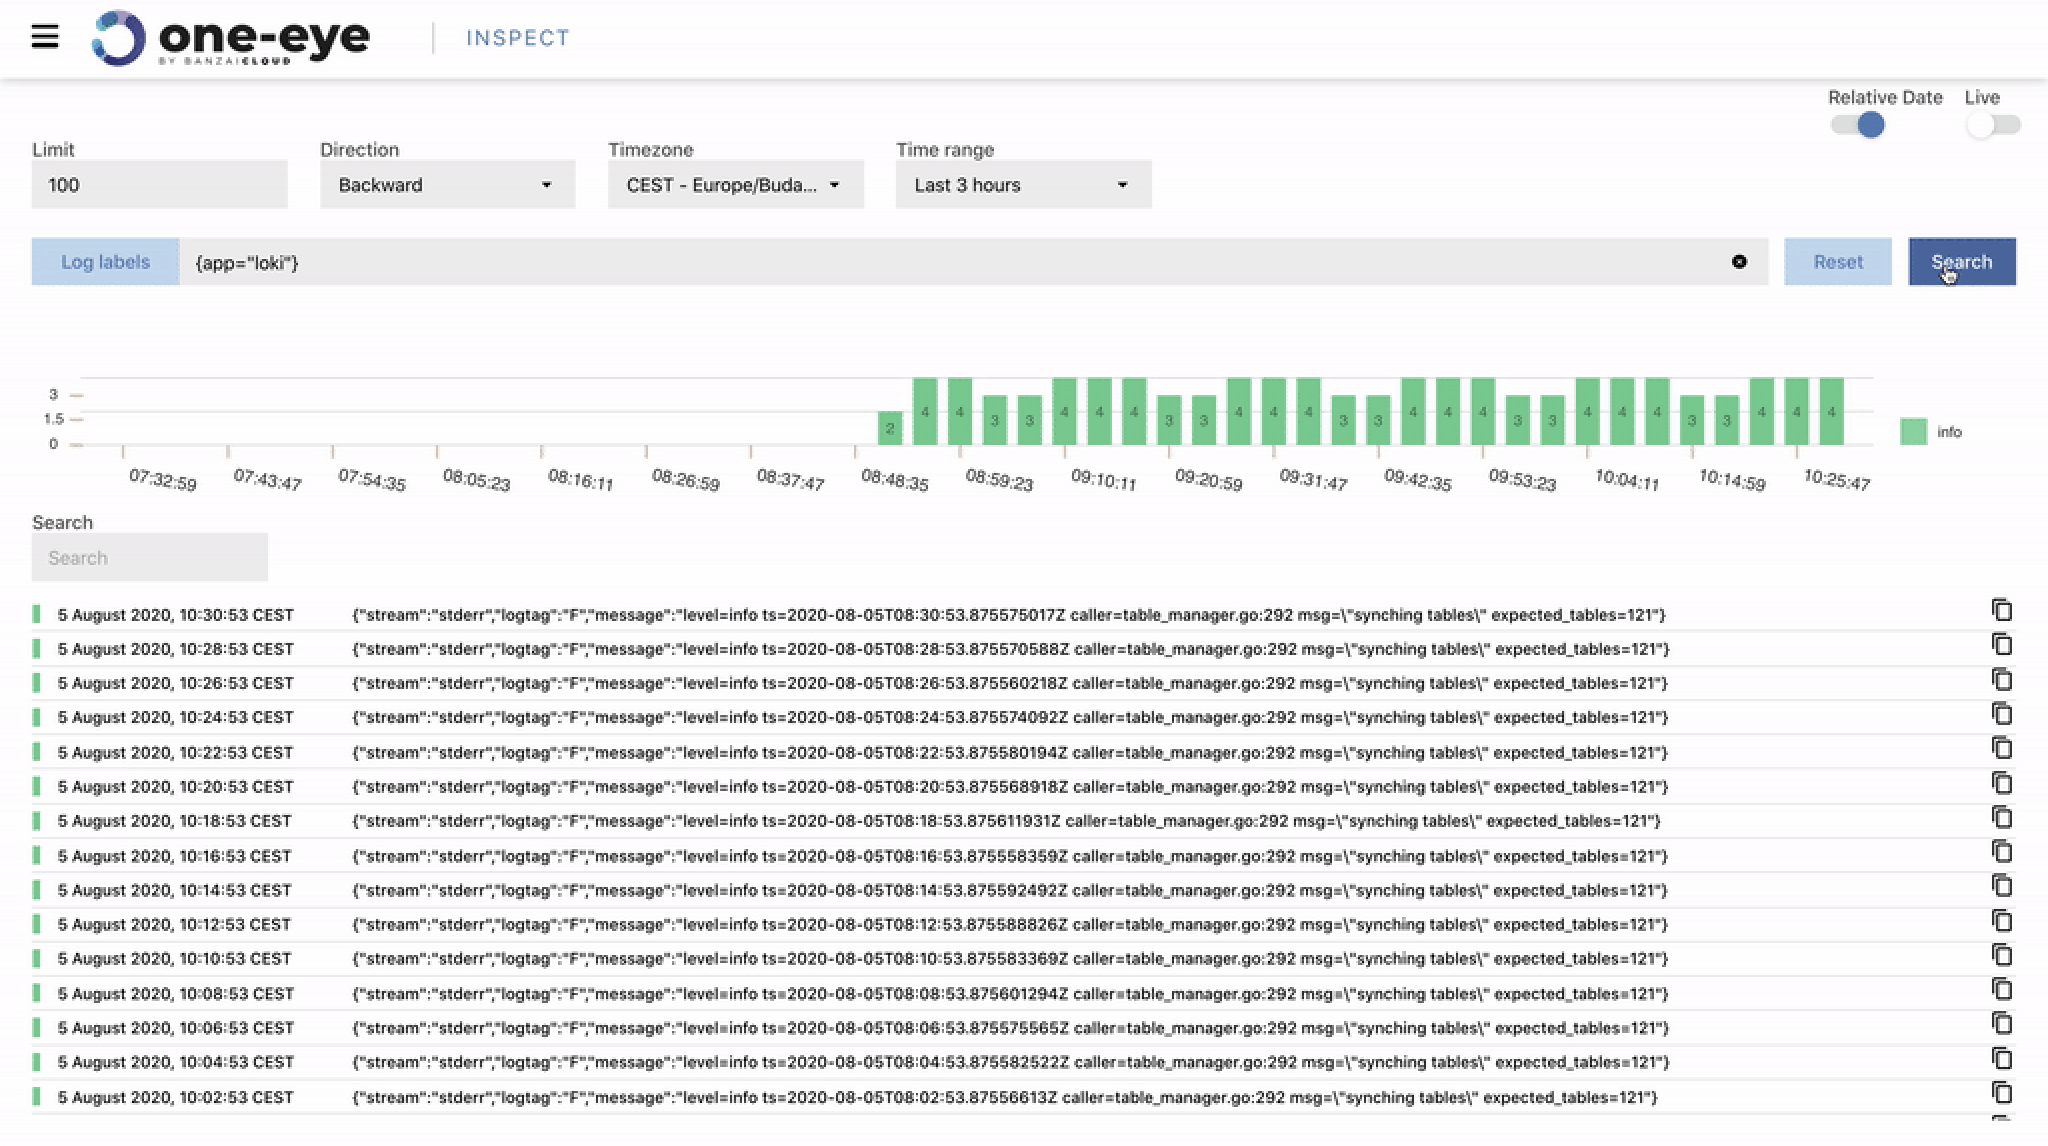
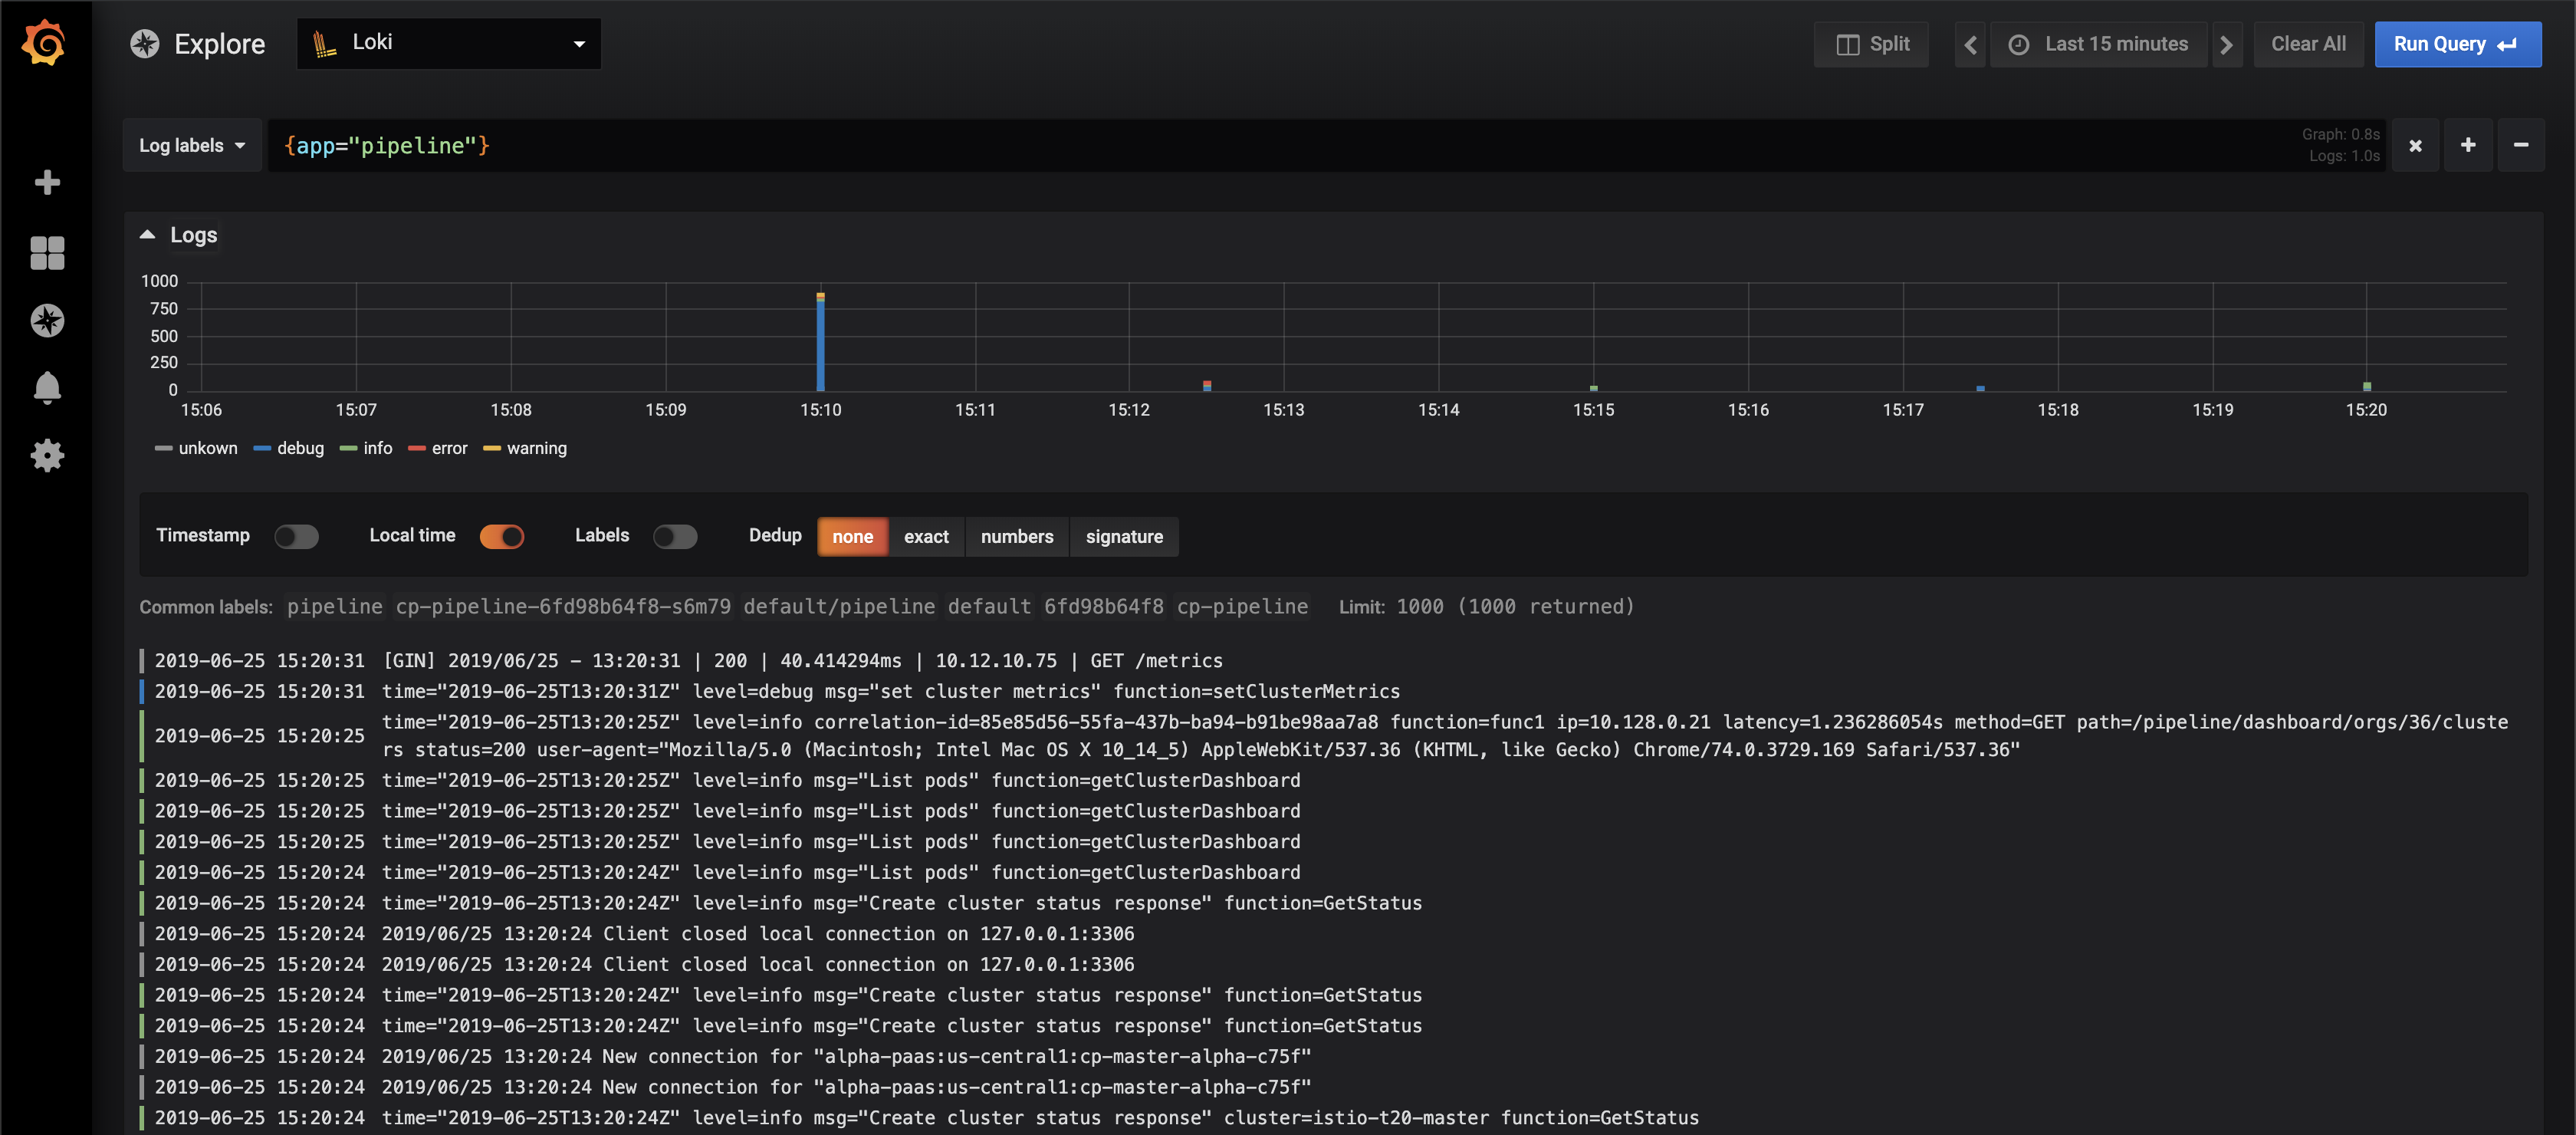
LogQL - the Loki query language 🔗︎
Loki’s default frontend is Grafana, and you’ll need to set-up the Explore section to connect with Loki before it’s ready. Now, in order to browse logs, we use any one of a few basic queries.
A log query consists of two parts: a log stream selector, and a filter expression. For performance reasons, begin by choosing a set of log streams, using a Prometheus-style log stream selector.
Loki comes with a simple yet powerful REST API
The log stream selector will reduce the number of log streams to a manageable volume, then the regex search expression will perform a distributed grep over those log streams.
The following examples are from the official documentation
Log Stream Selector
Wrap the label component of the query expression in curly brackets, {}, and then use the key value syntax to select your labels. Label expressions are separated by commas:
{app="mysql",name="mysql-backup"}Loki currently supports the following label matching operators:
| Operator | Action |
|---|---|
| = | exactly equal |
| != | not equal |
| =~ | regex-match |
| !~ | do not regex-match |
Example operator usage:
{name=~"mysql.+"}
{name!~"mysql.+"}
The same rules that apply for Prometheus Label Selectors apply to Loki Log Stream Selectors. After writing a Log Stream Selector, you can further filter results by writing a search expression. Search expressions can either be text or regex expressions.
Example queries:
{job="mysql"} |= "error"
{name="kafka"} |~ "tsdb-ops.*io:2003"
{instance=~"kafka-[23]",name="kafka"} != kafka.server:type=ReplicaManager
Filter operators can be chained and will sequentially filter down the expression - resulting log lines will satisfy every filter. Eg:
{job="mysql"} |= "error" != "timeout"The following filter types have been implemented:
| Filter | Action |
|---|---|
| |= | line contains string |
| != | line does not contain string |
| |~ | line matches regular expression |
| !~ | line does not match regular expression |
Using Loki with the Banzai Cloud logging-operator 🔗︎
Let’s take a look at a practical example. First, install the logging-operator. This only installs the controller.
helm repo add banzaicloud-stable https://kubernetes-charts.banzaicloud.com
helm repo update
helm install banzaicloud-stable/logging-operator
Due to some Helm issues with CRDs, we have separated out fluentd and fluent-bit resources and put them in another chart. That way we can ensure that all the CRDs are ready and that their fluentd and fluent-bit components are safely installed.
helm install --namespace logging --name logging-demo banzaicloud-stable/logging-demo \
 --set "loki.enabled=True"
Our logging pipeline is ready, we may now define inputs and outputs. Before we do that, let’s install Loki.
Add Loki Chart repo
helm repo add loki https://grafana.github.io/loki/charts
helm repo update
Install Loki
helm install --name loki loki/lokiInstall Grafana with Loki datasource
helm install --name grafana stable/grafana \
 --set "datasources.datasources\\.yaml.apiVersion=1" \
 --set "datasources.datasources\\.yaml.datasources[0].name=Loki" \
 --set "datasources.datasources\\.yaml.datasources[0].type=loki" \
 --set "datasources.datasources\\.yaml.datasources[0].url=http://loki:3100" \
 --set "datasources.datasources\\.yaml.datasources[0].access=proxy"
Get Grafana login credantials
kubectl get secrets grafana -o json | jq '.data | map_values(@base64d)'Grafana Port-forward
kubectl port-forward svc/grafana 3000:80If you want to install Prometheus as well, just add the --set prometheus.enabled=true parameter. Now we’re ready to add the logging-operator CR and start log collecting.
UPDATE: This section is for Logging Operator V1. For the new version please follow the V2 docs.
apiVersion: "logging.banzaicloud.com/v1alpha1"
kind: "Plugin"
metadata:
  name: "loki-demo"
spec:
  input:
    label:
      app: "nginx-logging-demo"
  output:
    - type: "loki"
      name: "loki-demo"
      parameters:
        - name: url
          value: "http://loki:3100"
        - name: extraLabels
          value: "{\"env\":\"demo\"}"
        - name: flushInterval
          value: "10s"
        - name: bufferChunkLimit
          value: "1m"
That’s it! If you’ve done everything right, you should be ready to browse your logs in Grafana.
Install log-cli 🔗︎
Loki provides another tool to fetch your logs called log-cli. This command line tool is really handy if you are not browsing logs but want to run exact queries.
go get github.com/grafana/loki/cmd/logcliIf you’re running Loki without ingress enabled, you can simply port-forward to the pod.
kubectl port-forward svc/loki-loki 3100You can run the same expressions as with the Grafana interface.
logcli --addr="http://127.0.0.1:3100" query '{env="demo"} |= "error"'Note: you need to extend your $PATH with the go bin location
Update: Logging operator v3 (released March, 2020) 🔗︎
We’re constantly improving the logging-operator based on feature requests of our ops team and our customers. The main features of version 3.0 are:
- Log routing based on namespaces
- Excluding logs
- Select (or exclude) logs based on hosts and container names
- Logging operator documentation is now available on the Banzai Cloud site.
Check The Kubernetes logging operator reloaded post for details.
About Banzai Cloud Pipeline 🔗︎
Banzai Cloud’s Pipeline provides a platform for enterprises to develop, deploy, and scale container-based applications. It leverages best-of-breed cloud components, such as Kubernetes, to create a highly productive, yet flexible environment for developers and operations teams alike. Strong security measures — multiple authentication backends, fine-grained authorization, dynamic secret management, automated secure communications between components using TLS, vulnerability scans, static code analysis, CI/CD, and so on — are default features of the Pipeline platform.