


Without a doubt Prometheus has become the de facto standard monitoring solution for Kubernetes, the same way it has become a core component of the Pipeline platform’s monitoring service. However, Prometheus already has a well defined mission with a focus on alerts and the storage of recent metrics.
Prometheus’ local storage is limited by single nodes in its scalability and durability. Instead of trying to solve clustered storage in Prometheus itself, Prometheus has a set of interfaces that allow integration through remote storage systems.
Therefore, long-term storage of Prometheus metrics is left up to 3rd parties. There are several projects out there with differing approaches:
M3DB 🔗︎
M3DB was developed primarily for collecting high volumes of monitoring time series data, then for distributing the storage of that data in a horizontally scalable manner that most efficiently leverages the hardware at its disposal. This is useful because time series data that is read infrequently is not kept in memory.
Cortex 🔗︎
Cortex provides horizontally scalable, highly available, multi-tenant, long term storage for Prometheus.
Thanos 🔗︎
Thanos is an open source, highly available Prometheus setup with long term storage and querying capabilities.
All of these projects may fit specific use cases, but none of them is a silver-bullet. The following benefits made us decide to go with Thanos:
- Stateless components
- Stable StoreAPI between services
- Historic metrics and the whole state are persisted to object storage
- Last but not least it is a CNCF project
At Banzai Cloud we put a premium on observing our customers Kubernetes clusters. To do that, we make sure that you can setup, configure and manage Prometheus (along with the other observability tools we use) with just one click. However, we also manage hybrid clusters across five clouds and on-prem from a single Pipeline control plane, so we needed a solution that would allow us to federate metrics, and collect them into a single place for long term storage, querying and analysis. While every use case is different, we settled on Thanos as a standardized solution to this problem for the Pipeline platform.
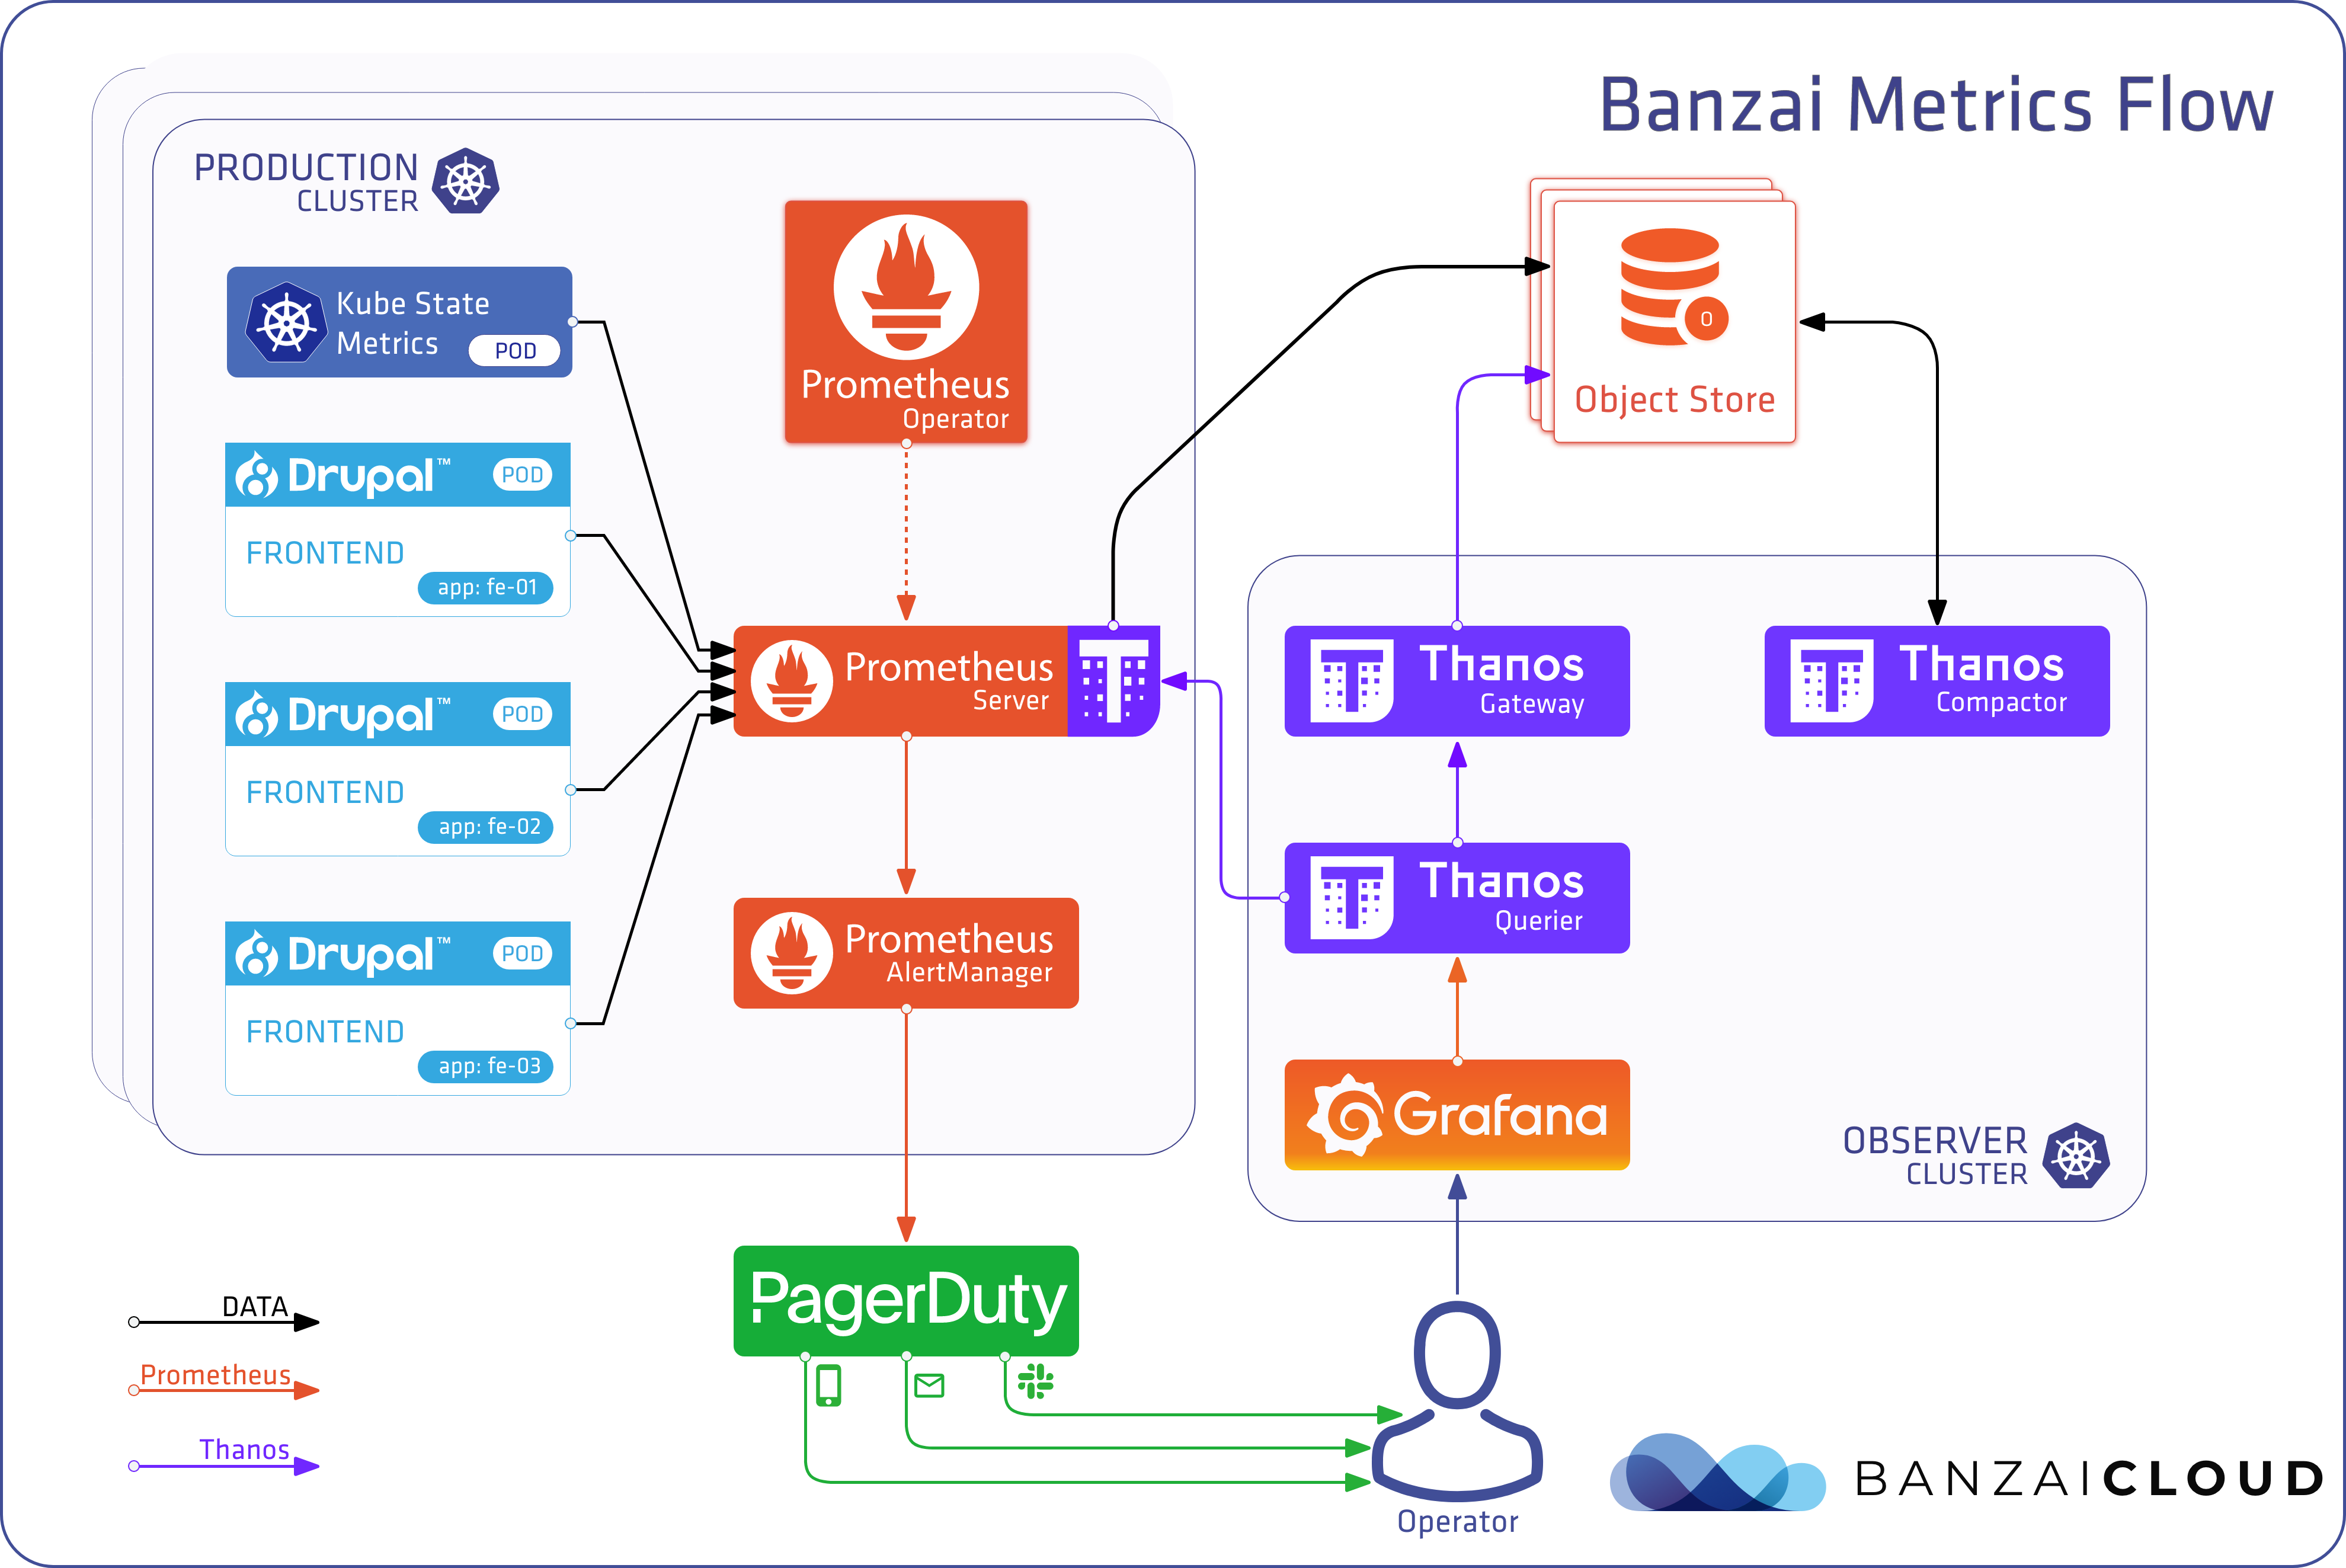
Let’s dig in, and take a deep dive into the multi-cluster monitoring using Thanos.
Thanos components 🔗︎
We open sourced our Thanos Operator to automate Thanos management on Kubernetes. Check out our introduction blog post.
Thanos is built from a handful of components, each with a dedicated role within the architecture. The easiest way to gain a basic understanding of how these work is to take a quick look at the responsibilities assigned to each one.
- Sidecar
- Serves as a sidecar container alongside Prometheus
- Uploads Prometheus chunks to an object storage
- Supports object stores like S3, Google Cloud Storage, Azure Storage and more
- Prometheus operator, which we also use in our integrated monitoring service, solves the injection of this sidecar transparently
- Store
- Retrieves chunks from object storage in order to provide long term metrics for Query
- Supports time-based partitioning
- Supports label-based partitioning
- Compact
- Creates downsampled summaries of chunks to expedite queries for long time ranges
- Has three levels; Raw chunks contain all samples, while 5m and 1h chunks contain aggregated samples for every five minutes or one hour respectively
- Query
- Is the entry point for PromQL queries
- Deduplicates results from different sources
- Supports partial responses
- Rule
- Is a simplified version of Prometheus that does not require a sidecar and does not scrape or do PromQL evaluations
- Writes results back to the disk in the Prometheus 2.0 storage format
- Participates in the system as a store node, which means that it exposes StoreAPI and uploads its generated TSDB blocks to an object store
- Bucket
- Inspects data in object storage buckets
If you want to take a deep dive into Thanos, there are some great slides available here
How downsampling works? 🔗︎
You should keep in mind that the goal of downsampling in Thanos is not to save disk space. It provides a way to quickly evaluate queries with large time intervals, like months or years.
In fact, downsampling doesn’t save you any space but, instead, adds two new blocks for each raw block. These are slightly smaller than, or close to, the size of raw blocks. This means that downsampling slightly increases the amount of storage space used, but it provides a massive performance and bandwidth use advantage when querying long intervals.
Let’s take a look at how this works. There are three levels of granularity:
- raw — this is the raw scraped metrics from Prometheus
- 5m — for chunks compacted into five minutes
- 1h — for chunks compacted into one hour
A compacted chunk consists of five fields. Each of these store the result of a different function from the original samples.
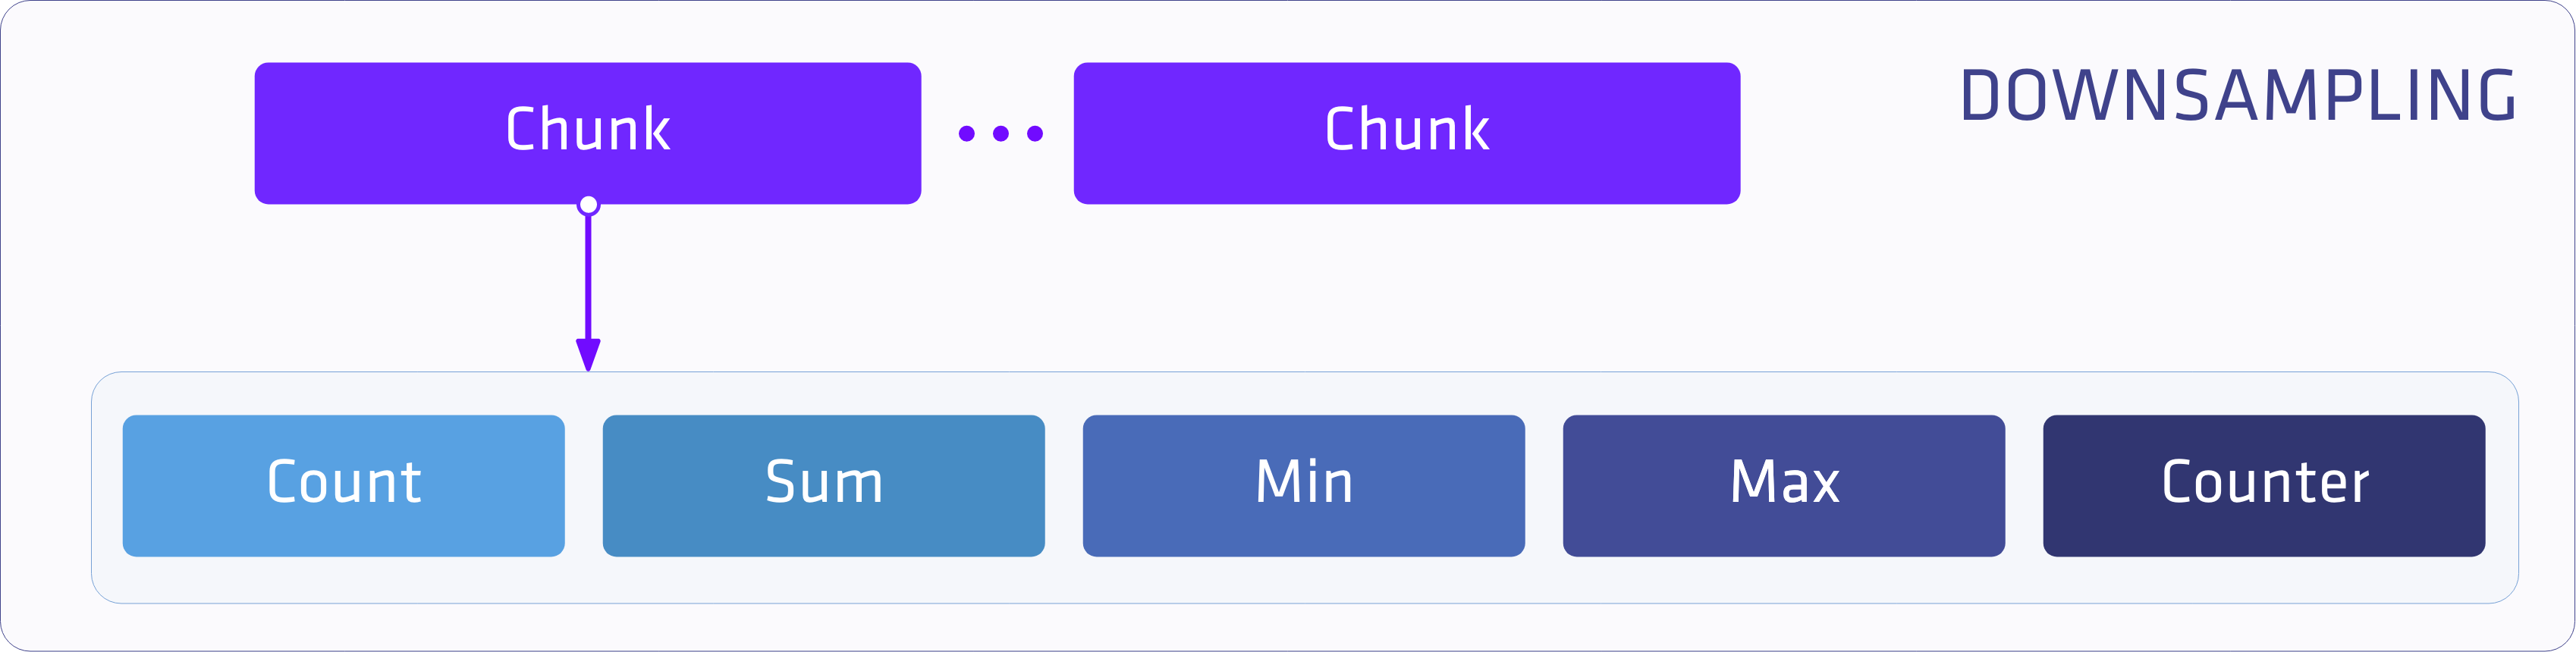
These different types are required for different functions of the PromQL. Trivial functions like min and max can simply use their corresponding attributes, but it is also possible to calculate more complex functions from the aggregated values, like avg from count/sum.
So how do these chunks help with our queries? For the purposes of comparison, the following table demonstrates queries made on raw and compacted data.
| Query Range | Samples for 1000 series | Decompression Latency | Fetched chunks size |
|---|---|---|---|
| 30m | ~120 000 | ~5m | ~160KB |
| 1d | ~6 million | ~240ms | ~8MB |
| 30d (raw) | ~170 million | ~7s | ~240MB |
| 30d | ~8 million | ~300ms | ~9MB |
| 1y (raw) | ~2 billion | ~80s | ~2GB |
| 1y | ~8 million | ~300ms | ~9MB |
Originally this table is from Thanos Deep Dive: Look into Distributed System
Querying long range without compacted chunks would mean that you have to download and handle an amount of data proportional to the length of the range.
In the 1y example, however, you’ll see that instead of downloading 2 billion samples (2GB), compaction allows us to fetch and process as few as 8 million samples (9MB) for presenting a yearly graph, which makes a big difference.
Now, you may be wondering how Thanos chooses which type of chunks to use. It takes a simple approach, which is to check whether 5 samples will fit into a time range step. For example, in a query of a one month time frame, we would typically use 30m steps (the time between relevant data points); in 30m steps it’s easy to fit six 5m chunks. If it were raw data it would be more like 10m steps.
Metric query flow 🔗︎
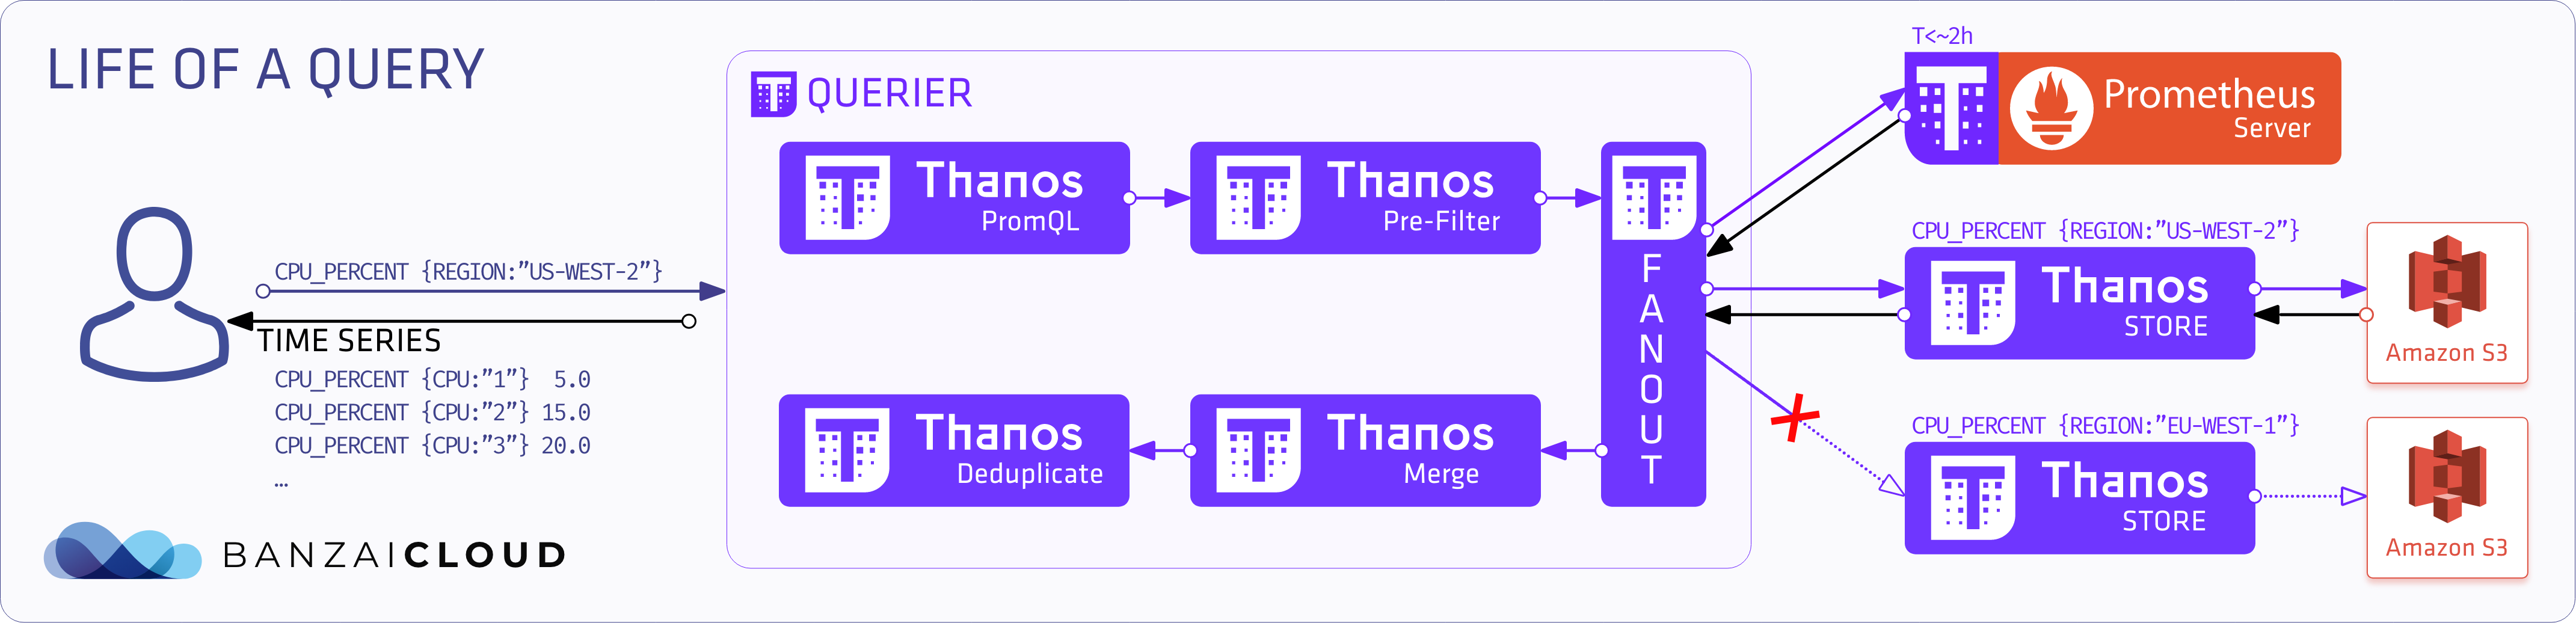
The following diagram shows the “life of a query”.
- The PromQL query is posted to the
Querier - It interprets the query and goes to a pre-filter
- The query fans out its request for
stores,prometheusesor otherquerieson the basis of labels and time-range requirements - The
Queryonly sends and receives StoreAPI messages - After it has collected all the responses, it merges and deduplicates them (if enabled)
- It then sends back the series for the user
Time-based partitioning 🔗︎
By default, Thanos’ Store Gateway looks at all of the data in the Object Store and returns it based on the query’s time range.
But if we have a lot of data we can scale it horizontally. Our first and most obvious option is to use time-based partitioning. All StoreAPI sources advertise the minimum and maximum times available and those labels that pertain to reachable series. Using parameters, we can tweak these arguments to narrow the scope of this partition, making it smaller and balancing the load. This parameter can be in relative time as well as a concrete date.
An example setup with 3 Store servers might look like this:
- A:
max-time=-6w - B:
min-time=-8wandmax-time=-2w - C:
min-time=-3w
Note: filtering is done on the level of chunks, so Thanos’ Store might still return samples which are outside of
--min-timeand--max-time.
As you can see, you can set overlapping ranges as well to improve redundancy. Thanos Querier deals with overlapping time series by merging them together.
Label-based partitioning 🔗︎
Label-based partitioning is similar to time-based partitioning, but instead of using time as a sharding key, we use labels. These labels come from Prometheus’ external labels and explicitly set labels based on Thanos components. The relabel configuration is identical to Prometheus’ relabel configuration. We can see how this works in the following example:
relabel config
- action: keep
  regex: "eu.*"
  source_labels:
  - region
Such a configuration means that the component in question will only match metrics with a region label starting with the eu prefix.
How deduplication works? 🔗︎
For a detailed explanation, please read what the official documentation has to say on this topic
It is typical for identical Prometheus servers to be set up as HA pairs. This approach eliminates the problems that arise from a single Prometheus instance failing. However, to make the Prometheus querying seamless, Thanos provides query time deduplication.
To make this possible, we need only to set up one or more replica labels on the sidecar component, and the query component does the rest. Let’s take a look at how this is handled in the Thanos documentation.
An example of single replica labels
Prometheus + sidecar “A”: cluster=1,env=2,replica=A
Prometheus + sidecar “B”: cluster=1,env=2,replica=B
Prometheus + sidecar “A” in different cluster: cluster=2,env=2,replica=A
An example query looks like this: up{job="prometheus",env="2"}.
With deduplication the results are:
up{job="prometheus",env="2",cluster="1"} 1
up{job="prometheus",env="2",cluster="2"} 1
Without deduplication the result looks like this:
up{job="prometheus",env="2",cluster="1",replica="A"} 1
up{job="prometheus",env="2",cluster="1",replica="B"} 1
up{job="prometheus",env="2",cluster="2",replica="A"} 1
One Eye 🔗︎
As you see, Thanos is a powerful tool that allows you to build highly available, multi-cluster monitoring systems. However, there are several difficulties that naturally arise when creating a production-ready version of such a system:
- Configuring Thanos service discovery for multiple clusters
- Sharding Prometheus instances
- Configuration of transport layer TLS and certificates
- Proper scaling of resources (how many metrics, and what kind of resources are needed, etc)
- Setting up Label/Time range shards
- Keeping your configuration up to date and propagating changes to clusters
- Adding a caching layer
As a rule of thumb, we automate the setup of all the observability tools that are necessary for our customers to use Pipeline’s hybrid-cloud container management platform, and this goes for Thanos and Prometheus as well.
Built on the Prometheus operator, Thanos, Grafana, Loki, the Banzai Cloud logging operator, and lots of other open source components, we are rapidly constructing the ultimate observability tool for Kubernetes, One Eye, designed to solve all the problems mentioned above, and allow for the seamless collection of logs and metrics, as well as their automatic correlation. Read more about One Eye.
Attention: We open sourced our Thanos Operator to automate Thanos management on Kubernetes. Check out our introduction blog post.
While this project is still very much under way (we’ll be releasing it late Q1), feel free to set up your Thanos infrastructure using the highly popular Thanos Helm chart maintained by Banzai Cloud.