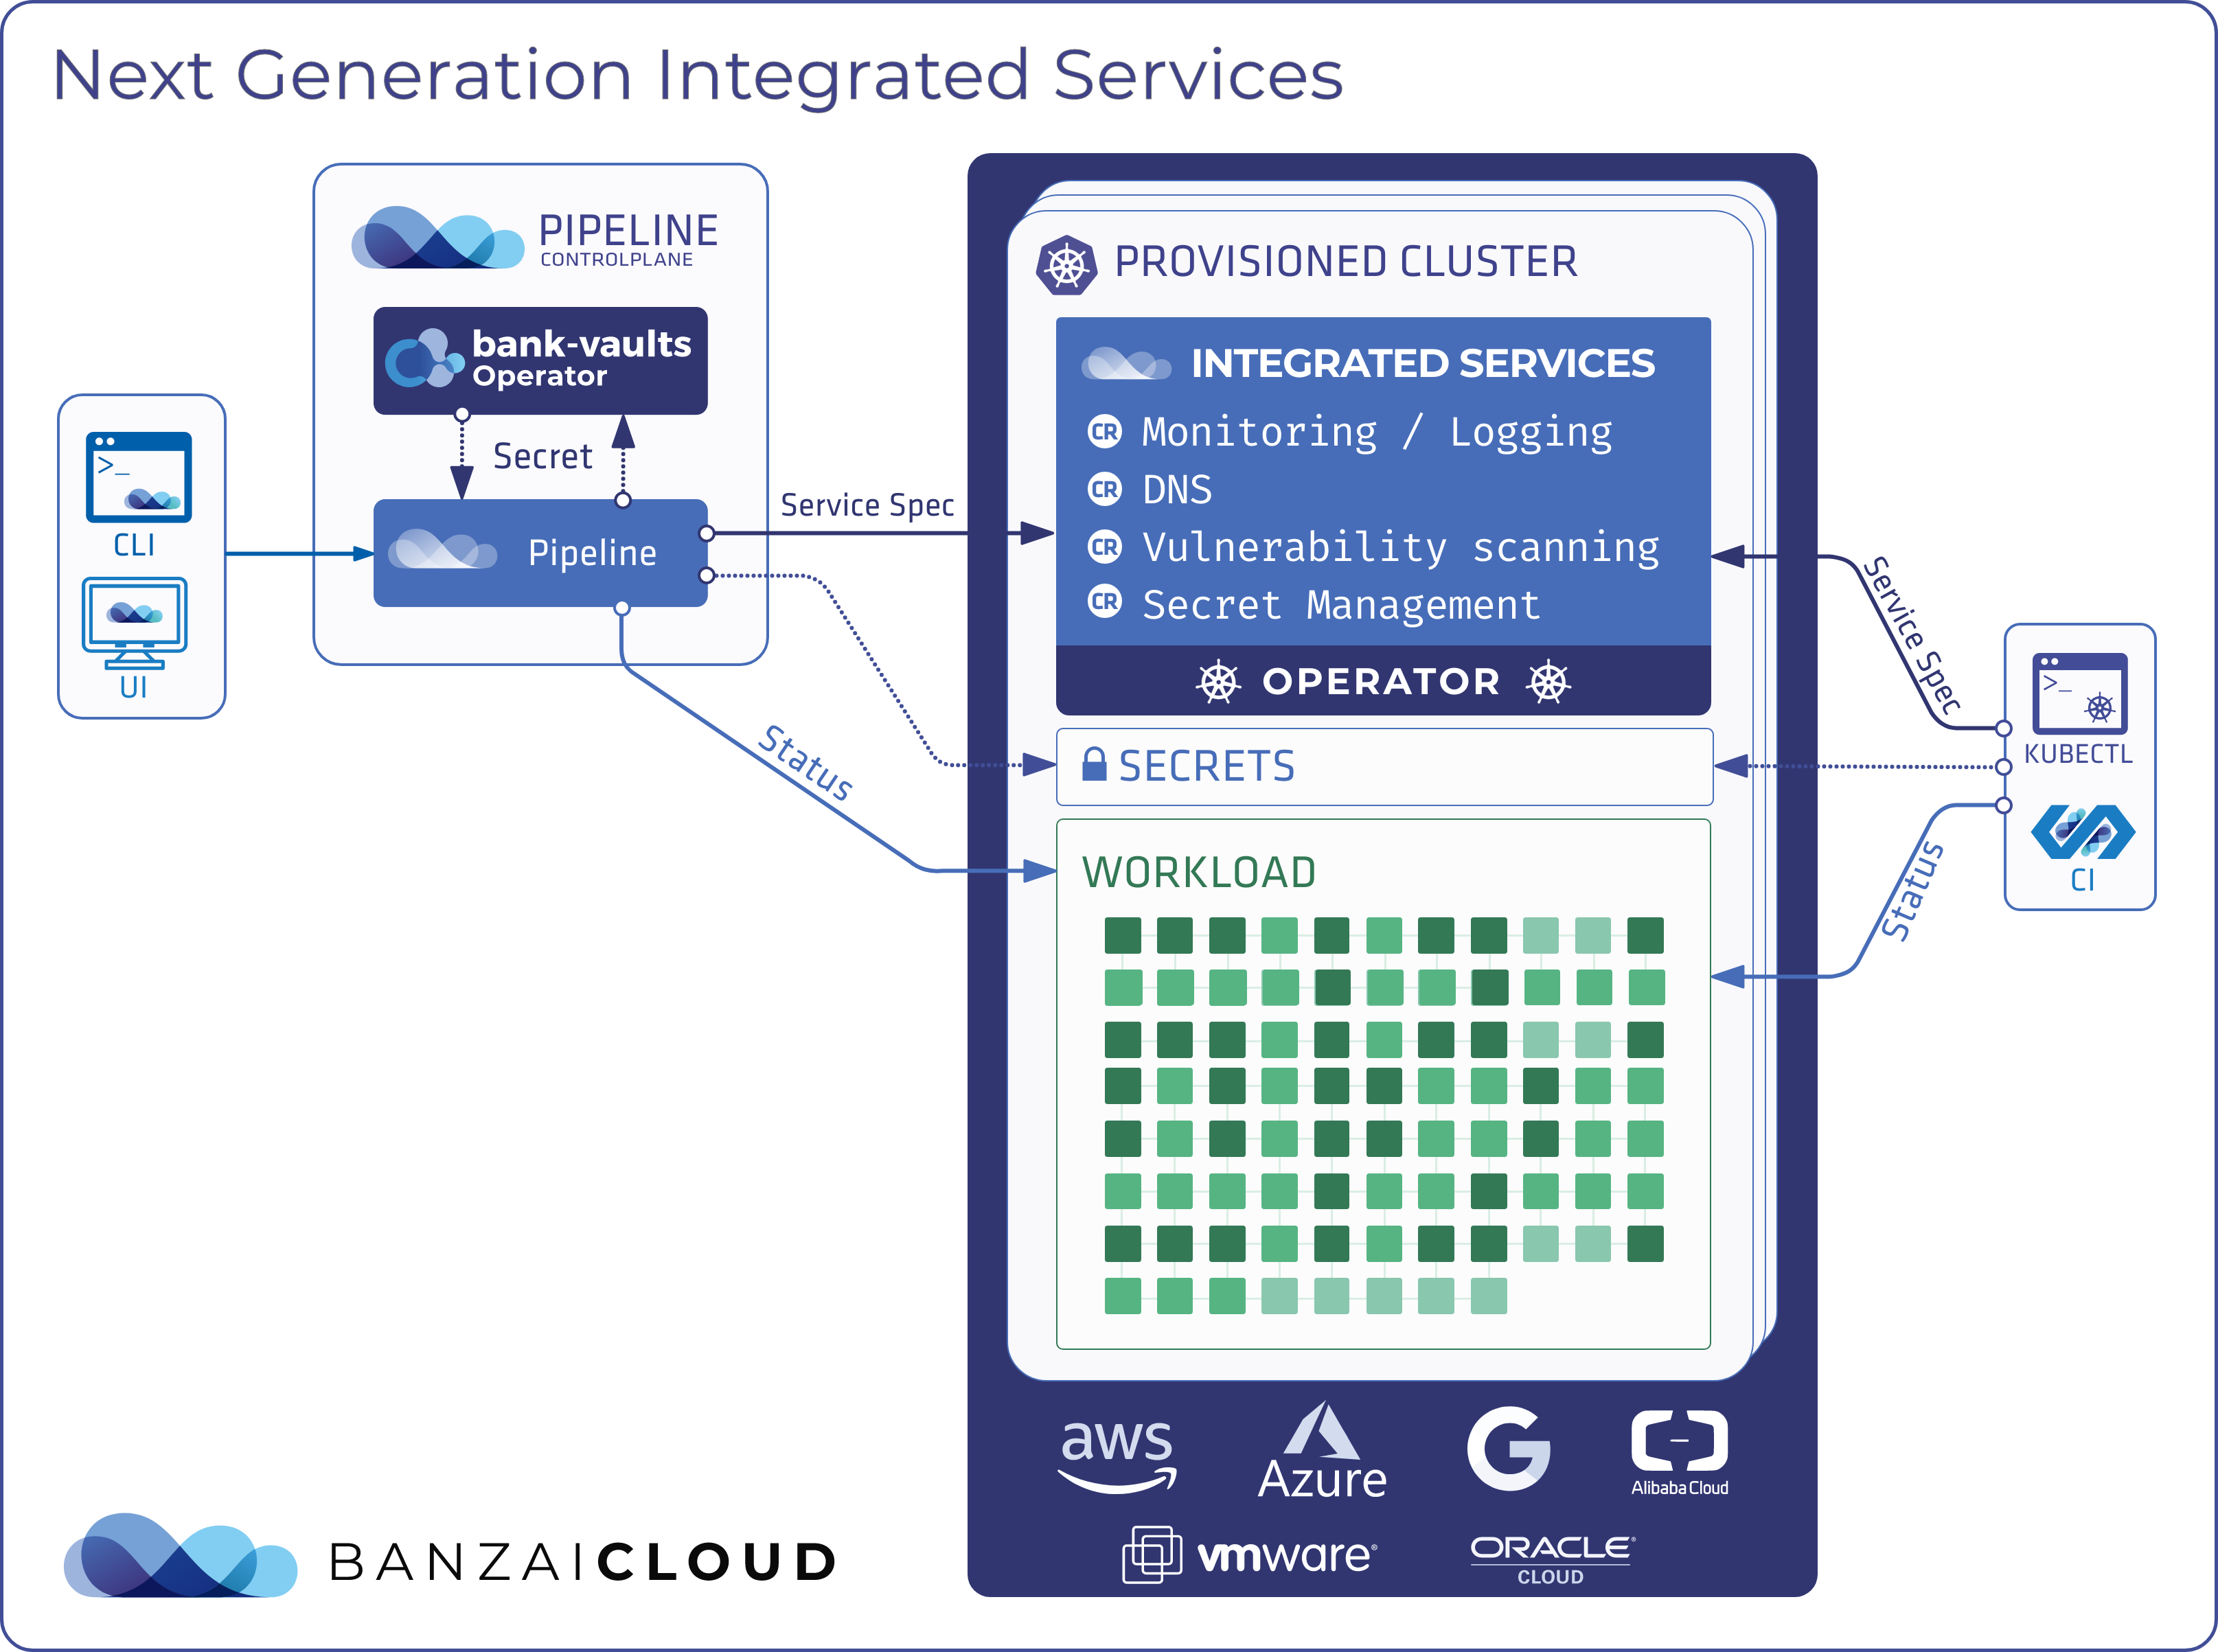


At Banzai Cloud we support and manage hybrid Kubernetes clusters for our customers across five clouds and on-prem (bare metal, VMware). Therefore, the ability and fluency required to observe these clusters is an absolute must. Very frequently, the Pipeline control plane is tasked with managing multiple Kubernetes clusters, which it does through our own CNCF certified Kubernetes distribution, PKE, or a cloud provider-managed distribution. When that happens, it’s important that we federate metrics, collect them into a single place for querying, analysis and long term storage. As discussed in a previous post, we have standardized multi-cluster-monitoring on Thanos, and we also maintain an open source and very popular Thanos Helm chart.
![]()
For awhile, this Thanos Helm chart based approach worked well. However, the high number of nodes and clusters we were managing eventually began to push the limits of what was feasible; because the number of clusters that we manage from single Pipeline control planes is so high, each cluster frequently has a different layout, configuration and spread across clouds and datacenters (note that we support four different ways of building hybrid clouds on Kubernetes), so configuring them and keeping them working properly was quite a challenge. To make matters worse, Thanos has several different components that can be deployed in any number of ways. These components must work properly and securely in conjunction with Prometheus, which requires discovery (or hardcoded endpoints). Our next step, then, was to create a Thanos operator.
We have considerable experience in writing operators, and have produced quite a few popular ones, such as:
For more operators, please visit our GitHub page. As you might expect, during the development of different operators we began to recognize similar patterns and snippets of code. In accordance with the DRY (Don’t Repeat Yourself) principle, we refactored these common parts into libraries like the Kubernetes object matcher library and our operator tools library.
Today, we’re very excited to announce the alpha release of the Banzai Cloud Thanos operator. It’s our hope that, as with our other operators, a healthy community will grow up around this release and help to drive innovation in the future.
Also, we’ll be introducing a preview of the One Eye project, the ultimate observability tool for Kubernetes. One Eye brings observability to multi-cluster Kubernetes infrastructures and automates the collection, correlation, and storage of logs and metrics. Built on the Thanos operator, the Fluent ecosystem logging operator, Prometheus operator, Grafana, Loki and more, One Eye is a project we’ve been developing for quite some time, and is the only tool you’ll ever need to effortlessly observe clusters. Subscribe here if you’re interested in a demo, or willing to become an early adopter.
Thanos operator, showtime 🔗︎
There are some prerequisites to kickstarting your Thanos operator experience, such as a Kubernetes cluster and making sure you have all your dependencies set up (like Prometheus and Grafana). Don’t worry though, you can easily create a Kubernetes cluster across any number of supported clouds and datacenters with the free, hosted version of Pipeline; the One Eye CLI takes care of everything else (dependencies and configurations).
For simplicity’s sake, we’ll demo the Thanos operator for the first time in a single cluster environment (where both the produced metrics and all of Thanos’ components will be deployed). In another post we’ll showcase how we automated multi-cluster monitoring with Thanos, wherein metrics are produced in multiple clusters. It should be noted that the storing, compacting, querying and analyzing of these metrics is done on a separate Kubernetes cluster.
Install prerequisites 🔗︎
First, we need to create an object store. Thanos supports many types of object storage, as documented here. For our demo we’ll be using Amazon S3.
Install with the One Eye CLI - interactive way 🔗︎
During the interactive mode, the One Eye CLI will ask for the name of the bucket and the associated AWS secrets, and will install Thanos and all dependencies (e.g. Prometheus).
Register for an evaluation version and run the following command to install the CLI tool:
As you might know, Cisco has recently acquired Banzai Cloud. Currently we are in a transitional period and are moving our infrastructure. Contact us so we can discuss your needs and requirements, and organize a live demo.
install the One Eye CLI and deploy the Thanos operator
Evaluation downloads are temporarily suspended. Contact us to discuss your needs and requirements, and organize a live demo.
Install with the One Eye CLI - non-interactive way 🔗︎
If you’ve already exported your AWS credentials as environment variables, you can create a Bucket configuration with the following commands:
create object store configuration
cat << EOF > object-store.yaml
type: S3
config:
  endpoint: "s3.eu-west-1.amazonaws.com"
  bucket: "test-bucket"
  region: "eu-west-1"
  access_key: "${AWS_ACCESS_KEY_ID}"
  secret_key: "${AWS_SECRET_ACCESS_KEY}"
EOF
create the Kubernetes secret from the object store configuration
kubectl create secret generic one-eye --from-file=object-store.yaml=object-store.yaml
install the One Eye CLI and deploy the Thanos operator
Evaluation downloads are temporarily suspended. Contact us to discuss your needs and requirements, and organize a live demo.
verify the installation by opening the thanos query page
one-eye thanos connect
Install with Helm 🔗︎
This will require several manual steps and configurations, so please follow along with the manual, here.
Note: we use Helm 3
Benefits of an operator 🔗︎
While we (and our customers) use Helm quite a lot, managing applications with Helm charts has its drawbacks. We also love automation, and are constantly looking for ways to improve and automate steps that were previously manual. This helps us to properly integrate Thanos into the stack that we’re trying to build. Specifically, the operator helps us:
- Auto discover endpoints
- Manage persistent volumes
- Configure metrics
- Configure simple TLS
This is not a complete list, and there is already work being done to add the following:
- Tracing configuration
- Endpoint validation
- Certificate management
- Advanced secret configuration
Now let’s dig in.
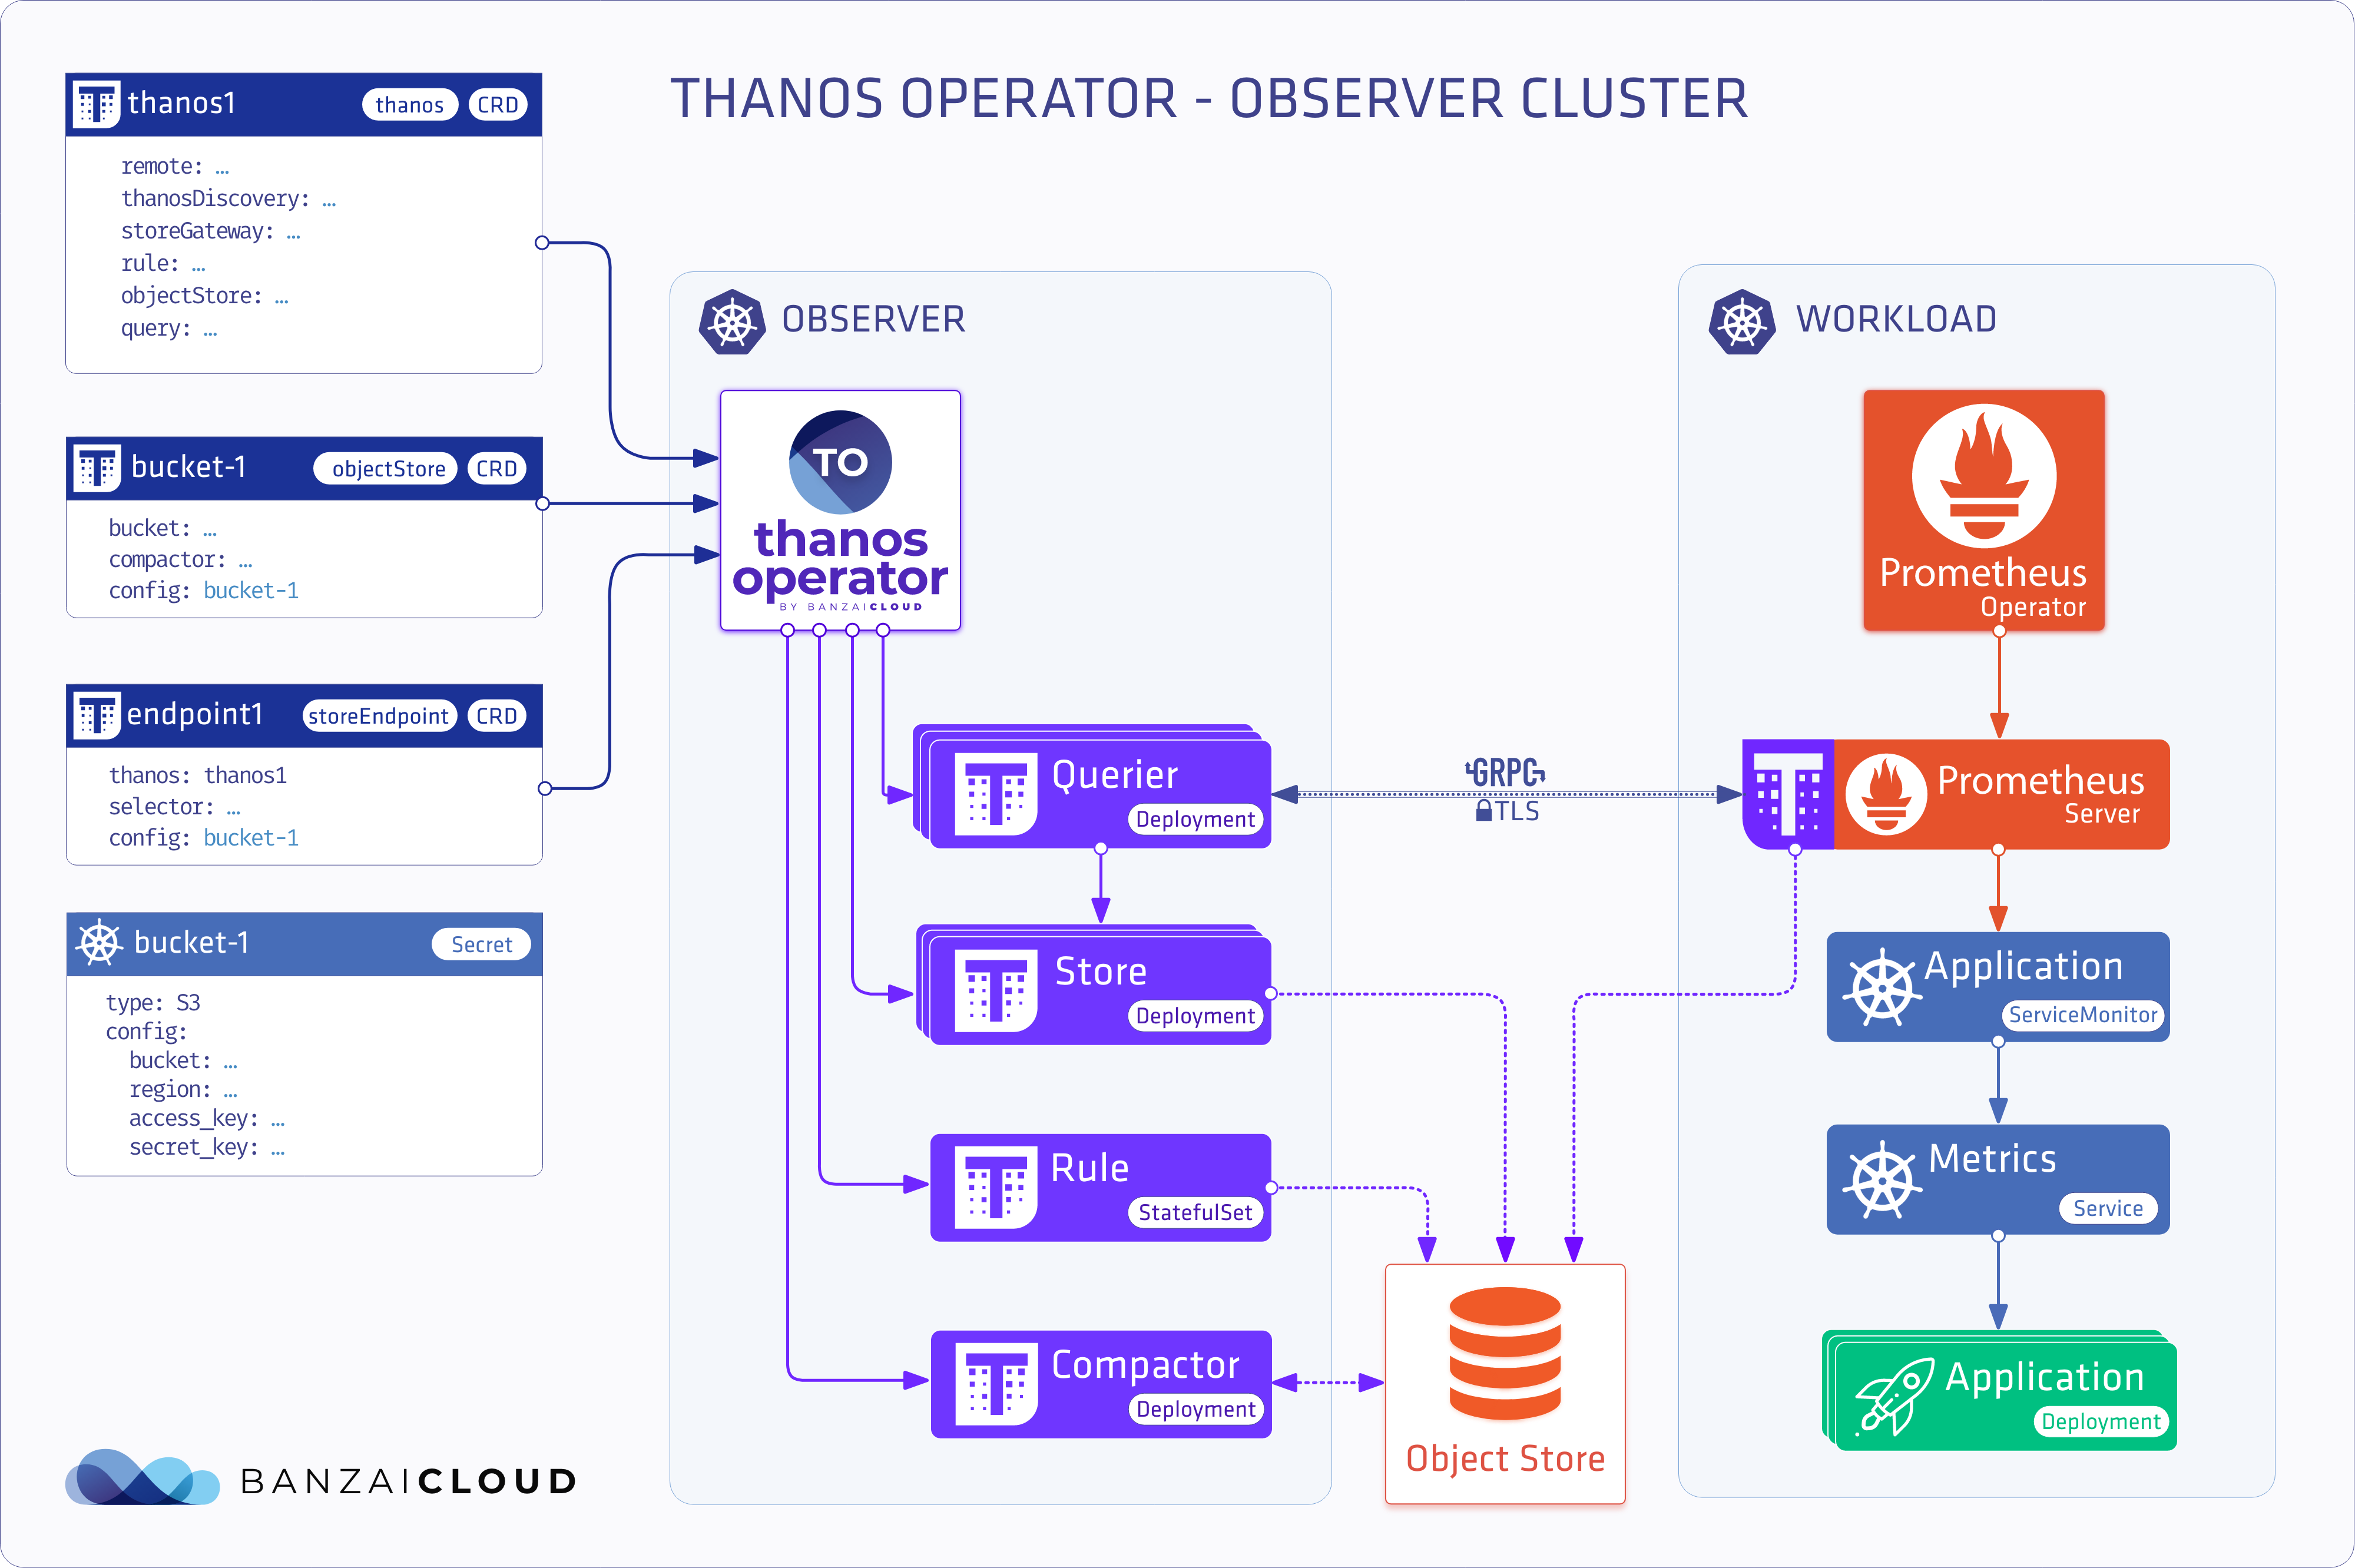
Thanos Operator CRDs explained 🔗︎
As is typical, the Thanos operator is instrumented via custom resources, so let’s take a look at the CRDs it uses.
ObjectStore 🔗︎
This custom resource is responsible for bucket management. Thanos
compacts and downsamples on storage buckets, and it is highly recommended
that you run only one compactor per bucket.
Generally speaking, more than one is not semantically concurrency safe and must be deployed as a singleton against a bucket.
Moreover, there is a great bucket inspection tool, called bucket, that provides
a simple web interface for chunks stored in buckets.
Thanos & StoreEndpoint 🔗︎
Thanos is the main custom resource responsible for Query, Store and Rule configurations. It has a special relationship with StoreEndpoint, which represents distinct StoreAPI endpoints. These can be Sidecar, Store, Rule or any other Store API provider. Thanos resources instantiate per StoreEndpoint. This means that you can use a single Thanos configuration for several Prometheus instances or clusters.
Now let’s look at some deployment examples to help us understand the CRDs a little better.
Single cluster deployment 🔗︎
In this scenario, we’ll be using Thanos for its long term storage capabilities. This means we’ll install a Prometheus operator with a Thanos sidecar and a full Thanos stack. Let’s see an example of a minimalist setup.
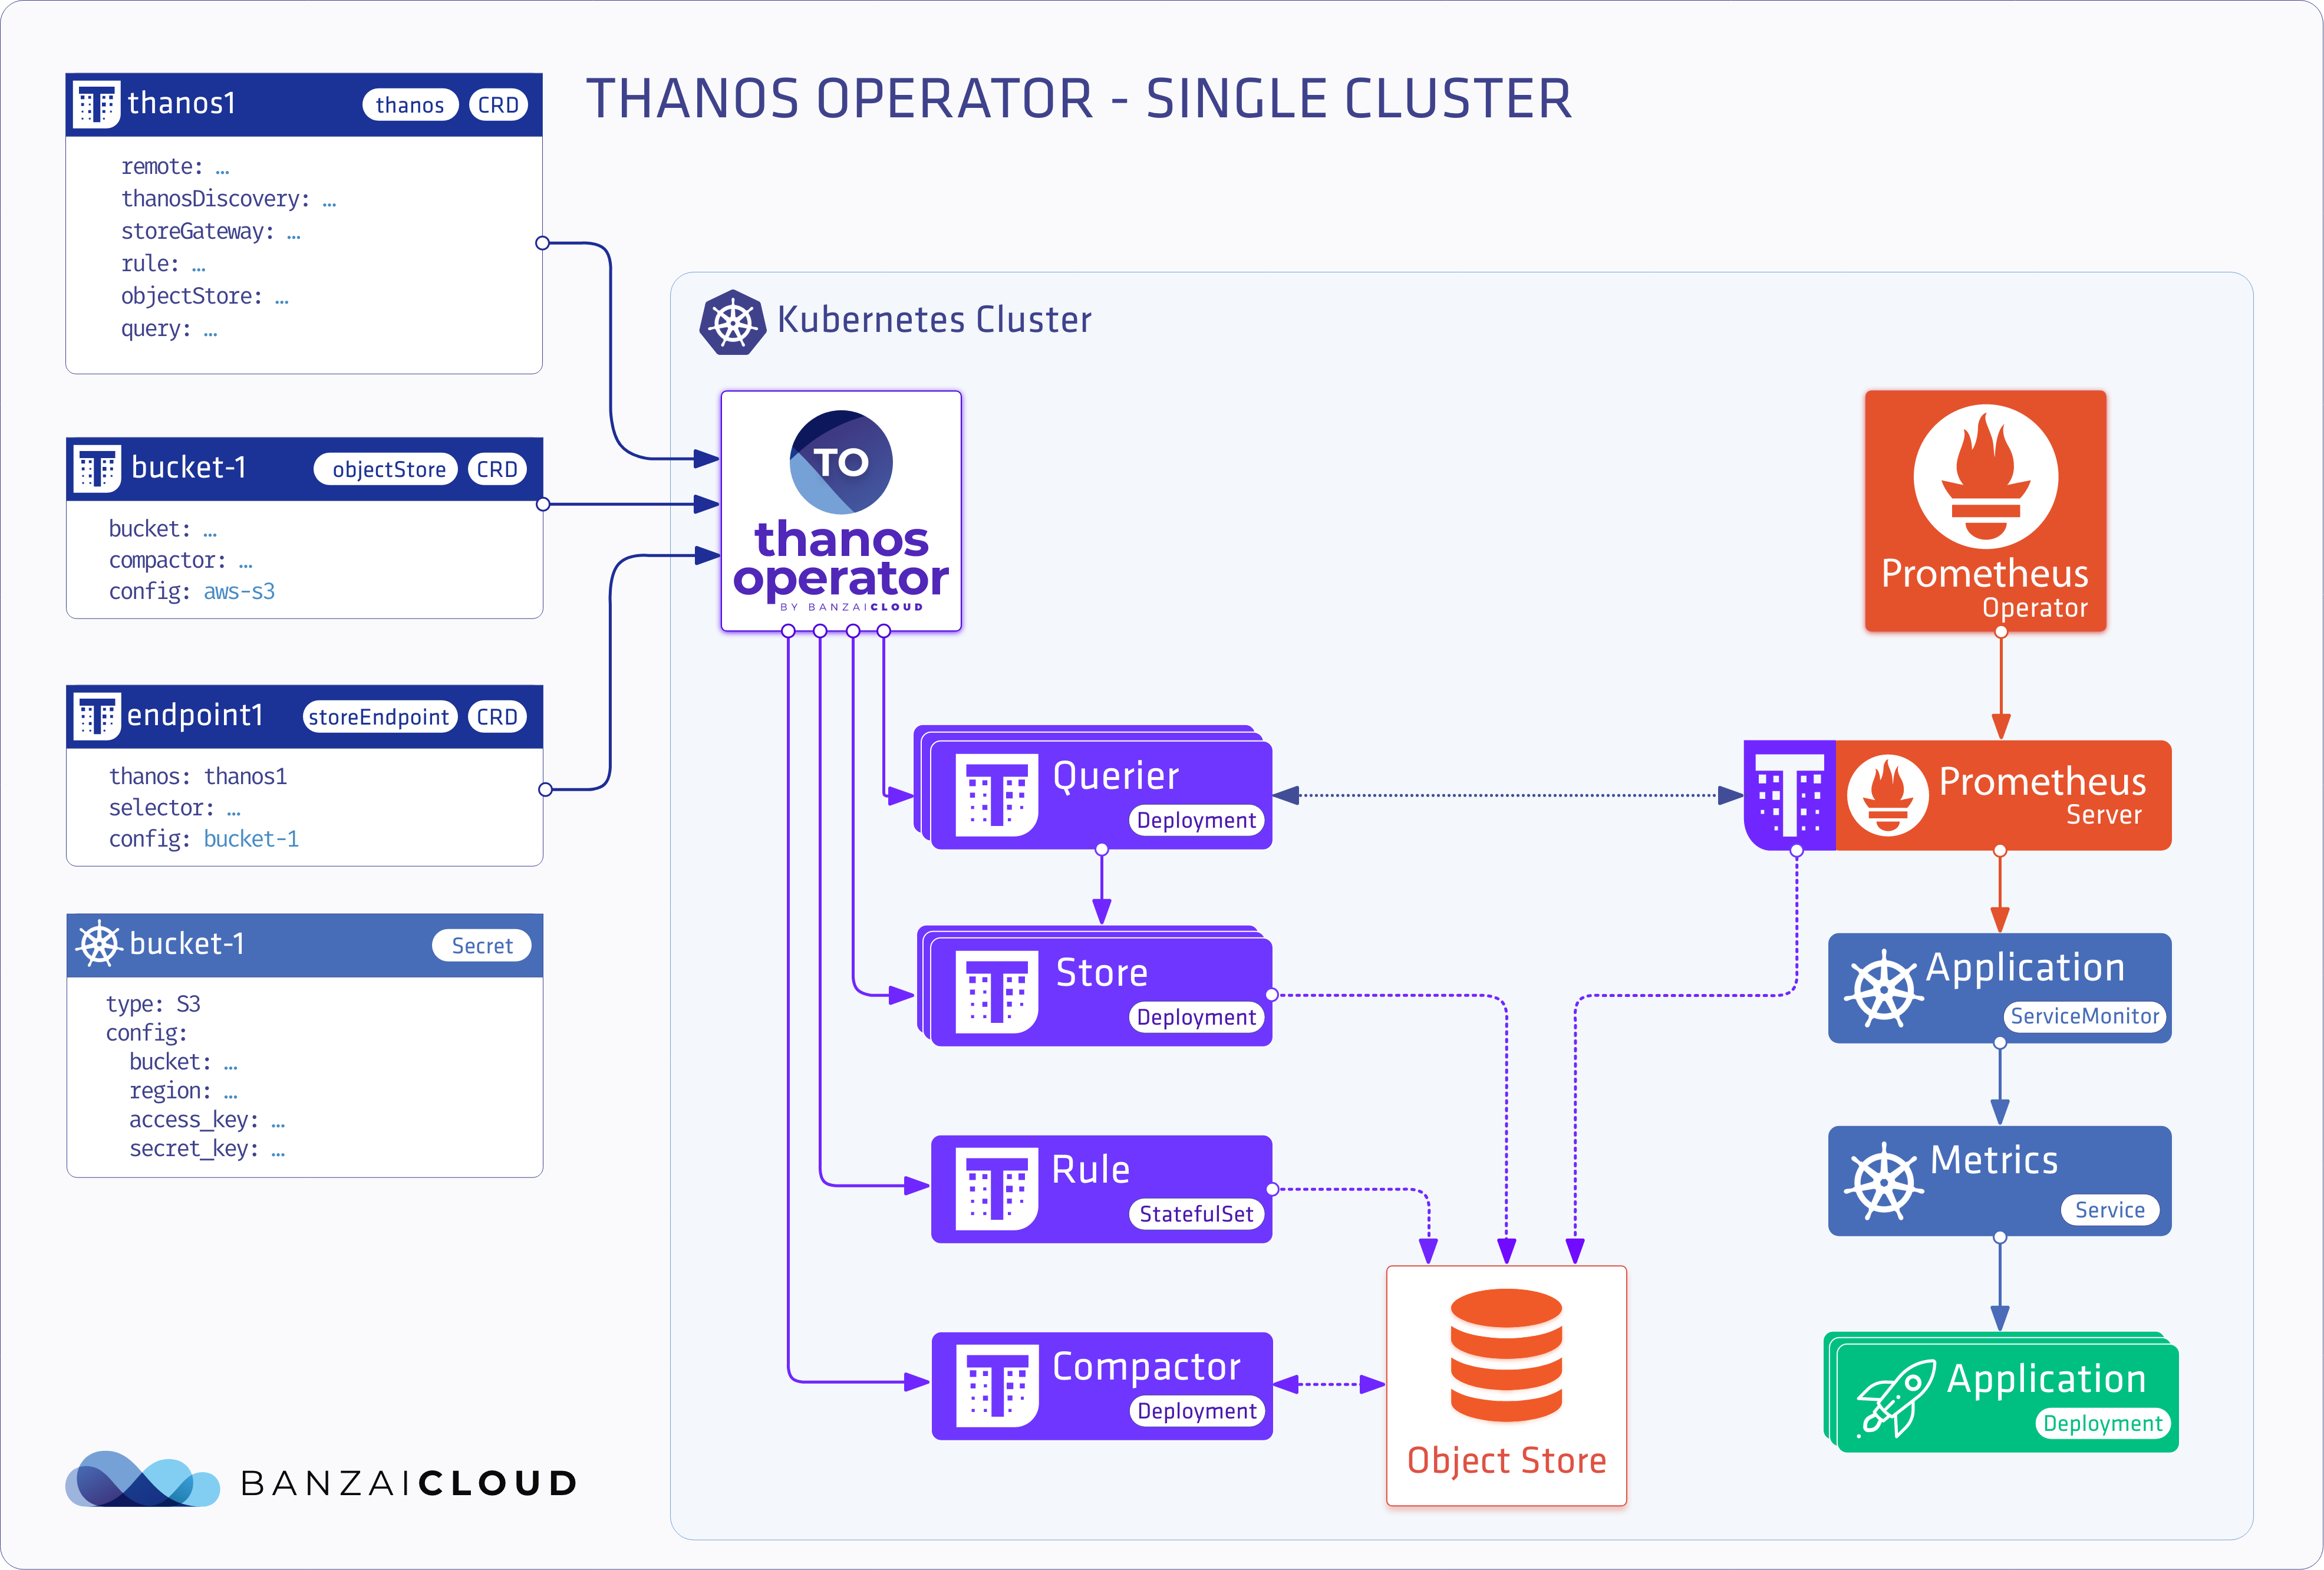
objectstore
apiVersion: monitoring.banzaicloud.io/v1alpha1
kind: ObjectStore
metadata:
  name: objectstore-sample
spec:
  config:
    mountFrom:
      secretKeyRef:
        name: thanos
        key: object-store.yaml
  bucketWeb:
    label: cluster
  compactor: {}
storeendpoint
apiVersion: monitoring.banzaicloud.io/v1alpha1
kind: StoreEndpoint
metadata:
  name: storeendpoint-sample
spec:
  # Add fields here
  thanos: thanos-sample
  config:
    mountFrom:
      secretKeyRef:
        name: thanos
        key: object-store.yaml
  selector: {}
thanos
apiVersion: monitoring.banzaicloud.io/v1alpha1
kind: Thanos
metadata:
  name: thanos-sample
spec:
  query: {}
  rule: {}
  storeGateway: {}
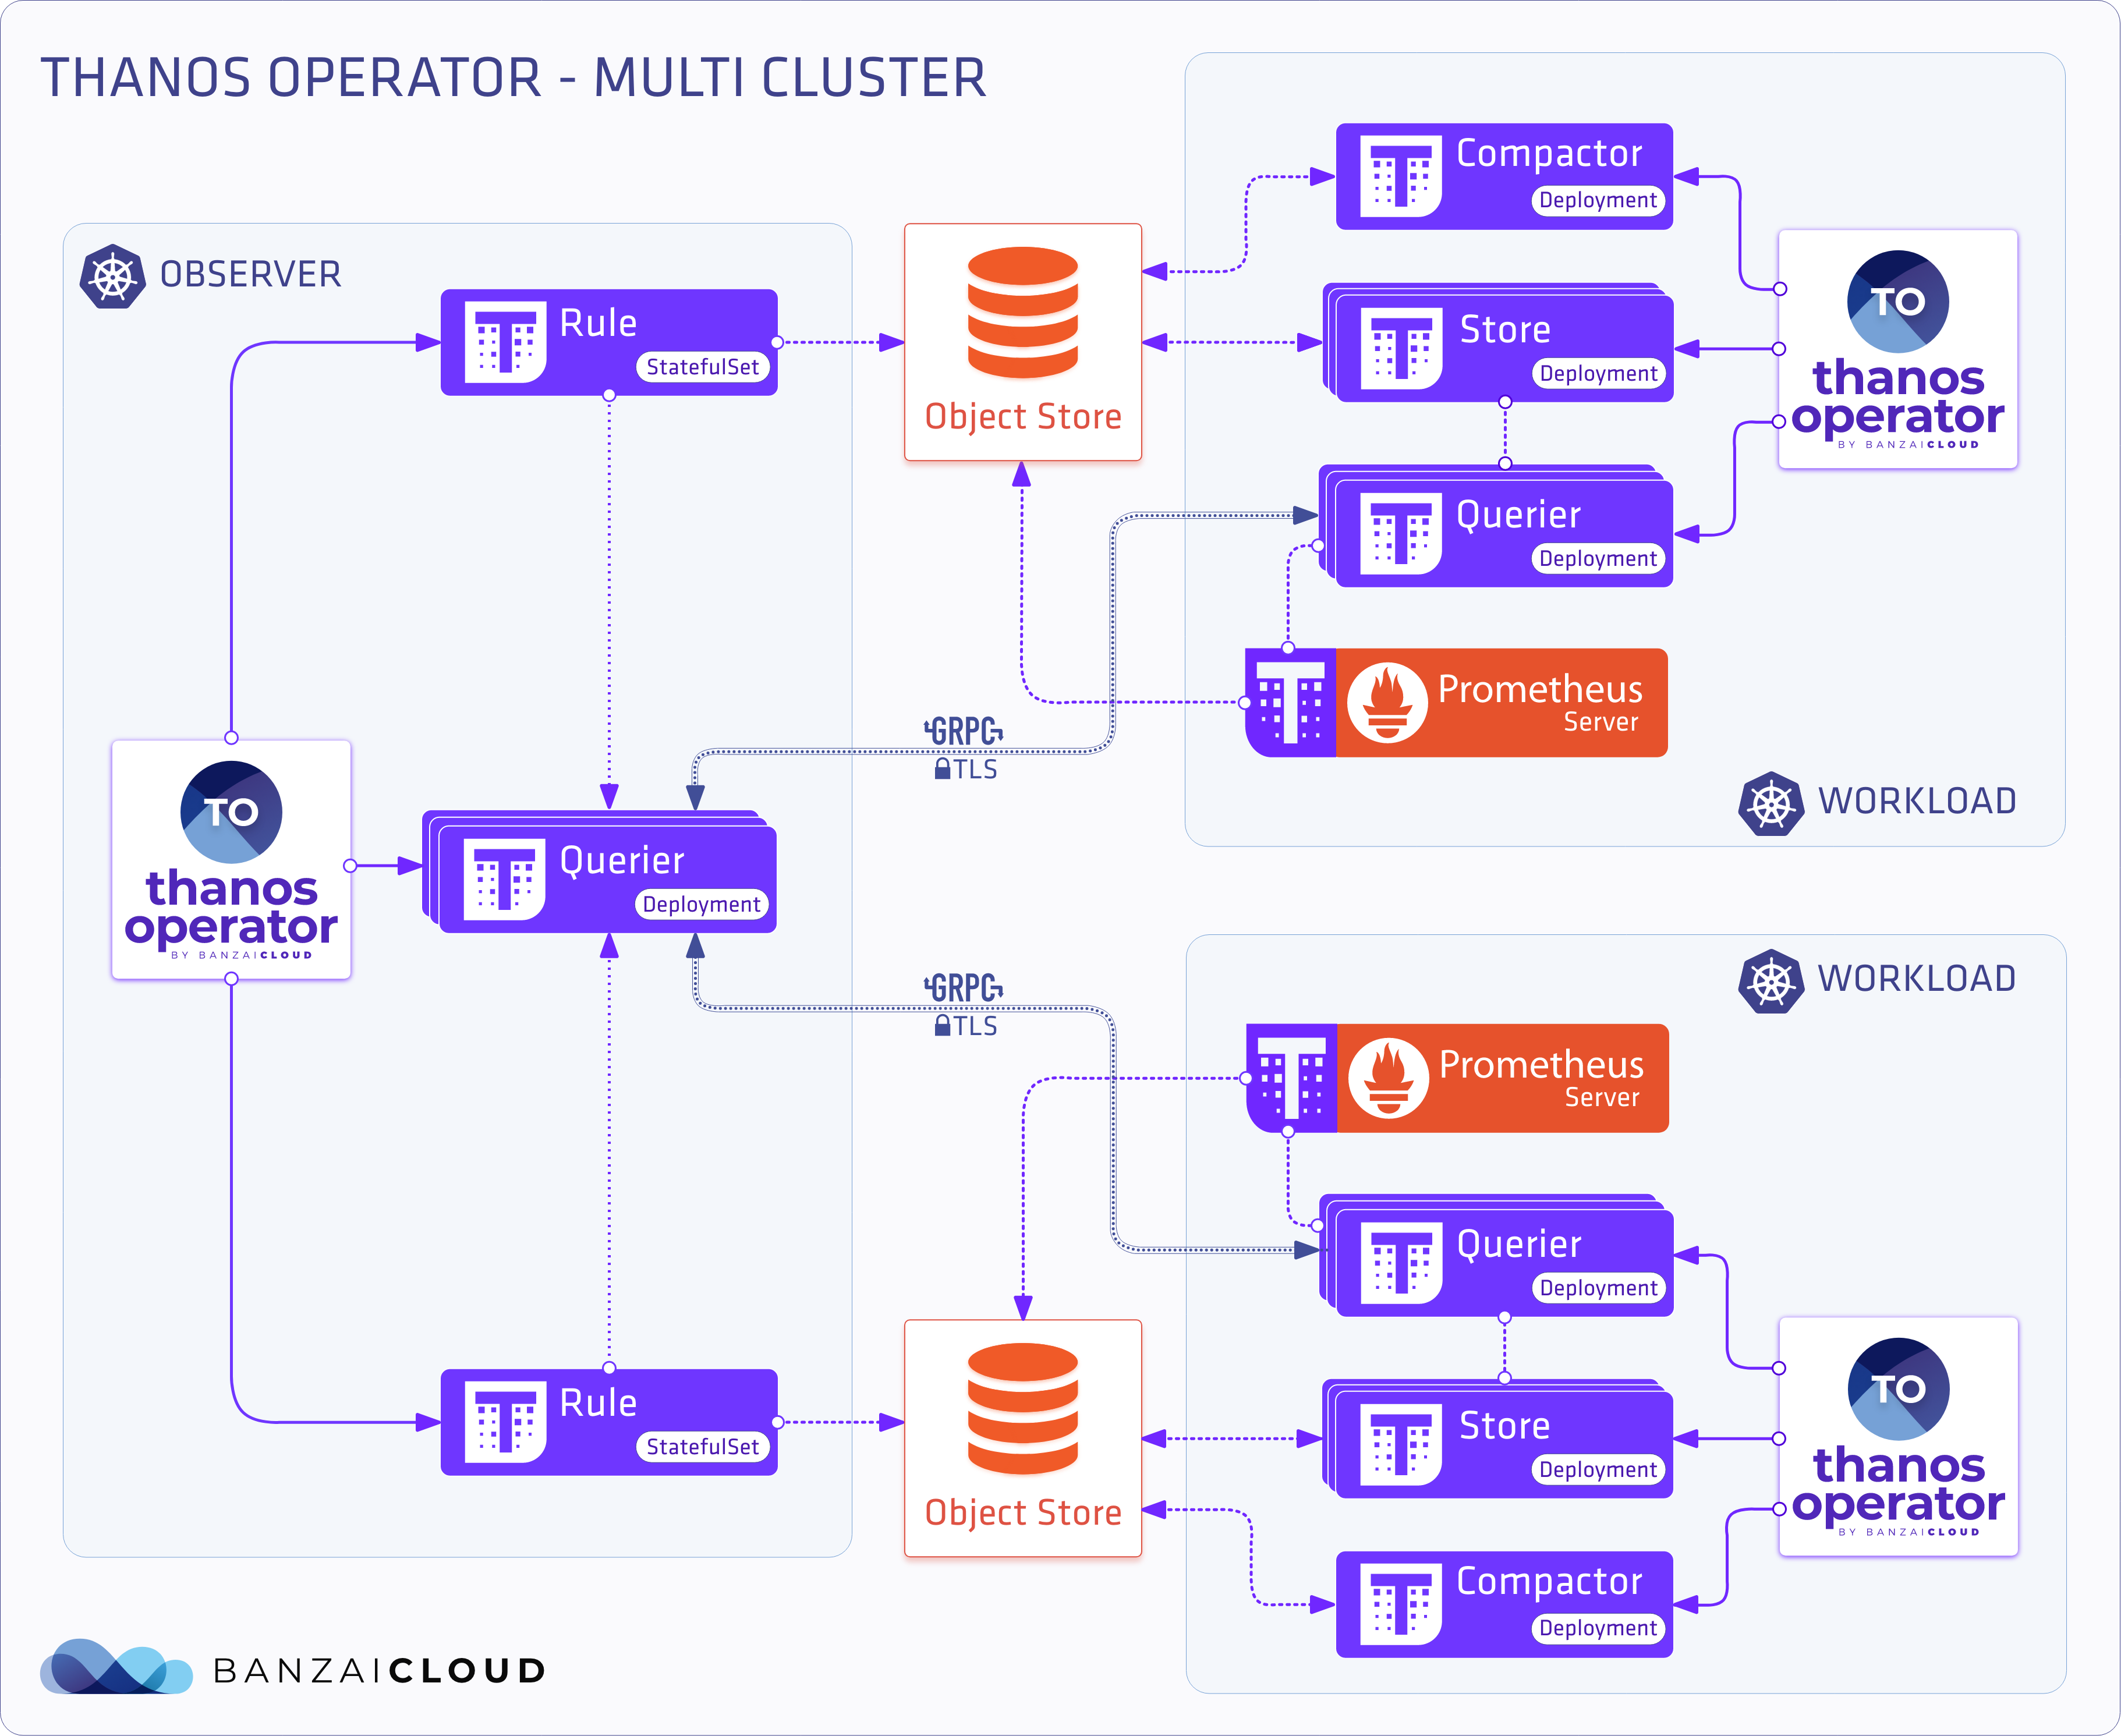
Multi cluster deployment 🔗︎
So now we have a single cluster deployment, but what if we have several clusters and need a single means of viewing them? There are several different approaches we can take. For now, we’ll explore the most basic. We have multiple clusters with Thanos already installed. We need to configure a Thanos customresource with endpoints that point to these clusters.
Thanos with only query definition
apiVersion: monitoring.banzaicloud.io/v1alpha1
kind: Thanos
metadata:
  name: thanos-multi
spec:
  query: {}
store-endpoints per cluster
apiVersion: monitoring.banzaicloud.io/v1alpha1
kind: StoreEndpoint
metadata:
  name: remote-cluster-n
spec:
  thanos: thanos-multi
  url: http://remote-cluster-n.com
Observer cluster deployment 🔗︎
This deployment model subtracts the additional workload from the cluster, and moves Thanos components to a dedicated observer cluster.
thanos with queryDiscovery definition
apiVersion: monitoring.banzaicloud.io/v1alpha1
kind: Thanos
metadata:
  name: query-master
spec:
  query: {}
  queryDiscovery: true
thanos definition for the remote clusters
apiVersion: monitoring.banzaicloud.io/v1alpha1
kind: Thanos
metadata:
  name: thanos-generic-n
spec:
  query: {}
  rule: {}
  storeGateway: {}
apiVersion: monitoring.banzaicloud.io/v1alpha1
kind: StoreEndpoint
metadata:
  name: remote-cluster-n
spec:
  thanos: thanos-generic-n
  url: http://remote-cluster-n.com
  config:
    mountFrom:
      secretKeyRef:
        name: thanos
        key: object-store-n.yaml
Note: this deployment model is applicable to single cluster multi-namespace deployments as well
Conclusions 🔗︎
Thanos is a powerful tool that allows you to build highly available, multi-cluster monitoring systems. However, there are several difficulties that naturally arise when creating a production-ready version of such a system:
- Configuring Thanos service discovery for multiple clusters
- Sharding Prometheus instances
- Configuration of transport layer TLS and certificates
- Proper scaling of resources (how many metrics, and what kind of resources are needed, etc)
- Setting up Label/Time range shards
- Keeping your configuration up to date and propagating cluster changes
- Adding a caching layer
As a rule of thumb, we automate the setup of all the observability tools that our customers need to use our Pipeline hybrid-cloud container management platform. That goes for Thanos, Prometheus and the Fluent ecosystem as well. All these features land in the Thanos operator, and, with One Eye, we’ll soon be making the setup and management of these tools extensible and incredibly easy.
For those familiar with the Banzai Cloud Logging operator, One Eye brings with it the following extensions: Host Logs, K8s Event logs, Cloud Watch and Webhook Logs.
While this project is still very much under way (we’ll be releasing it late Q1), feel free to set up your Thanos infrastructure using the popular Thanos Helm chart, the Thanos operator or the One Eye CLI.
If you are interested in a One Eye demo, contact us here. For the One Eye documentation click here.