


At Banzai Cloud we are building an application-centric platform for containers - Pipeline - running on Kubernetes to allow developers to go from commit to scale in minutes. We support multiple development languages and frameworks to build applications, with one common goal: all Pipeline deployments receive integrated centralized logging, monitoring, enterprise-grade security, autoscaling, and spot price support automatically, out of the box. In most cases we accomplish this in a non-intrusive way (i.e. no code changes are required) or we generate and pre-package boilerplate code to enable the above must-have features when going to production.
One of the most popular development languages we support is Node.js. We recently published a Node service tools npm library that provides the essential features including graceful error handling & shutdown, structured JSON logging, access to various HTTP middleware, health checks, metrics and more to make your Node.js application truly ready for production on Kubernetes.
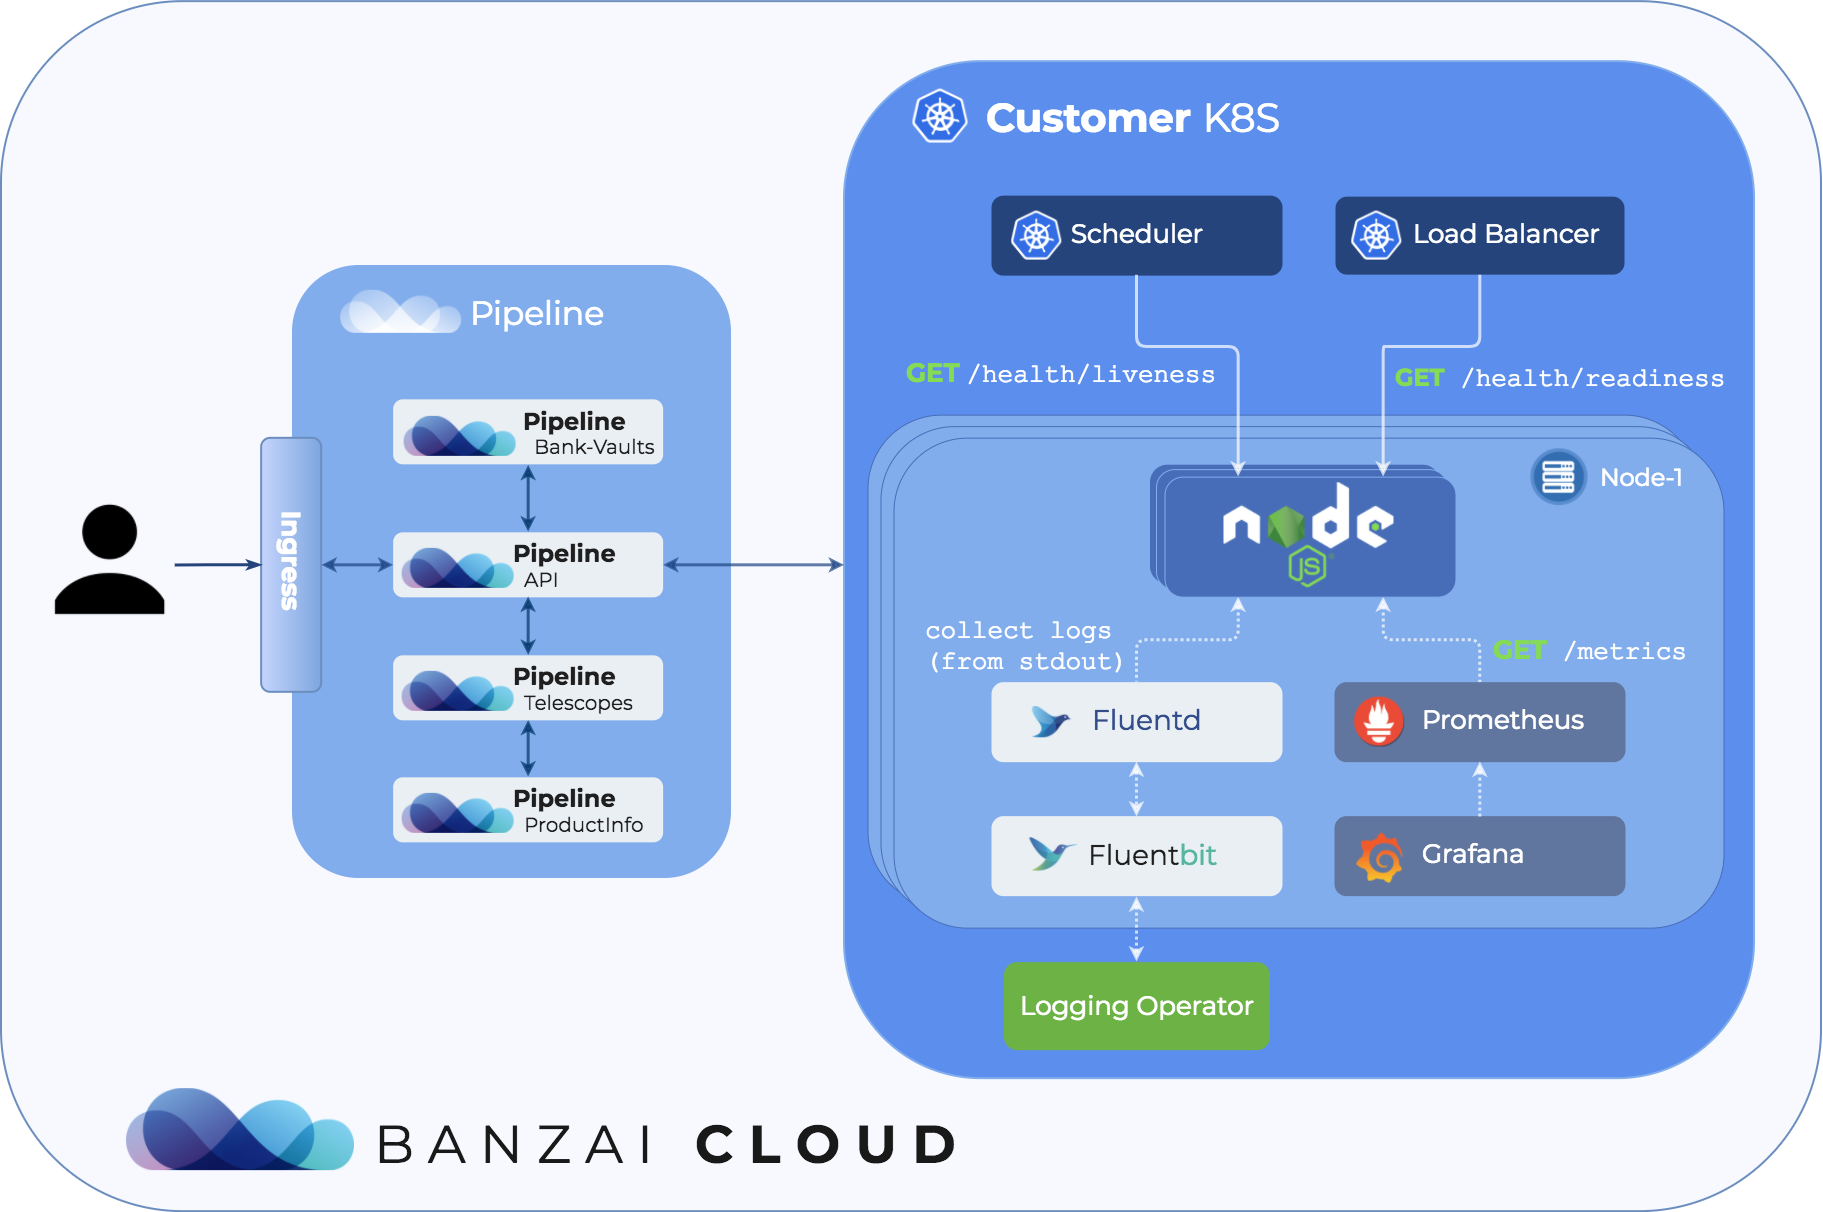
You can now deploy production ready Node.js apps to Kubernetes using /products/pipeline/
Graceful error handling 🔗︎
In Node.js you can register error handlers for uncaught exceptions and unhandled Promise rejections. We are all human; errors slip into our code, and we face unlikely scenarios we are not prepared for. What happens when an unexpected error is thrown and we fail to catch it? Our program exits right away, possibly leaking resources, losing session data and leaving in-flight requests unhandled. Naturally, we want to minimize the risk of such events taking place.
One way of doing that is to utilize our library:
const { catchErrors } = require("@banzaicloud/service-tools");

// this should be called very early in our application to register the error handlers
catchErrors([
  // calls the cleanup handlers one after the other on error
  stopServer,
  closeDatabase,
  closeMessageQueue
  // ...
]);
Once an unexpected error happens in our running application, we can check the logs and implement error handling (missing try-catch or Promise chain .catch) for that particular code block.
Graceful shutdown 🔗︎
When rolling out a new deployment, the old instances of your application get stopped. The running process will receive a SIGTERM termination signal from the process manager. This is the way in which the application is notified of a termination intent and to start its clean up before exiting.
Lets examine one possible scenario resulting in a graceful web server shutdown:
- App gets signal to stop (
SIGTERM) - App lets the load balancer know that it’s not ready to handle new requests (returning
503on the health check endpoint) - App ceases to listen on the service port
- App serves all the ongoing requests
- App releases all of the resources correctly: databases, queues, opened files etc.
- App exits with “success” status code (
process.exit())
const { gracefulShutdown } = require("@banzaicloud/service-tools");

// ...

// register event listener for the `SIGTERM` signal
gracefulShutdown([
  // calls the cleanup handlers one after the other on error
  stopServer,
  closeDatabase,
  closeMessageQueue
  // ...
]);
It is also important to mention that if the application is started via npm start the process will not receive kill signals; you should always start your application with node.
Alternative solutions:
- https://github.com/godaddy/terminus
- https://github.com/tapppi/async-exit-hook
Structured JSON logger 🔗︎
Application logs come in very handy for developers when something goes wrong or when monitoring the status of an application. With structured logging the format of a log is well defined and easier to parse (the ability to filter and to search for certain lines).
The library uses a configured pino instance as a logger. It also has a utility function to intercept all console.log calls and turn them into JSON logs.
const { logger } = require("@banzaicloud/service-tools");

logger.info("log message");
// > {"level":30,"time":<ts>,"msg":"log message","pid":0,"hostname":"local","v":1}

console.log("log message");
// > log message

logger.interceptConsole();

console.log("log message");
// > {"level":30,"time":<ts>,"msg":"log message","pid":0,"hostname":"local","v":1}
One of the most important features of any logger is its ability to differentiate between logs based on importance. The levels of importance are as follows:
fatal: The system is unusable, a person must take action immediately. The system is in distress, customers are probably being affected (or will soon be). Examples:- failed to start server on the given port
- failed to start server due to missing environment variables or bad configuration
- runtime errors or unexpected conditions
- the server can’t handle load
- database is unreachable
error: Error events are likely to cause problems, an unexpected technical or business event has occurred. Examples:- 5xx internal server error and its cause
- most errors in
try/catchblocks
warn: Warning events might cause problems. Examples:- use of deprecated APIs
- poor use of API
info: Routine information, such as ongoing status or performance. For important information, things we want to see at high volume in case we need to analyse an issue. Examples:- system life cycle events (server is listening on a port, received kill signal, etc.)
- session life cycle events (login, logout)
- significant boundary events (database calls, remote API calls, etc.)
debug: For not very important, but potentially helpful events in tracking the flow through the system and isolating issues. It should only be turned on when developing locally or for a short period of time. Examples:- HTTP requests, responses
- messages received on a queue
trace: Similar todebug, except these are usually high volume, frequent events. It should only be turned on when developing locally or for a very short period of time. Examples:- state of data being processed
- entry/exit of non-trivial methods and decision points
It also enables us to configure the severity of our log out in different environments. The minimum logging level can be set through environment variable: LOGGER_LEVEL.
The logger also redacts some fields, based on key names, in order not to expose secrets in logs. The default fields are password, pass, authorization, auth, cookie, but these can be reconfigured as well.
Alternative solutions:
- https://github.com/pinojs/pino
- https://github.com/winstonjs/winston
We have put great effort into the collecting and moving of logs of distributed applications deployed to Kubernetes towards a centralized location - and have automated the whole logging experience.
Health check 🔗︎
Health checks are used by the load balancer or the application manager to determine the health of a running application. When healthy, the application is ready to accept requests or handle other kinds of loads. If your application fails, the system will detect it automatically and try to fix it (for example by restarting the misbehaving instances).
In Kubernetes there are two kinds of health checks:
-
liveness:
Many applications running for long periods of time eventually transition to broken states, and cannot recover except by being restarted. Kubernetes provides liveness probes to detect and remedy such situations.
-
readiness:
Sometimes, applications are temporarily unable to serve traffic. For example, an application might need to load a large amount of data or a large number of configuration files during startup. In such instances, we don’t want to kill the application, but we don’t want to send it requests either.
If your application is not prepared to expose this kind of information, the system doesn’t have any way of indicating whether it is working correctly or not, so it is extremely important to define.
The library currently has support for Koa and Express web frameworks. The checks are executed sequentially, one after another, so the endpoint will return 200 when all of them have passed, and 500 when any fail.
const express = require("express");
const {
  express: middleware
} = require("@banzaicloud/service-tools").middleware;

// ...

const app = express();

// each check returns a Promise
app.get("/health/liveness", middleware.healthCheck([checkDB]));
app.get(
  "/health/readiness",
  middleware.healthCheck([initFinished, checkDB, canAcceptMoreRequests])
);
In Kubernetes you can define the checks in the POD specification:
# ...
ports:
  - name: http
    containerPort: 8080

livenessProbe:
  httpGet:
    path: /health/liveness
    port: http

readinessProbe:
  httpGet:
    path: /health/readiness
    port: http
To learn more about health checks in Kubernetes, check out the following video by Google:
Alternative solutions:
- https://github.com/CloudNativeJS/cloud-health
- https://github.com/godaddy/terminus
Application metrics 🔗︎
Metrics are a very important source of insight into the state, load and stability of your running application. They give us the ability to observe the state of our application, so we can act on issues as they arise. Pipeline uses Prometheus to collect metrics and as usual we have automated the whole monitoring experience for all Pipeline deployments.
The library builds on top of prom-client, so you can easily extend the exported metrics, and fine tune them as you see fit.
const express = require("express");
const {
  express: middleware
} = require("@banzaicloud/service-tools").middleware;

app.get("/metrics", middleware.prometheusMetrics());
The application is only responsible for exposing metrics. Consuming them is done by Prometheus itself, by calling the metrics endpoint periodically.
Alternatives:
- https://github.com/CloudNativeJS/appmetrics-prometheus
- https://github.com/siimon/prom-client
Learn through code 🔗︎
As always, the easiest way to learn is to read the code. We have collected some examples to kick-start your Node.js experience on Kubernetes!


