


Note: The Spotguides feature mentioned in this post is outdated and not available anymore. In case you are interested in a similar feature, contact us for details.
In December 2018 we released the public beta of Pipeline and introduced a Banzai Cloud terminology - spotguides. We have already gone deep into what Spotguides were and how they supercharged Kubernetes deployments of application frameworks (automated deployments, preconfigured GitHub repositories, CI/CD, job specific automated cluster sizing, Vault based secret management, etc.). This post is focused on one specific spotguide: Spark with HistoryServer.
Note: The Pipeline CI/CD module mentioned in this post is outdated and not available anymore. You can integrate Pipeline to your CI/CD solution using the Pipeline API. Contact us for details.
Since the very early days, one of the most popular deployments to Kubernetes has been Apache Spark. We’ve been working on this for a while and extensively blogged about our journey of running production Spark workloads on Kubernetes - https://banzaicloud.com/tags/spark/. This article describes the Spark Spotguide, which incorporates all our best developer/ops practices for running Spark so that Banzai Cloud Pipeline users can deploy and scale their workloads in no time.
In the first part of the post, we are going to deep dive into Spark Spotguide internals. If you are here only to check out how easy it is to launch Spark on Kubernetes with the help of Spotguides, jump to the instructions on launching the Spark Spotguide section.
The state of Spark on Kubernetes 🔗︎
The Apache Spark community started developing Kubernetes support in the very early days of Kubernetes. The implementation lived on a fork and was based on Spark 2.2. It became official and went upstream with the Spark 2.3 release. However, there are a couple of features which were left out from the upstream version for various reasons:
- Application dependencies from submission client’s local file system
- Dynamic Executor Scaling
- PySpark
- R
In December 2018, Spark 2.4 was released with a couple of enhancements: PySpark and R, but some features are still under development or discussion, namely:
- Application dependencies from submission client’s local file system SPARK-23153
- Dynamic Executor Scaling
There are some additional features we contributed to Spark (not yet upstream) and consider mandatory for production deployments still missing - read on to learn about those.
The Spark community also added a well written how-to about Running Spark on Kubernetes which seems to have everything for running Spark on Kubernetes - well, not exactly.
The need for the Spark Spotguide 🔗︎
The above mentioned how-to provided by the community contains information about every configuration parameter which might be needed to fine tune your application, but it lacks the information about logging, monitoring, scaling and how to set up a Kubernetes cluster. Obviously to some extent this is not Spark’s concern - but for those not familiar with Kubernetes, this is a showstopper. These, and quite a few other features have been automated by the Banzai Cloud Spark Spotguide, which seamlessly makes Spark work on 6 cloud providers and on-prem clusters.
Most of the Spark on Kubernetes users are Spark application developers or data scientists who are already familiar with Spark but probably never used (and probably don’t care much about) Kubernetes. The Spark Spotguide not only eases the process for the developers and data scientists, but also for the operation team as well by bootstrapping Kubernetes cluster in a few minutes - without the help of an operator - at a push of a button or a GitHub commit.
The Banzai Cloud maintained Spark Spotguide covers the following features:
- Capable to launch or reuse an existing Kubernetes cluster
- Scales the cluster based on your workload
- Deploys all components required for Spark to run on Kubernetes
- Installs monitoring dashboards
- Collects logs to a central location
- Manages the necessary secrets using Vault
- Contains a pre-configured CI/CD flow
The Spark Spotguide deep dive 🔗︎
Banzai Cloud uses CNCF standard tools like (Helm, Prometheus, Grafana, FluentBit, Fluentd), etc. as building blocks of the Spotguide
As it was mentioned in the earlier post about Spotguides, Spotguides use Github repositories to store a template for an application environment (along with cluster resources), and a description of how to make a working copy of itself.
Launch or reuse Kubernetes cluster 🔗︎
To launch or reuse clusters, the Spotguide is using Pipeline as a cloud agnostic “operating system” for its foundation. The CI/CD solution parses the cluster information inside the Github repository (GitOps) and acts accordingly. The Spotguide embraces the GitOps concept of maintaining the desired state in the source code management system, thus every change made in the cluster section of the repository modifies the cluster accordingly.
It also detects and understands already running clusters and installs only the required components to meet the specified state.
Size and scale the cluster to your needs 🔗︎
Sizing and scaling a cluster - and attaching different SLAs to it - is a hard task. The spotguide is using the Telescopes service to recommend cluster layouts optimized for cost, user risk tolerance, and job size. Once the cluster is up and running, the Spark Spotguide scales the cluster Horizontally and Vertically to stretch the cluster automatically within the boundaries, based on workload requirements.
Deploy all required components 🔗︎
The current Spark on Kubernetes deployment has a number of dependencies on other K8s deployments. Banzai Cloud Pipeline configures these dependencies and deploys all required components needed to make Spark on Kubernetes easy to use. It also takes care of several infrastructure components as well:
-
For logging Banzai Cloud developed a logging operator which silently takes care of fetching and publishing logs to a persistent store, using Fluentd and Fluentbit.
-
For monitoring the Spotguide uses Prometheus. To be able to scrape Spark metrics we developed a Prometheus exporter and these metrics are shown on a Grafana dashboard.
-
Spark also requires some Kubernetes specific resources such as a
ServiceAccountif the cluster has RBAC enabled. Behind the scenes, Pipeline takes care of installing these resources when needed. -
The spotguide can also install and configure Spark History Server as an optional feature. The History Server web UI is automatically exposed through a URL that is registered in Amazon Route53 and protected with a username and password.
Install Monitoring Dashboards 🔗︎
Collecting metrics without good dashboards are not very useful, so the Spark Spotguide provides two dashboards to monitor the deployed Spark applications. We are aware that we can’t provide good enough defaults for all possible Spark workloads, thus dashboards are also stored in the Github repository, and can be easily customized for each specific workload.
Spark on Steroids 🔗︎
The Spark Spotguide uses a prebuilt image by Banzai Cloud, which provides enhancements to fix some of limitations in the upstream version of Spark. Apache Spark uses a pod as the driver, which works differently from Spark running on YARN or Mesos. The YARN Application Master restarts the driver three times if it fails. In Kubernetes, pods are not fail-safe resources, thus running the Driver as a pod may cause unfinished tasks if an error occurs. To fix this, Banzai Cloud has changed this behavior in Spark to run the Driver instances as Jobs. This feature is extremely important for Spark Streaming where streaming jobs can run indefinitely. You can read more about the added resiliency features following the posts below:
- Apache Spark application resilience on Kubernetes
- Apache Spark (Driver) resilience on Kubernetes - network partitioning
Launching the Spark Spotguide 🔗︎
Let’s start by launching a Spotguide on an Amazon EKS cluster with History Server and Monitoring turned on.
This section should work like a tutorial so don’t hesitate to try it out for yourself.
Please check our documentation to properly set up your credentials
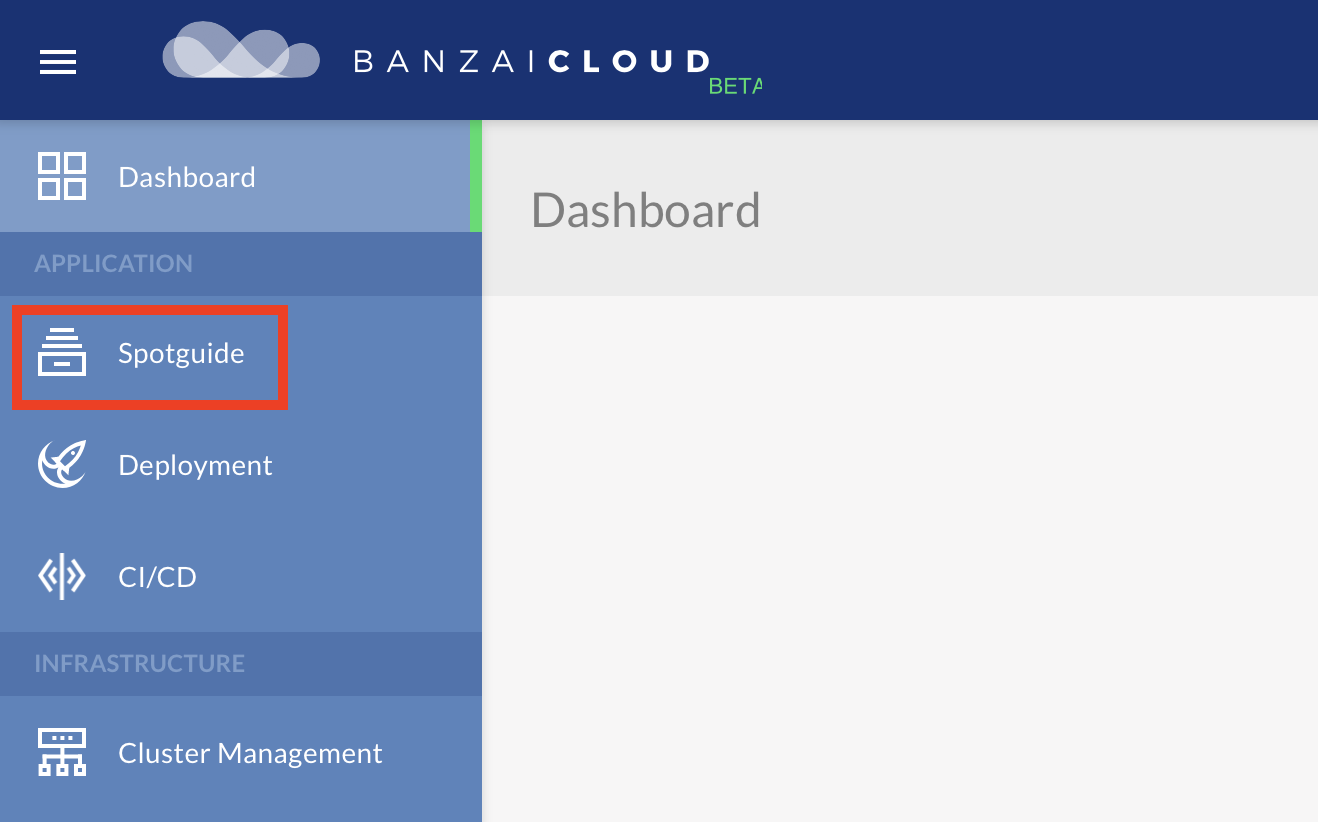
-
Log in, then click Spotguide.
-
Click Create Spotguide.
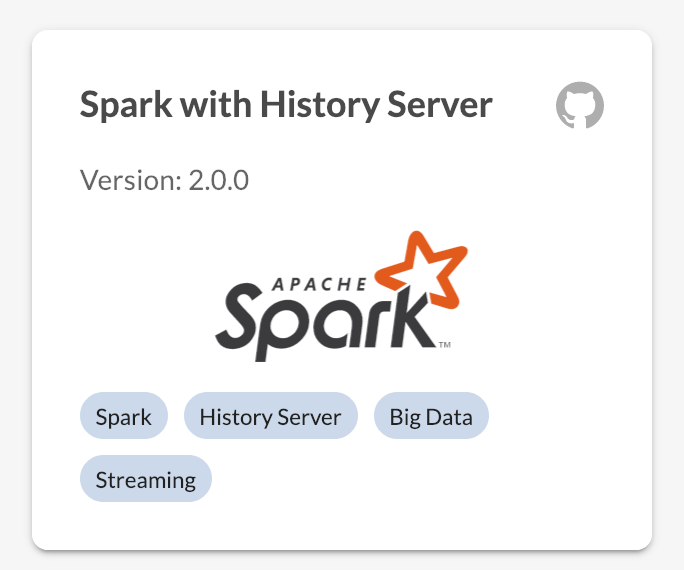
-
Select the Spark With HistoryServer Spotguide
-
Fill in all required fields in the form, then click Save. We are going to use Spark 2.4, and an eventlog bucket hosted on Amazon S3.
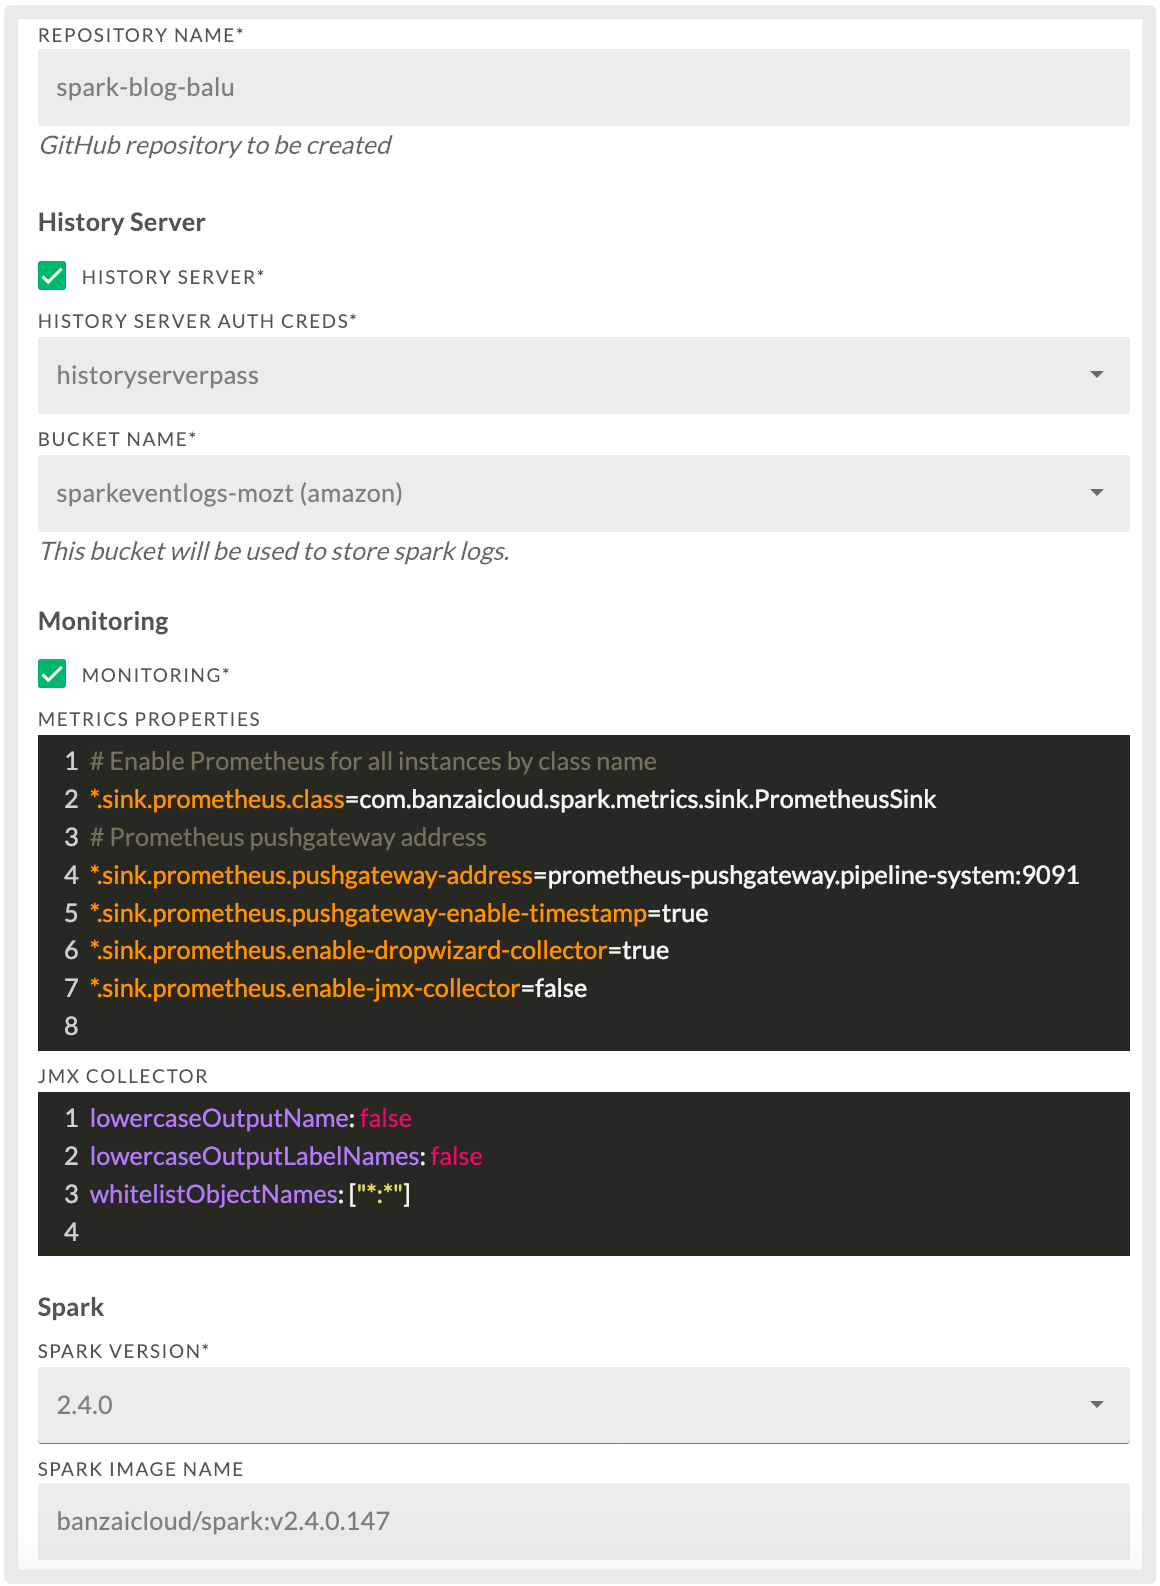
- Repository Name: Must be a unique repository name, which will be created on GitHub to store the Spotguide specific files.
- Enable Spark History Server.
- History Server Auth Creds: Generate new authentication credentials for History Server. These credentials are used to secure the exposed History Server UI.
- Bucket Name: Generate a new object store. History Server will use this to gather information about running Spark jobs.
- Enabling Spark monitoring.
- Metrics Properties: Spark’s metrics properties file, if you are not familiar with it please read the official documentation here. By default it uses Prometheus as a collector, which is not bundled with vanilla Spark. To fine tune Banzai Cloud’s Prometheus Sink please read the documentation here.
- JMX Collector: Java Jmx collector file, which is in use only when the Metrics Properties are set accordingly.
- Spark Version: The user can choose between two currently-supported Spark versions.
- Spark Image Name: Various Spark Docker images can be used here, by default it uses the Banzai Cloud prebuilt ones, remember it is for experts only, changing this setting may cause errors.
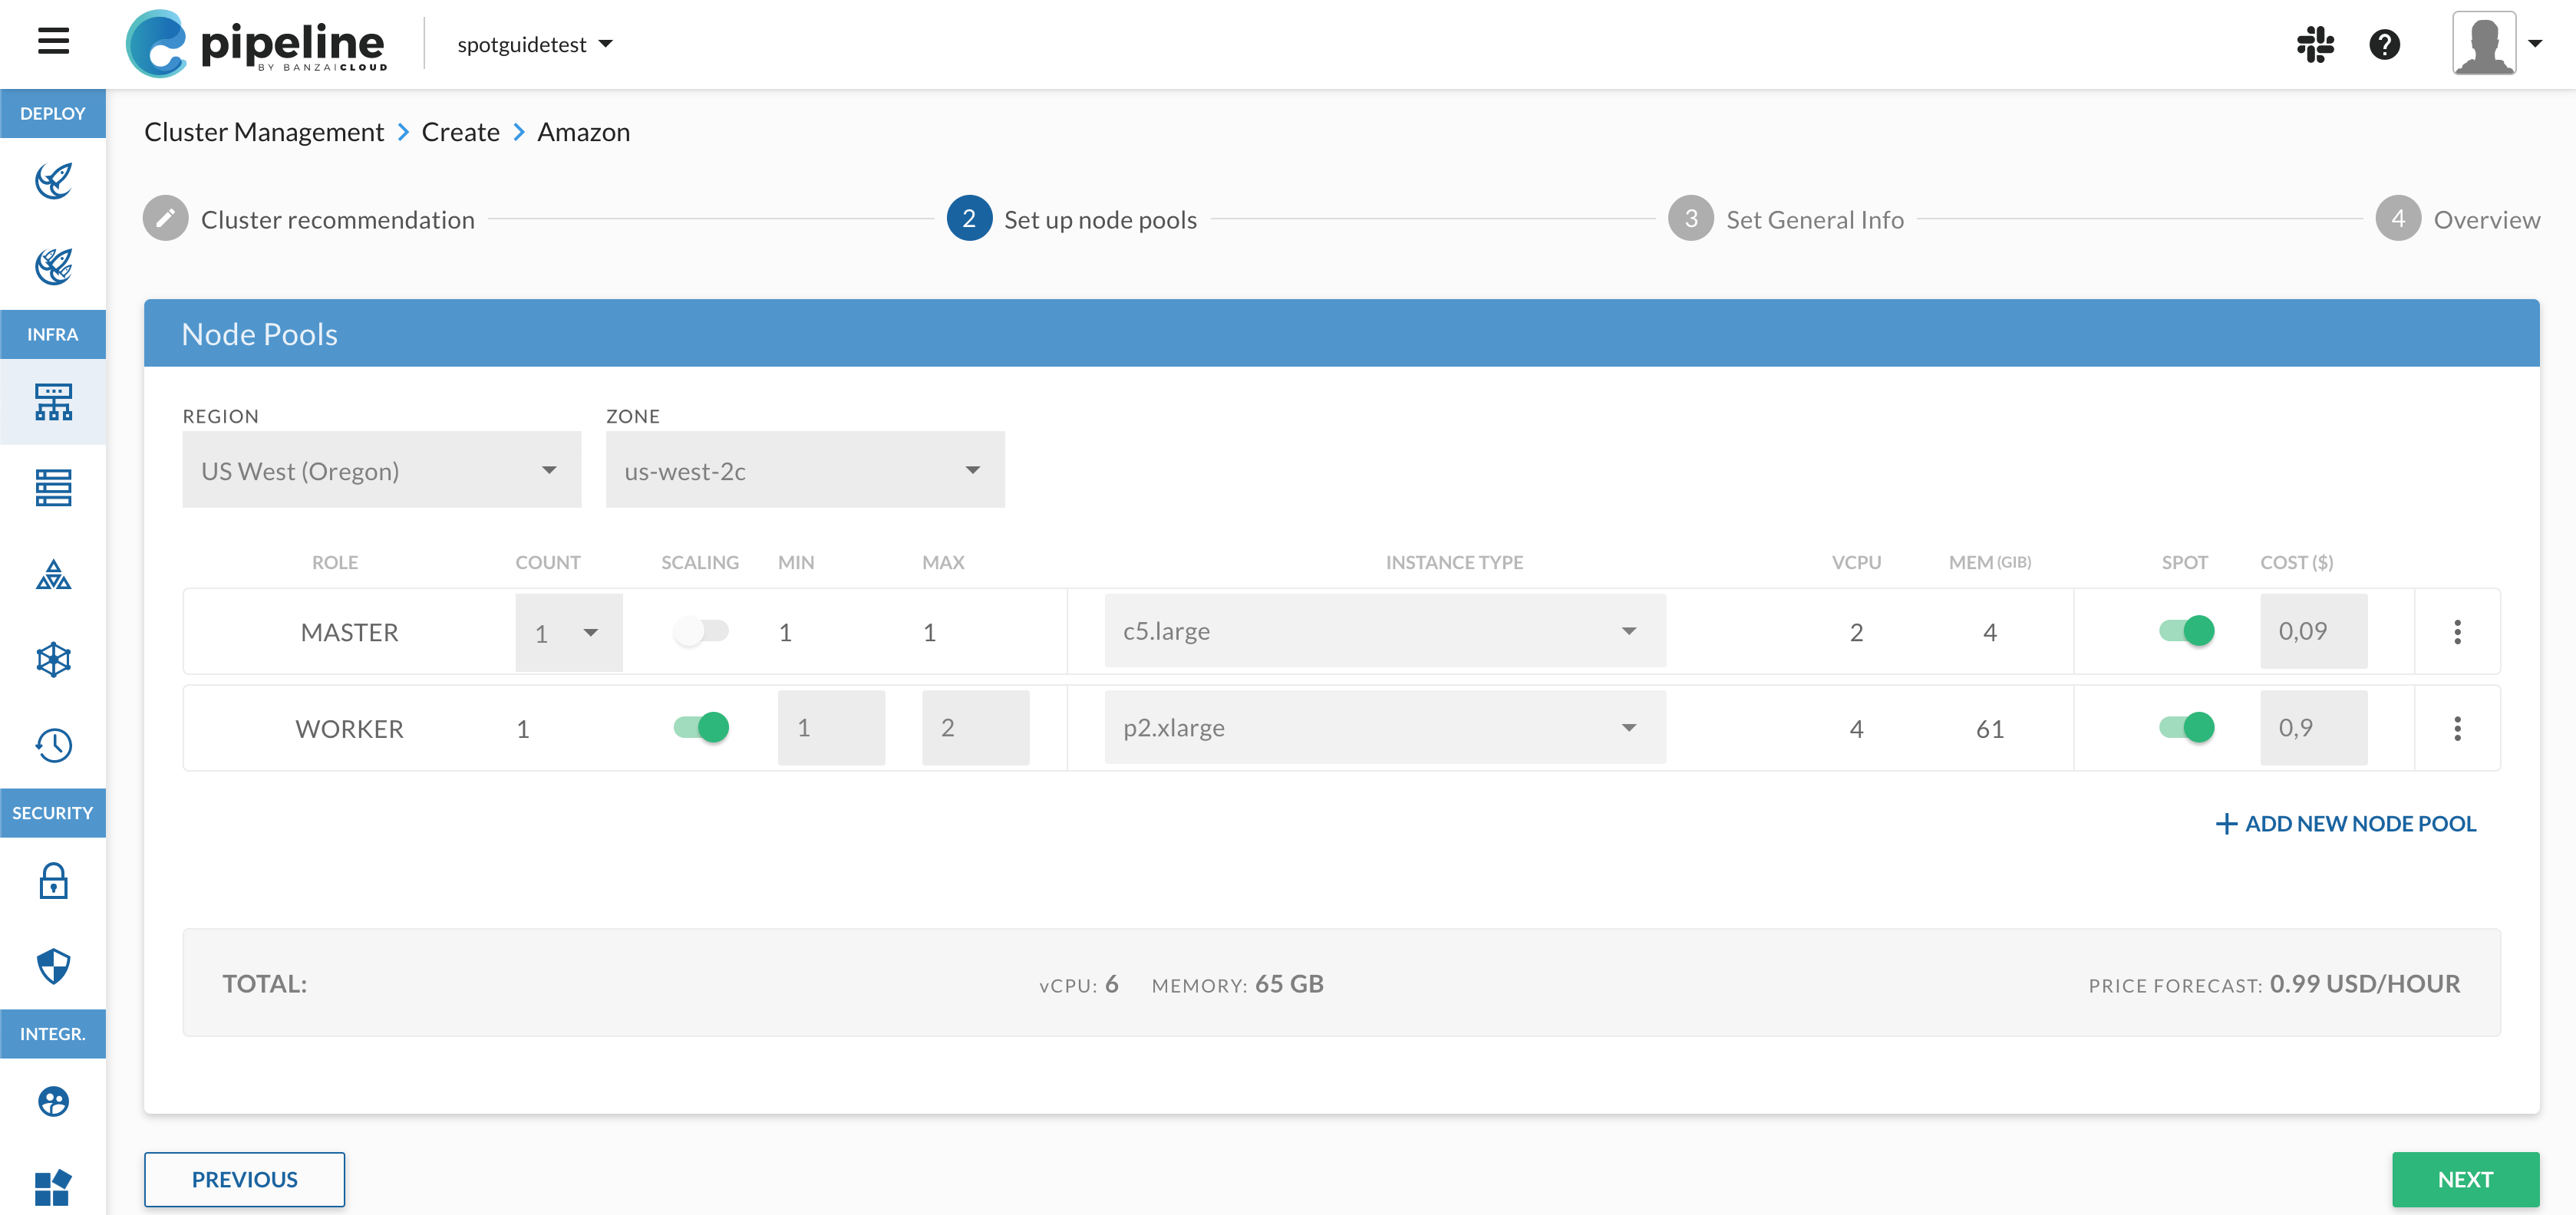
-
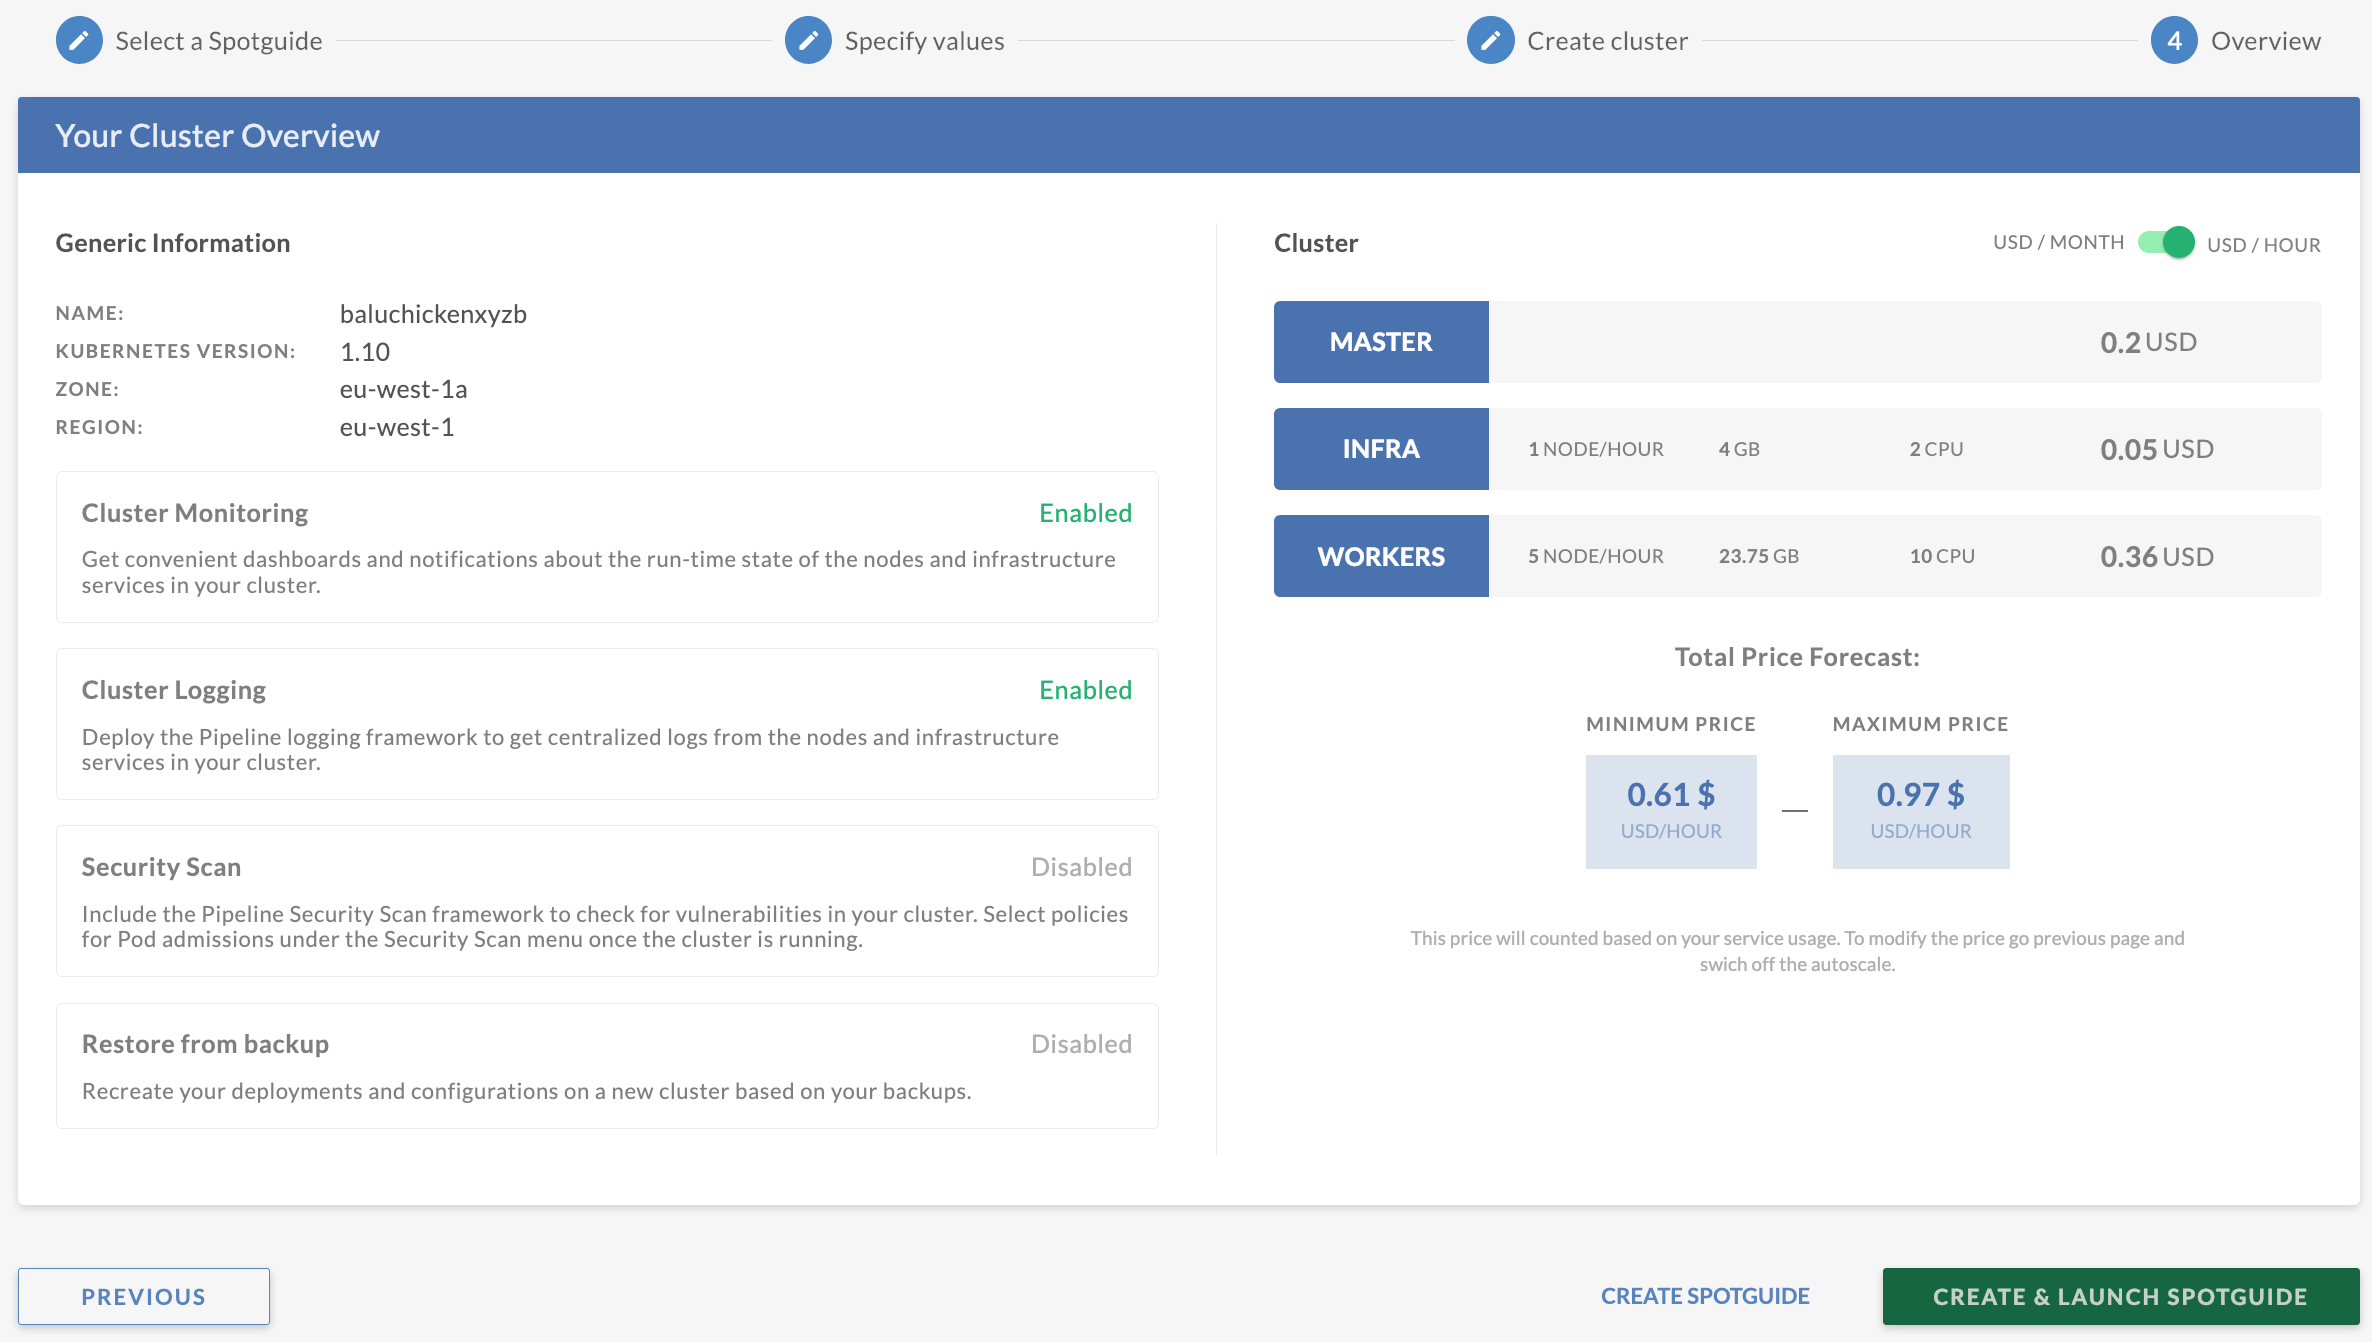
Follow the wizard to create a Kubernetes Cluster for your Spotguide. The Spotguide already contains all the necessary information so this step is a bit like a Windows Installer, where you keep on pushing Next, Next, Next. At the end of the wizard you will see a summary page, click Create and Launch Spotguide
-
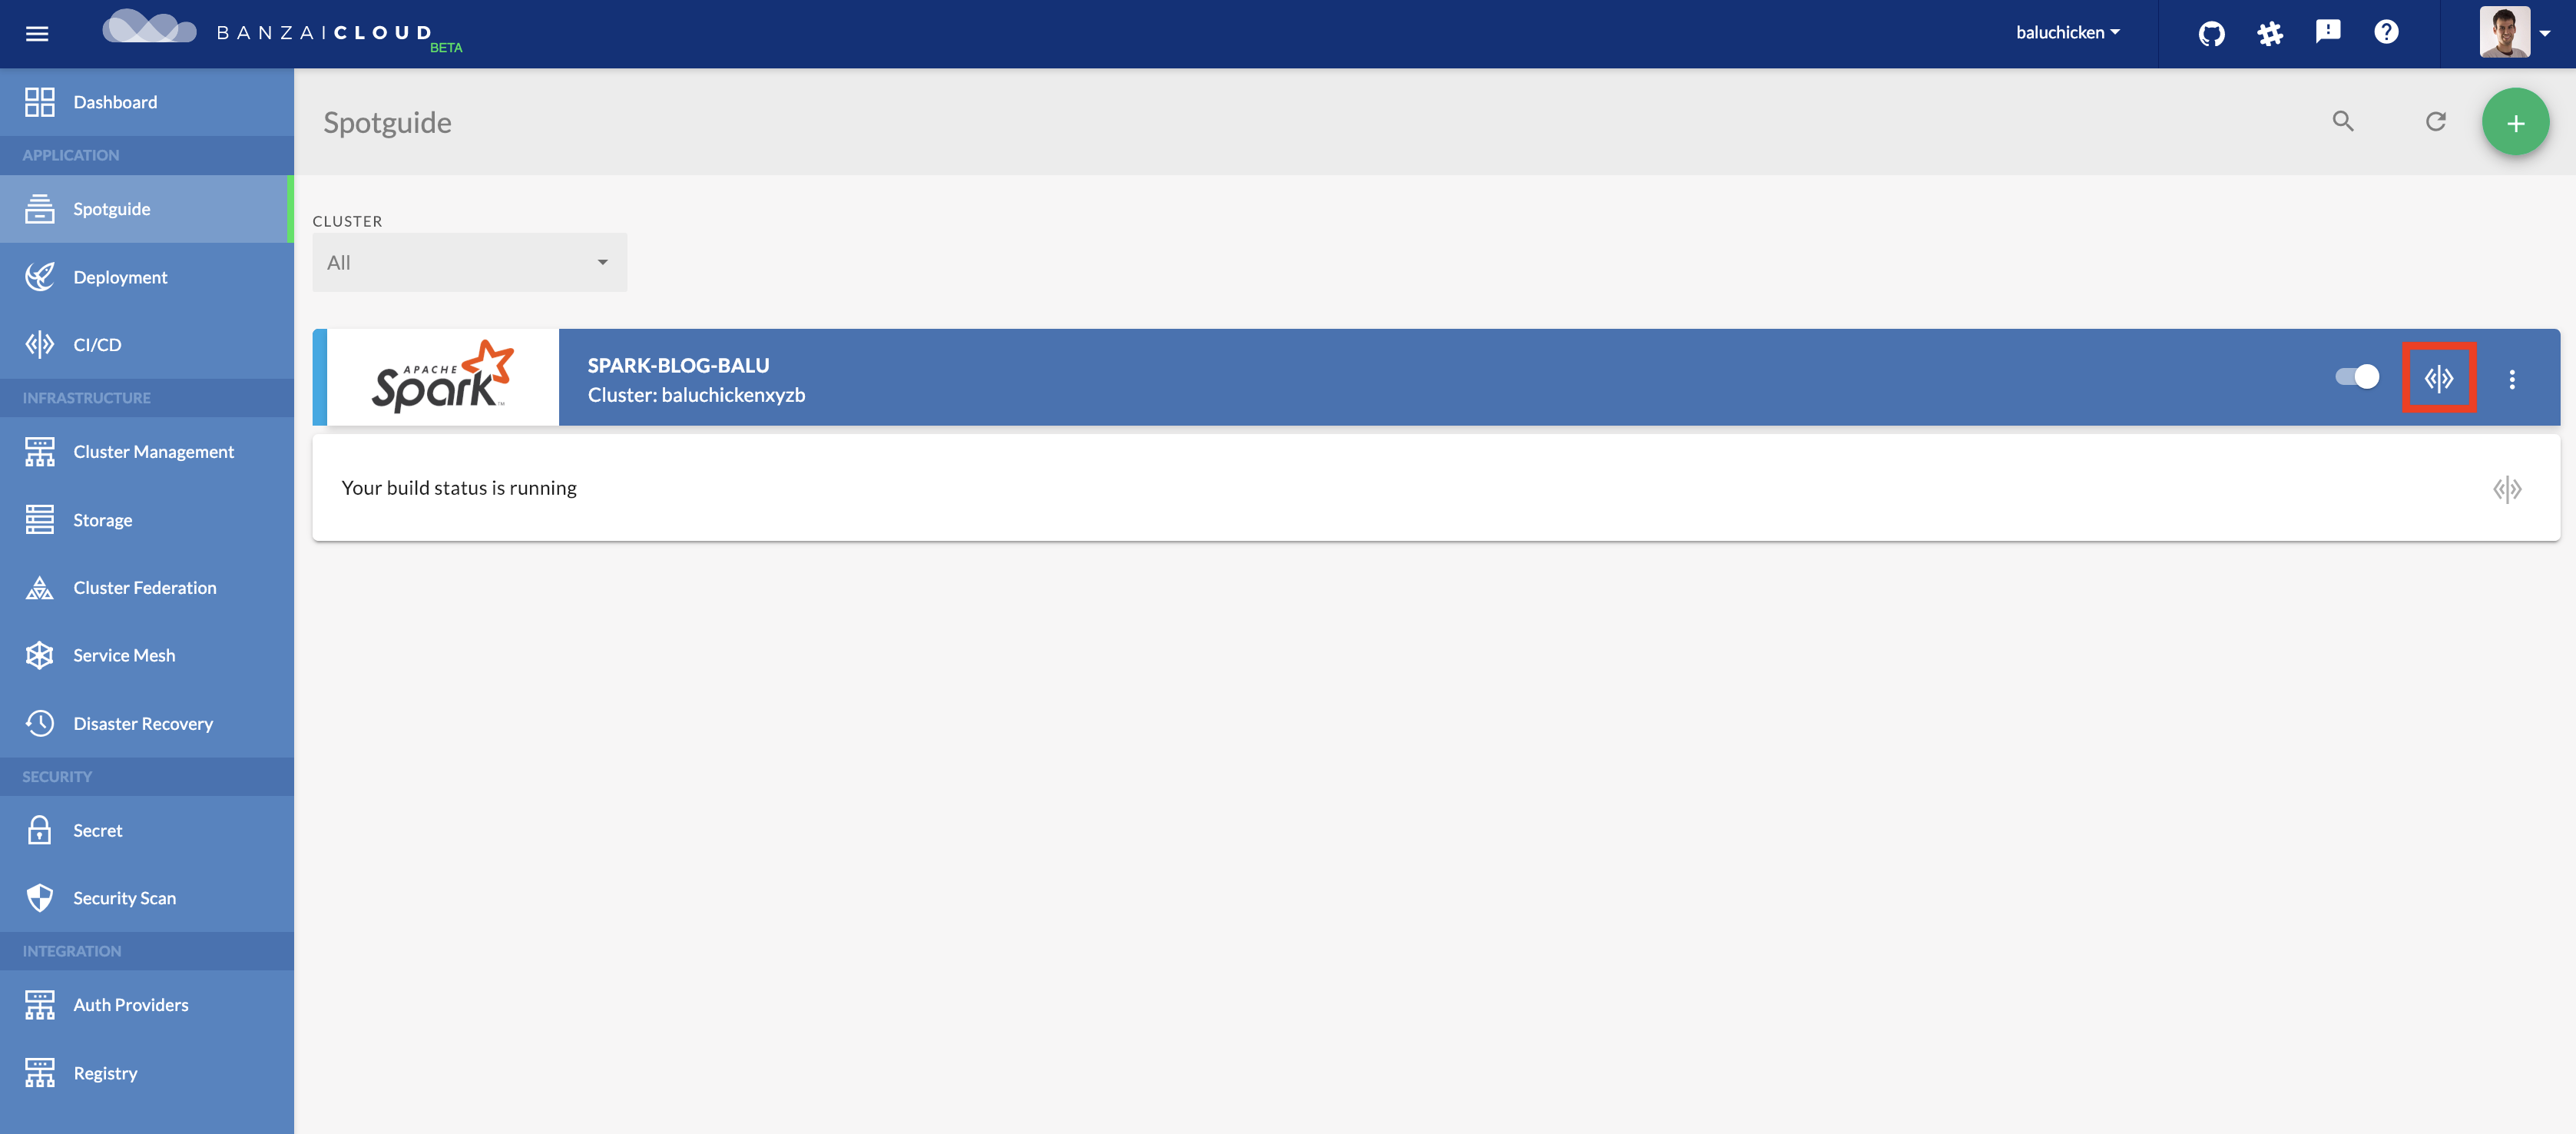
Congratulations, you have just created your first Spotguide. Click on the icon highlighted with a red rectangle to see the build details.
-
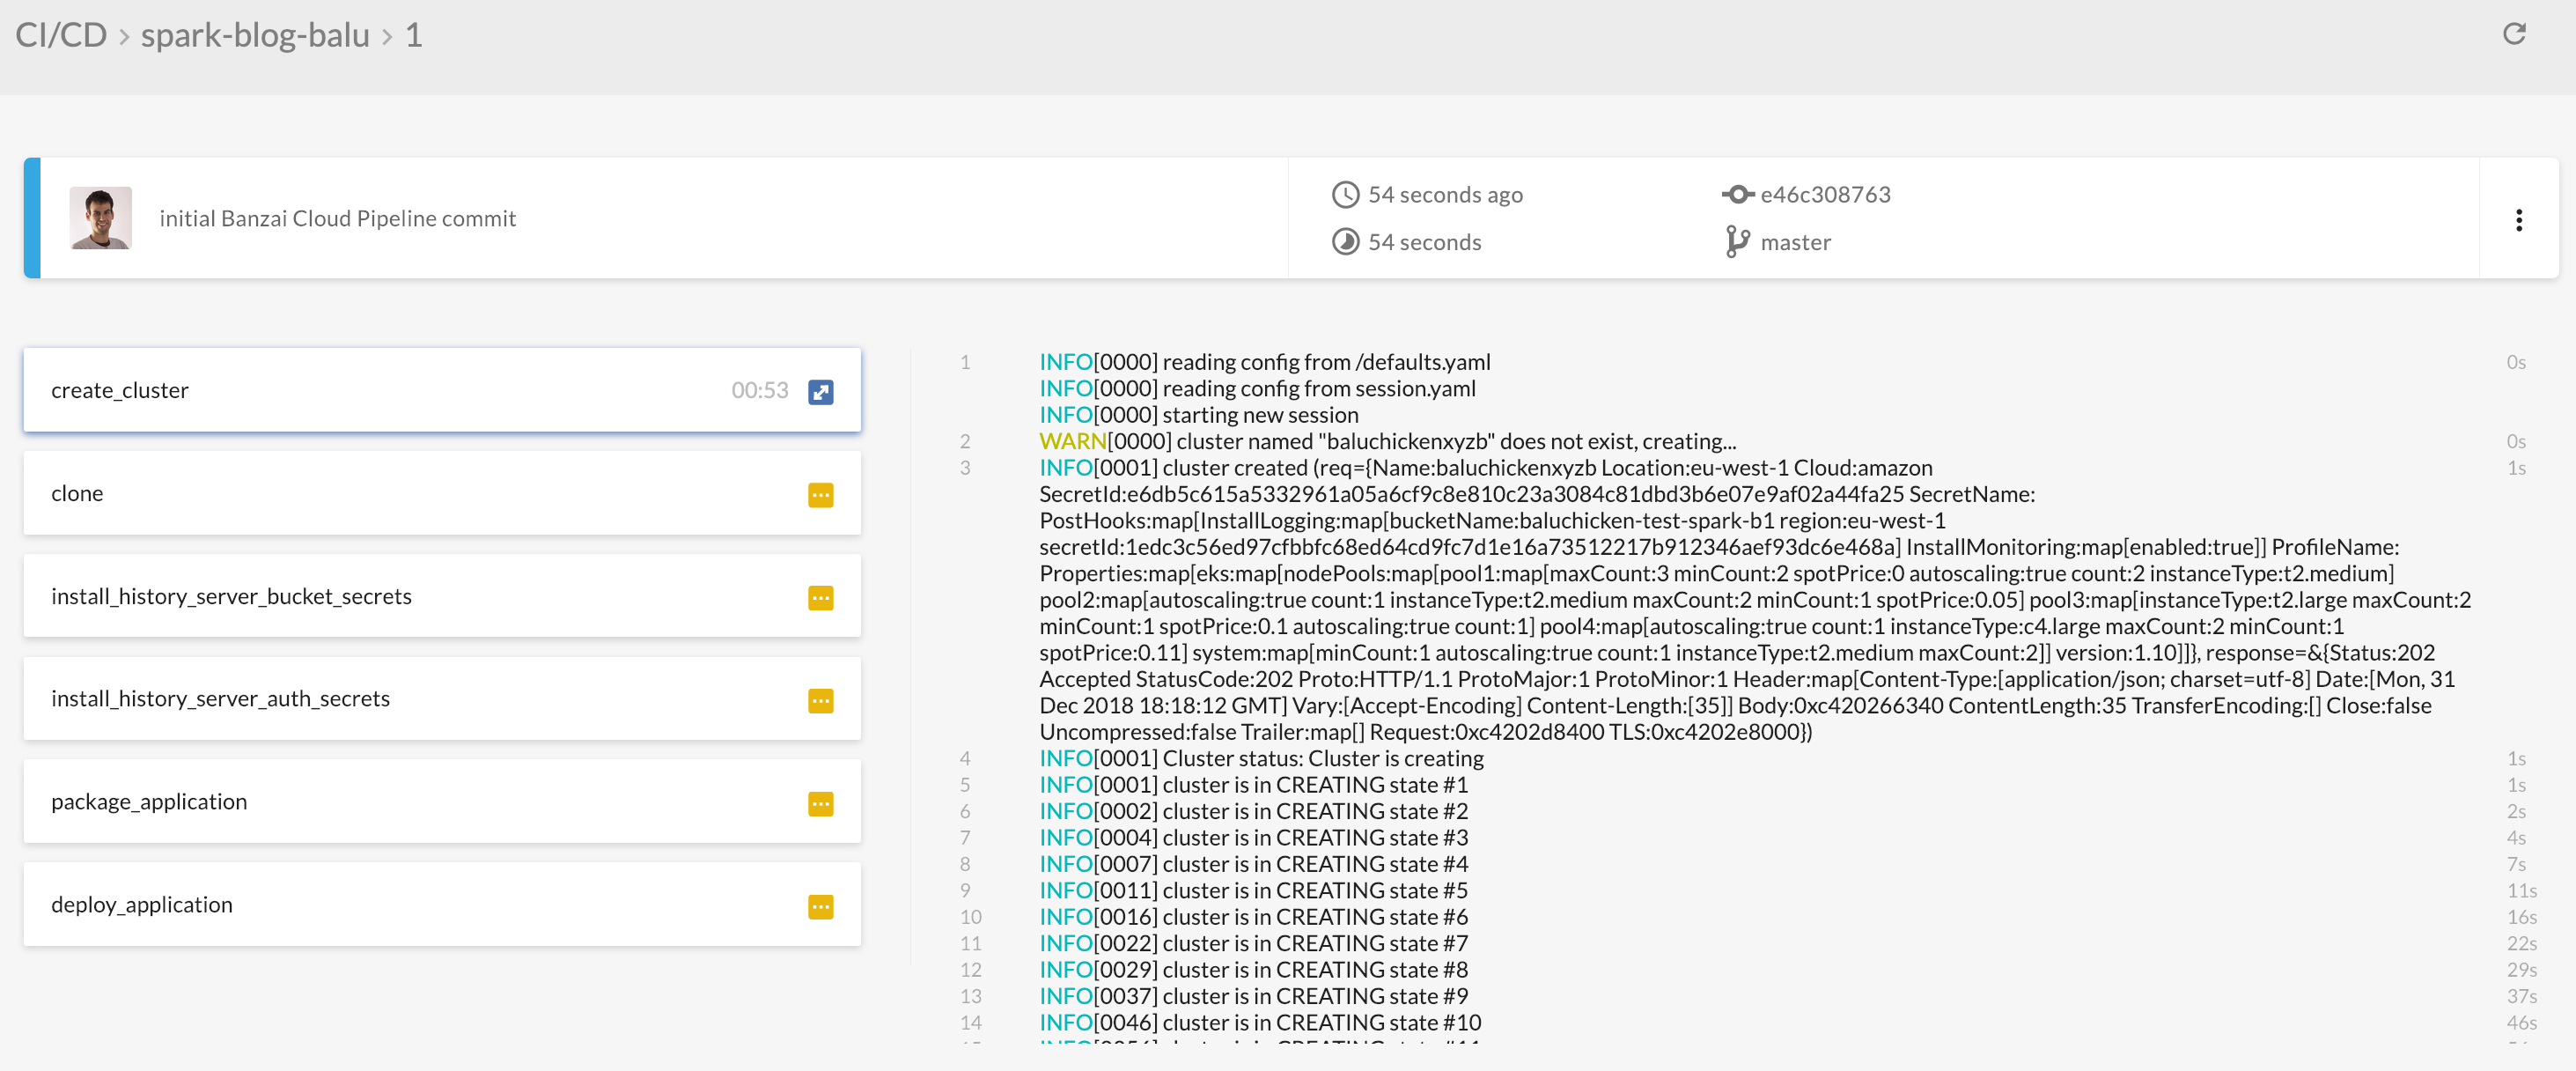
Click on a specific build to see the details page. You can see the Spotguide steps, every step will be highlighted with green if it succeeded.
-
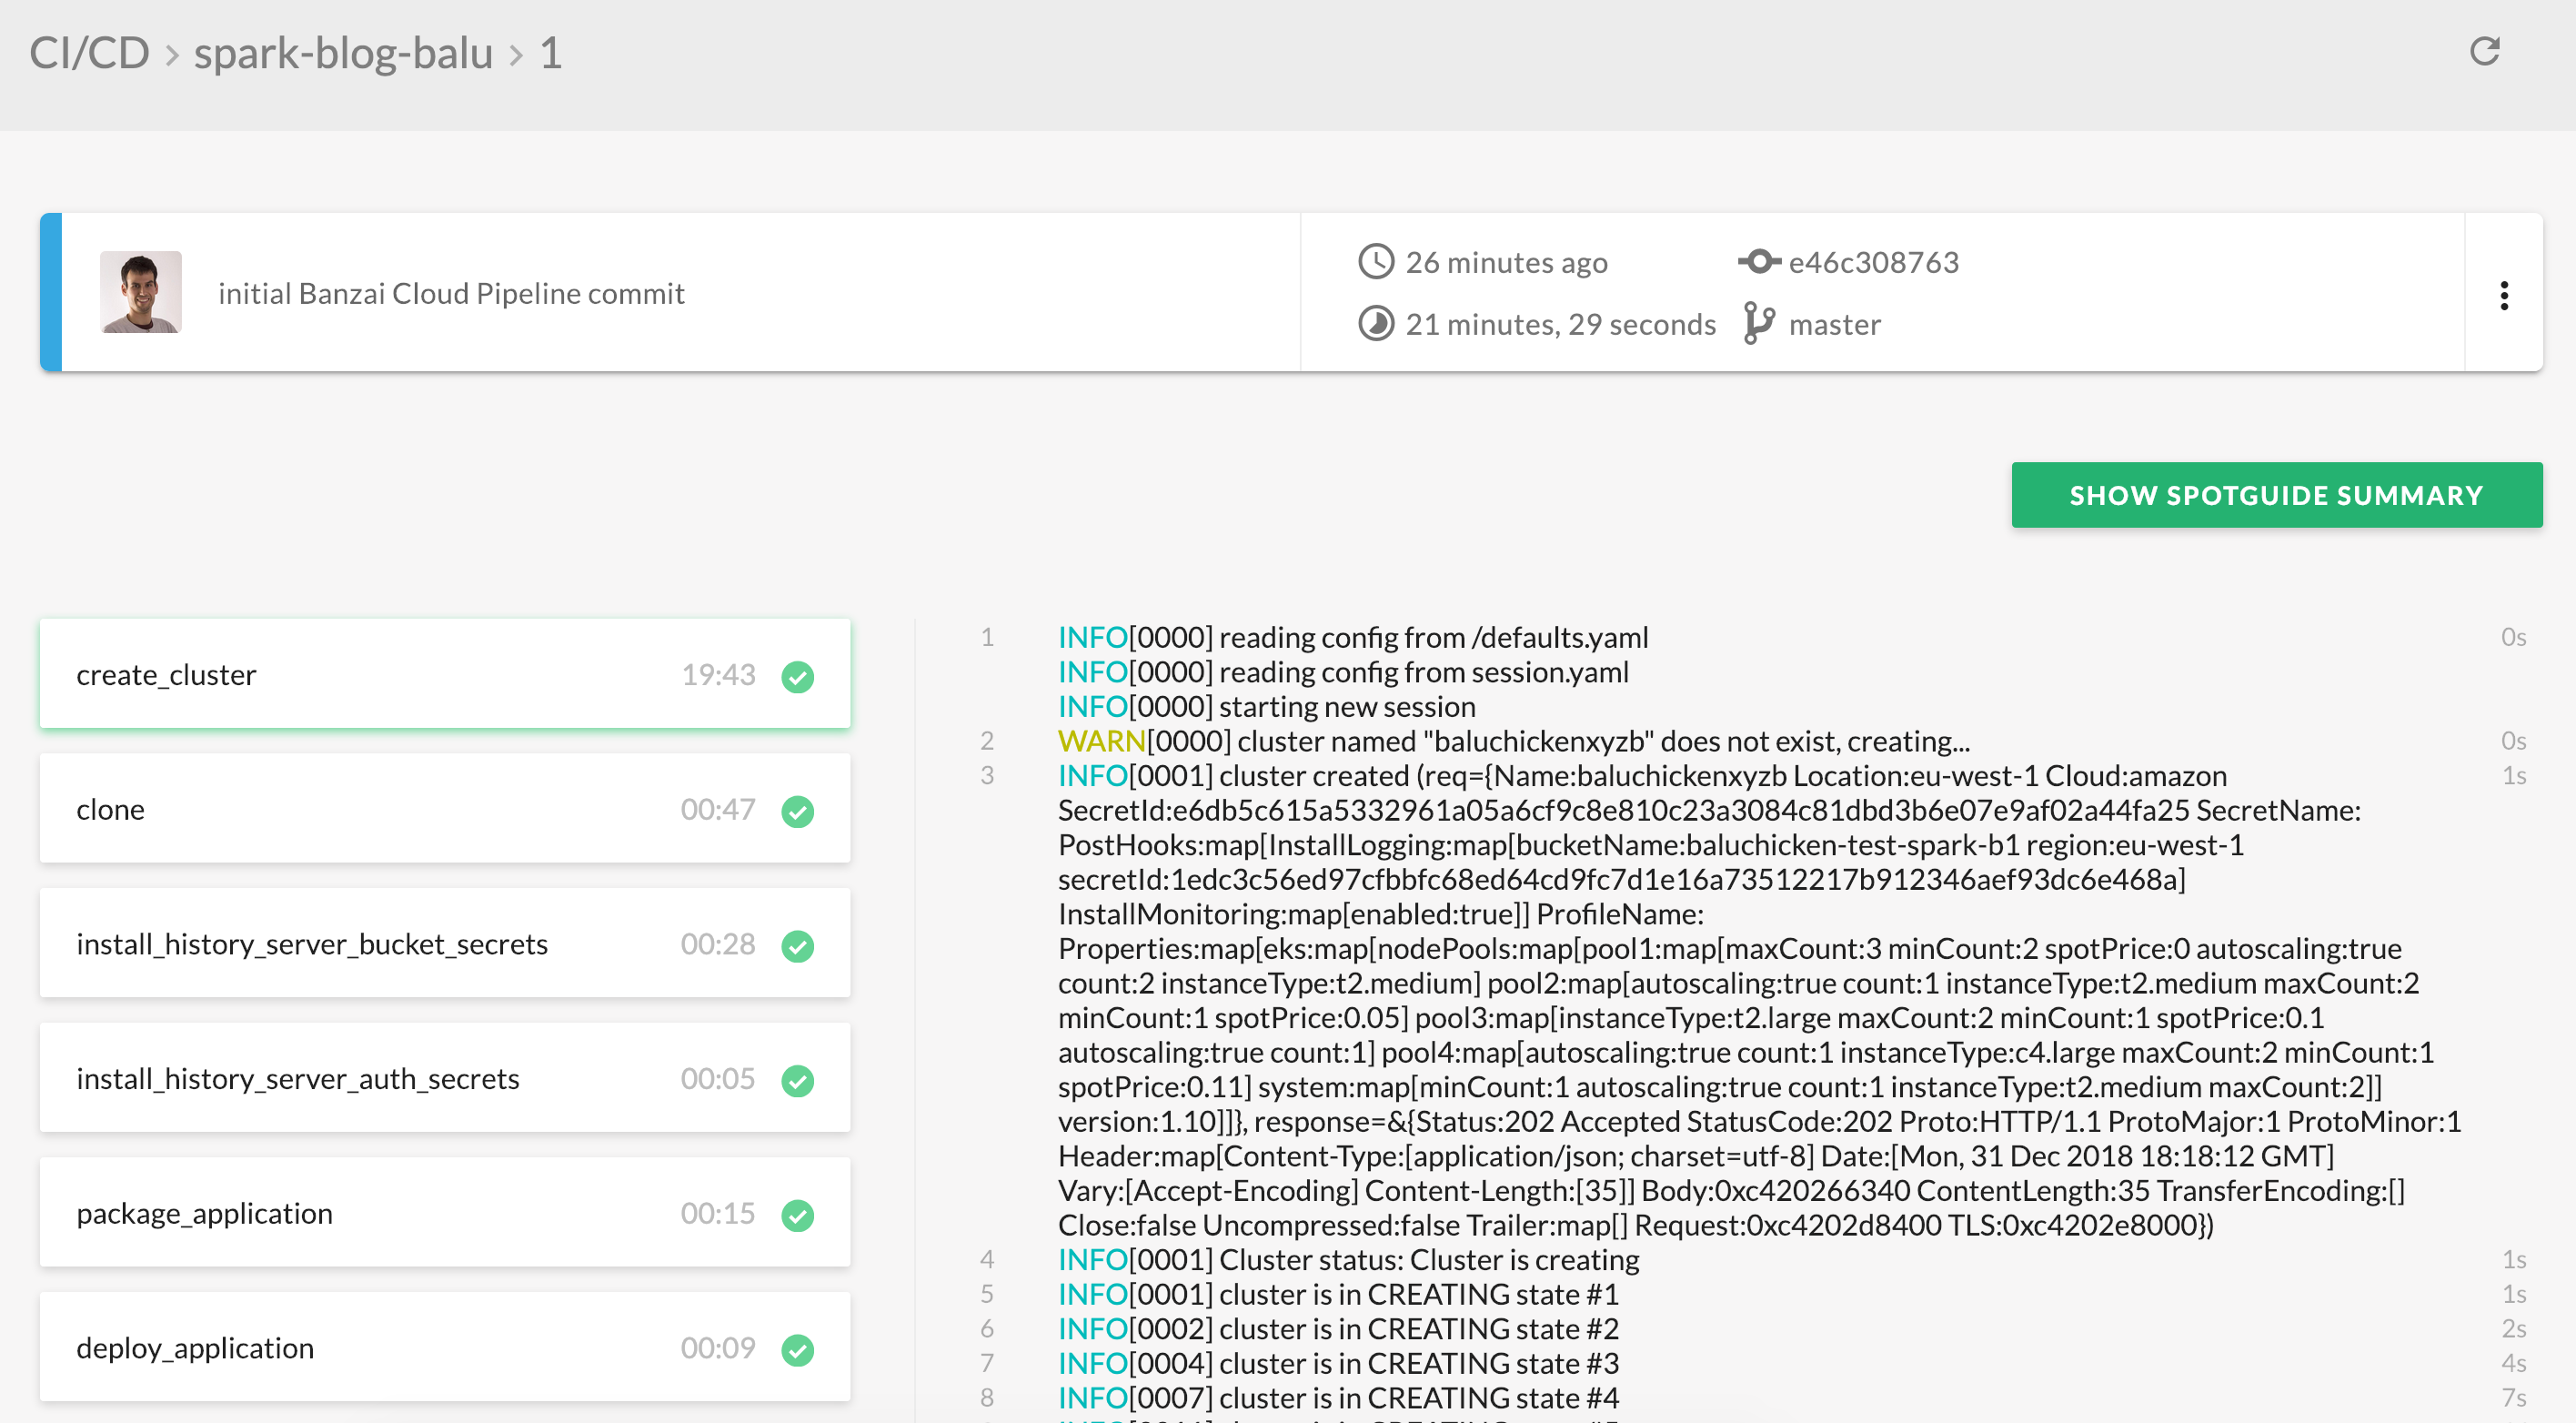
When every step is highlighted with green a new button will show up - Show Spotguide Summary. Click on it and a small readme opens up which walks you through how to run a simple Spark application on your newly instantiated Spotguide. We hope both Spark newbies and experts find this useful.
Manage a running Spotguide 🔗︎
There are some parameters inside the Spark Spotguide which can be used to fine tune it. As an example, let’s assume that the end user would like to add a more relevant Grafana dashboard to a cluster. There are two ways to do it:
- Add it directly through Grafana
- Commit the dashboard json to the Spotguide repository. The Banzai Cloud CI/CD will install the newly added dashboard to Grafana automatically.
About Banzai Cloud Pipeline 🔗︎
Banzai Cloud’s Pipeline provides a platform for enterprises to develop, deploy, and scale container-based applications. It leverages best-of-breed cloud components, such as Kubernetes, to create a highly productive, yet flexible environment for developers and operations teams alike. Strong security measures — multiple authentication backends, fine-grained authorization, dynamic secret management, automated secure communications between components using TLS, vulnerability scans, static code analysis, CI/CD, and so on — are default features of the Pipeline platform.