


Kubernetes is a highly extensible framework that is built from a bunch of loosely coupled components. This gives a very high level of flexibility, but adds some new challenges to the operation compared to monolithic solutions of similar systems of the past. One of these challenges is observability, especially log collection.
This post describes how to collect the logs of Kubernetes components in detail, but does not discuss the collection of application (workload) logs. If you would like to collect logs of your deployments, check the Banzai Cloud Logging operator.
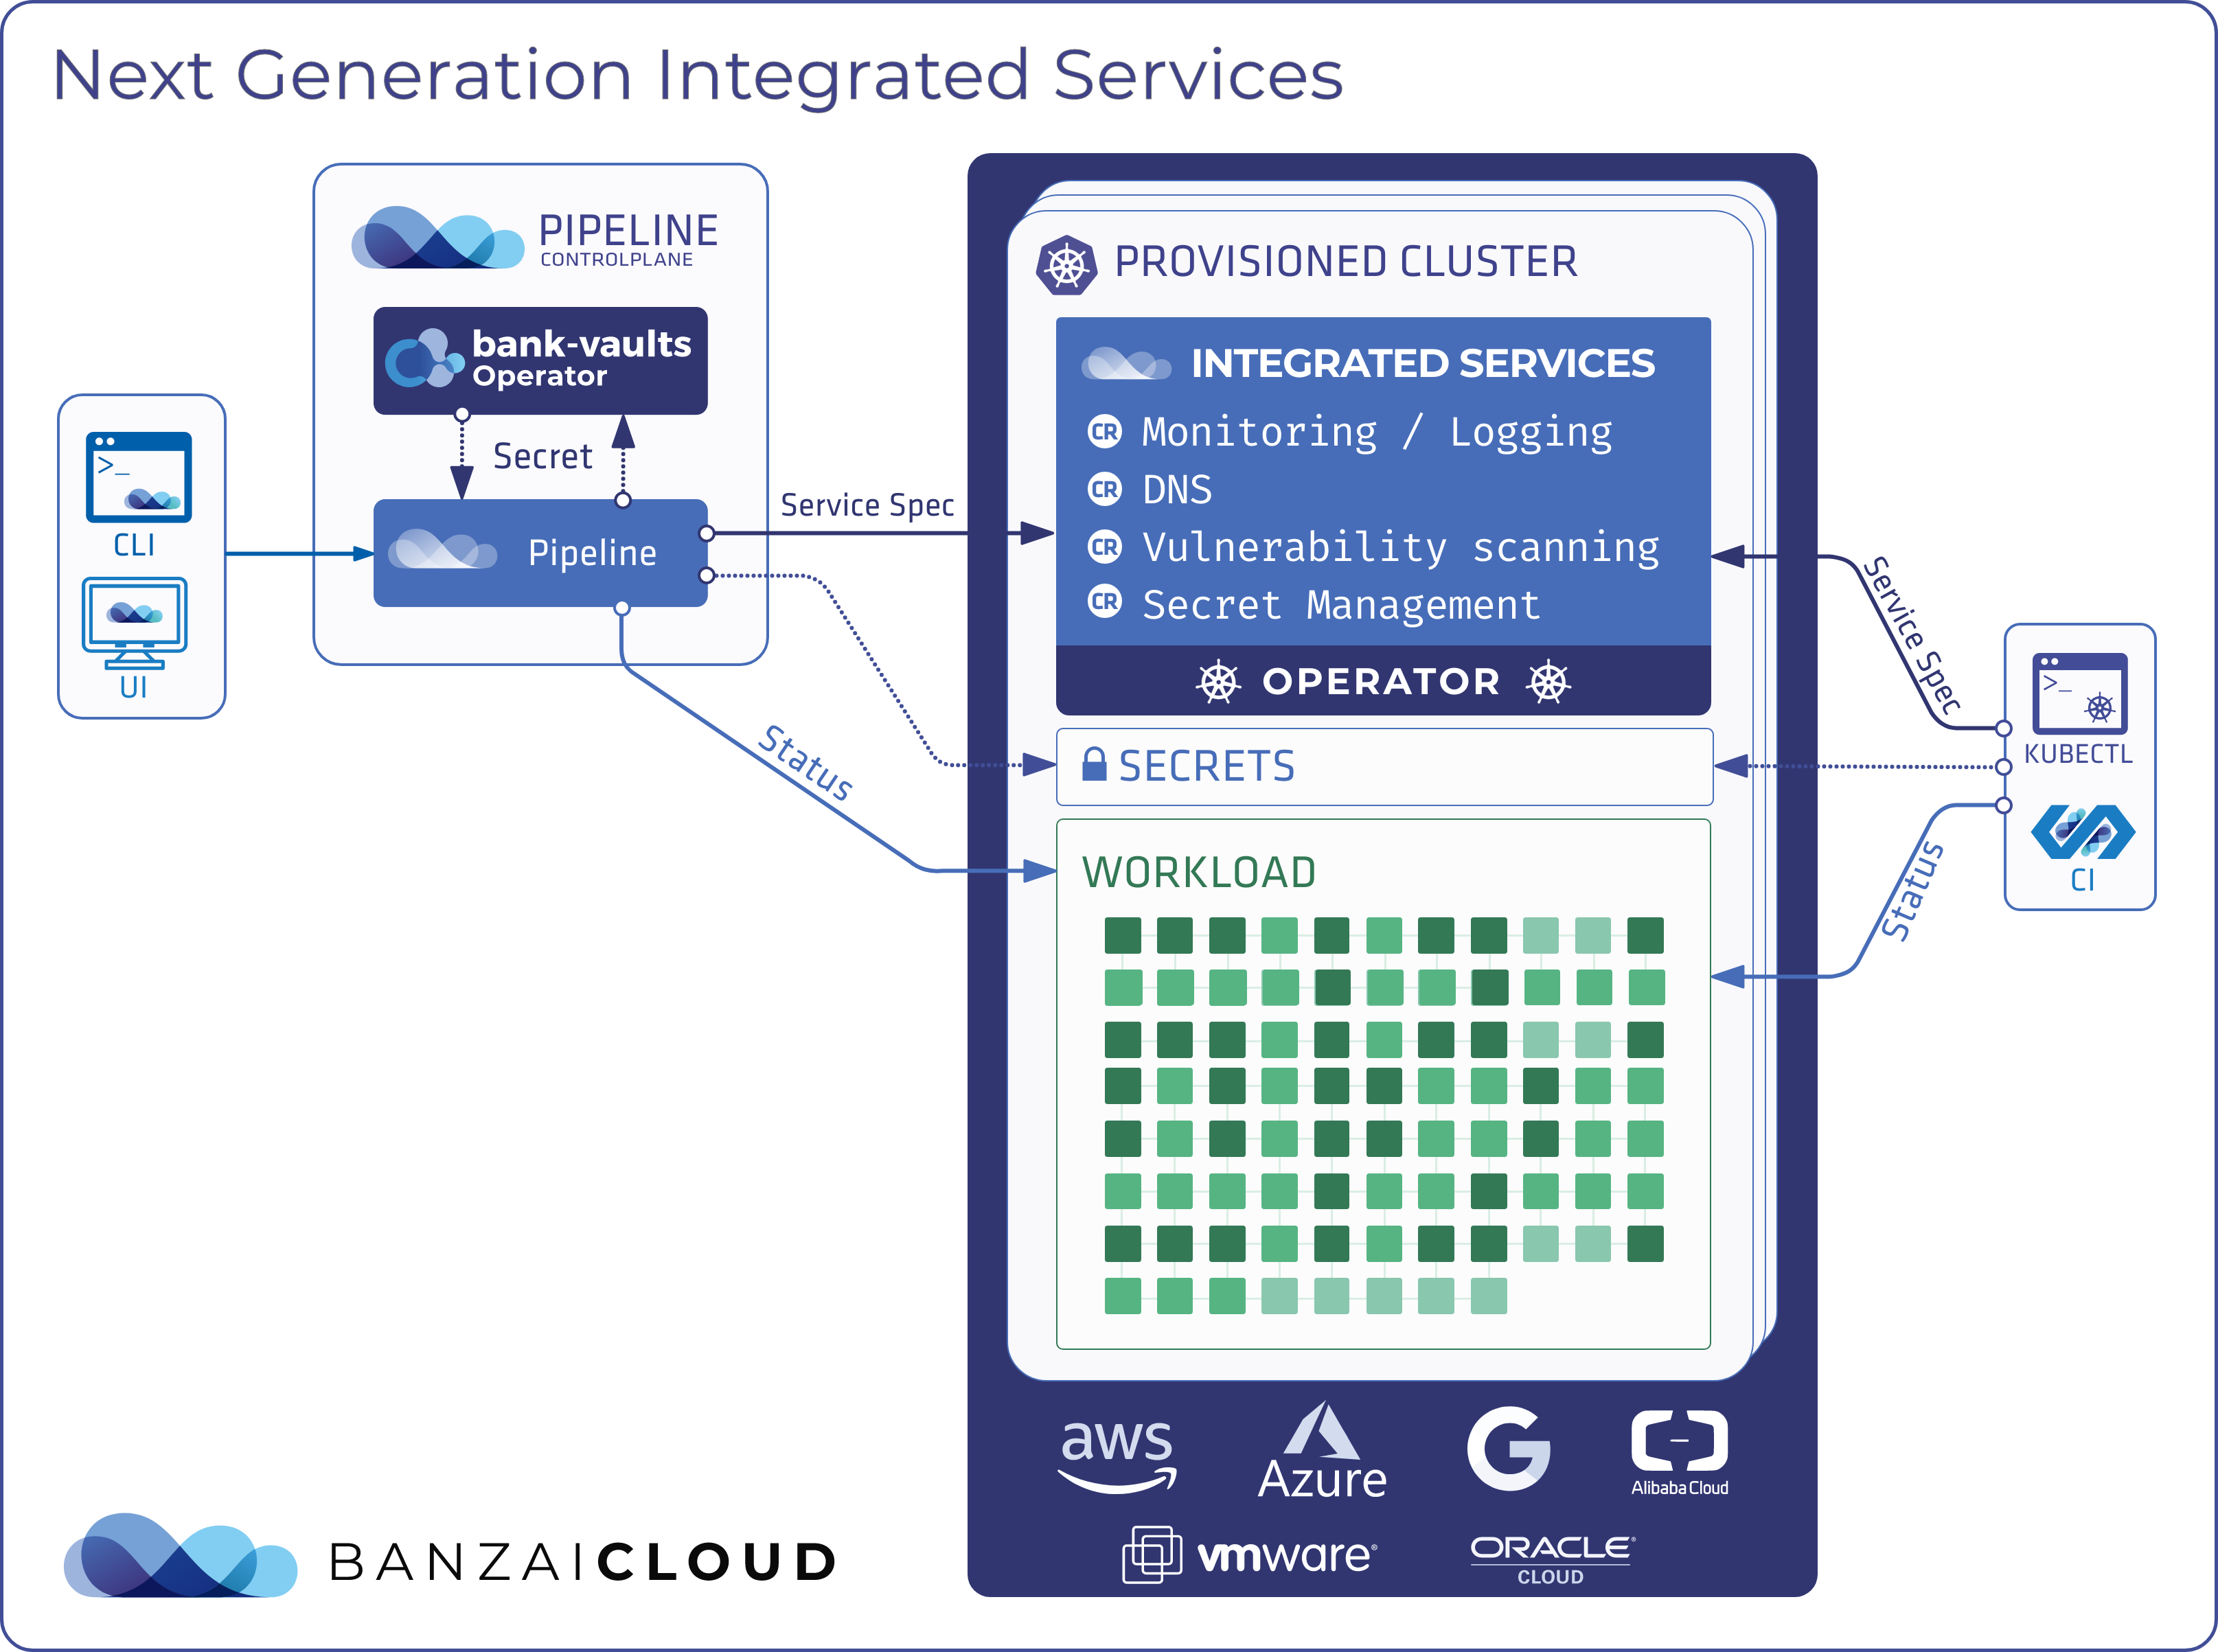
The Banzai Cloud Logging operator is an open source project, which deploys and operates a reliable but easy to configure log collection, aggregation, and forwarding infrastructure for your Kubernetes clusters.
In Kubernetes, there are multiple components with different solutions for recording events that may all be needed together to understand the series of events that lead to an outage or another incident.
This blog post is based on our experience of operating Kubernetes in production environments. You will learn about:
- the most important sources of logs,
- how to classify them based on the usefulness for different purposes, and
- how to collect and correlate them in different scenarios.
The logs from different sources are important for different target groups. We refer to these groups as:
- security operation,
- development or application operation, and
- infrastructure operations.
Of course these groups can’t always be matched directly with teams or organization units, but the tasks related to these roles do exist somewhere in most organizations.
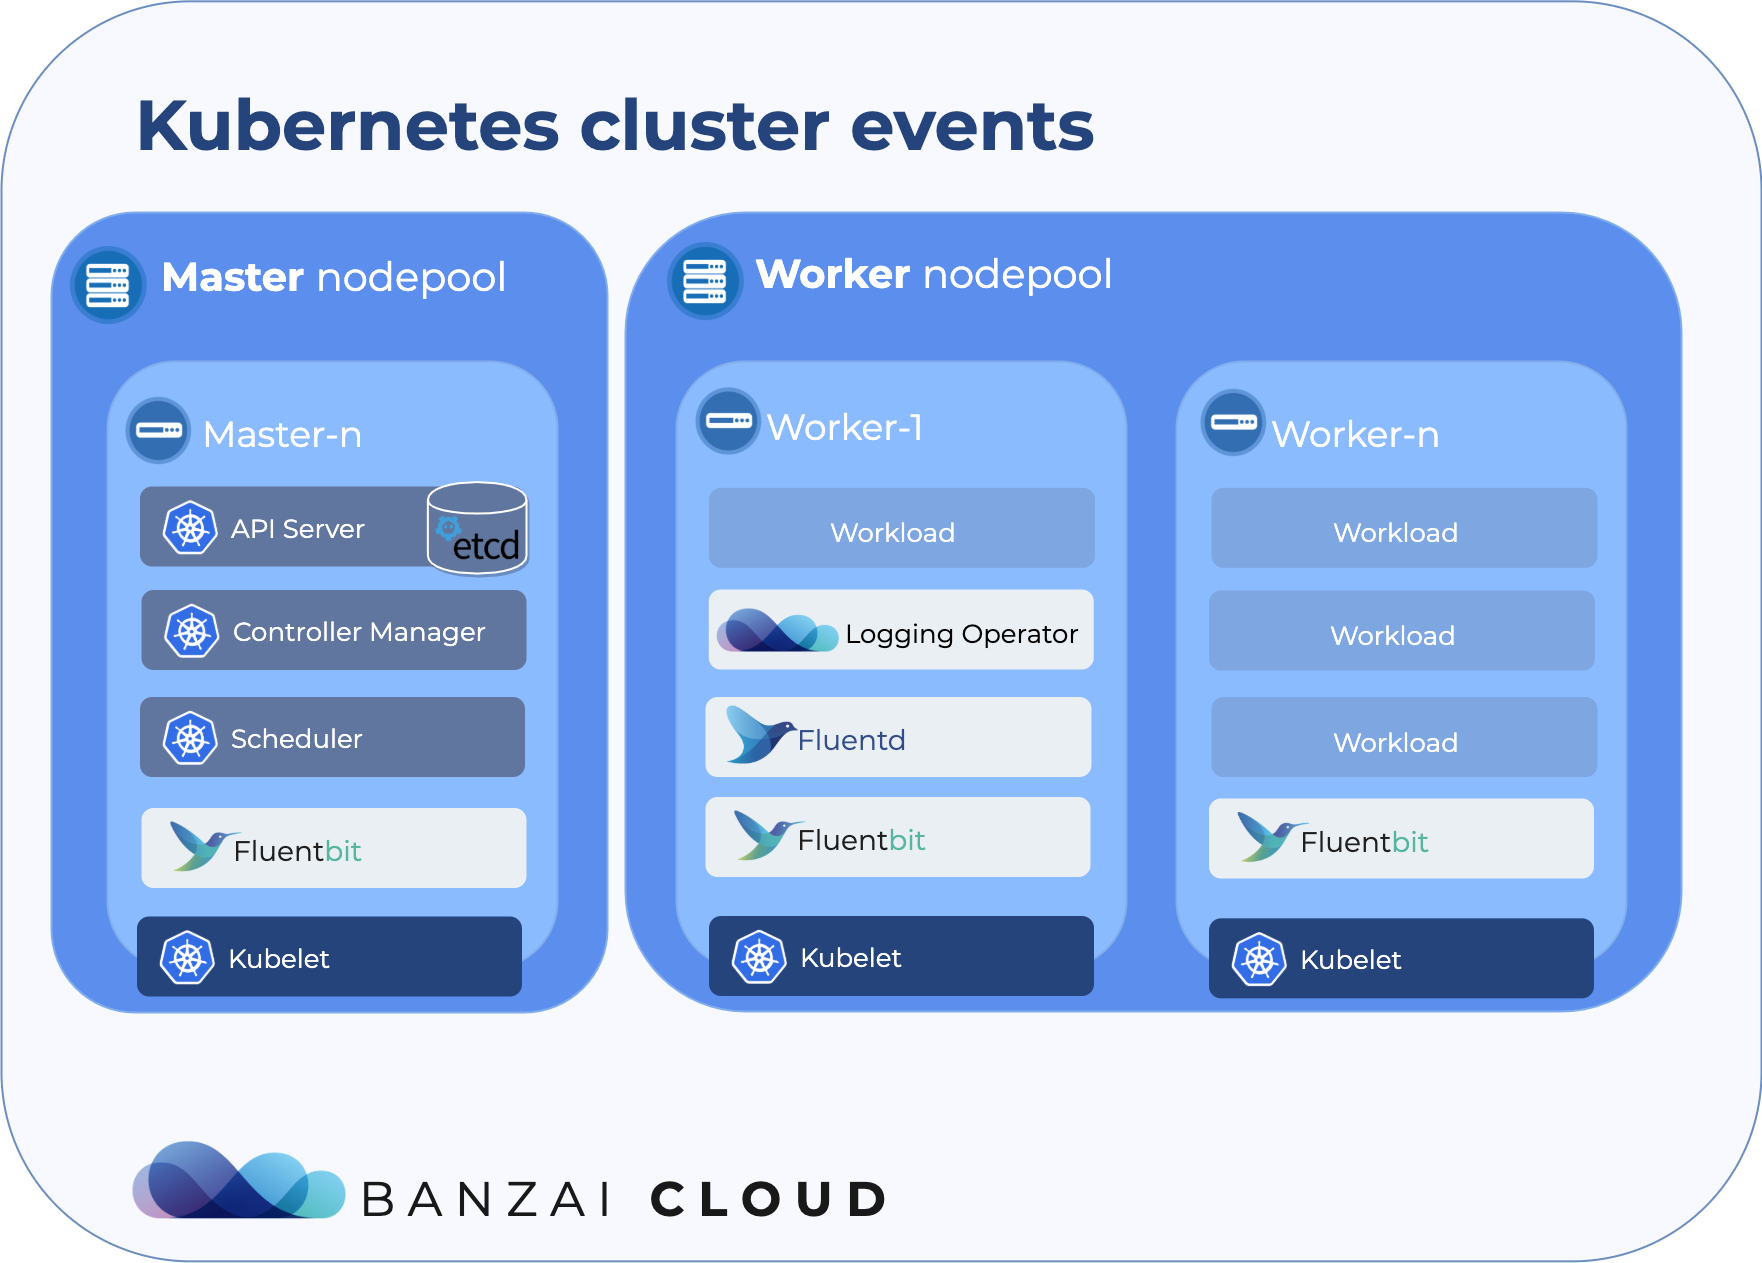
Let’s take a look at the most widely used components and their events in a Kubernetes cluster.
API Server 🔗︎
The Kubernetes API Server is the single source of truth for all the core components, including extensions like operators. Its main responsibilities are to authenticate and authorize requests, provide audit information, validate — and if necessary, mutate — incoming objects, and persist state in etcd. In a high availability scenario there is more than one API server, and typically all API servers receive requests, therefore all of them produce logs simultaneously.
API server logs 🔗︎
The API server writes its logs to the standard error output: you can collect these logs with the Banzai Cloud Logging operator when the API server is running on (either dedicated or generic) Kubernetes nodes, which is the case in most architectures. Of course, traditional log collection solutions work here as well. For managed Kubernetes services, it depends on the cloud provider how they make these logs available. In some cases, you can access such logs only via the logging service of the cloud provider.
Who needs API Server logs
The API server logs can be useful to find out more about failed API requests, but they’re irrelevant under normal circumstances. On rare occasions, when the API server itself fails, the API server logs are needed for infrastructure ops.
Audit logs 🔗︎
The audit log contains a summary about each request that the API server handled, and the corresponding response.
The audit log is special, because it has a separate and very granular configuration. Also, you can send audit events directly to an external HTTP endpoint instead of writing them to disk.
The audit log configuration defines which types of resources will be logged in which stage of the request, and the type of information (for example, the request and response content) should be included. This configuration is static, and cloud providers don’t usually provide a way of granular customization for their managed Kubernetes offerings.
In most configurations, audit logs are written into a log file on the master hosts, and can be collected using the Banzai Cloud Logging operator with a helper pod that accesses to the log files on the host.
If you have control over the master host, you can also use a traditional log collector, but that requires you to customize the host images. It also means that you have to operate a parallel logging solution outside Kubernetes.
Managed Kubernetes offerings often channel the audit logs to the cloud provider’s logging solution.
Who needs audit logs
Audit logs are essential for security teams, as well as for infrastructure ops, to be able to analyze the series of requests that’ve lead to the current state of the system.
Events 🔗︎
Kubernetes events are objects that show you what is happening inside a cluster, such as what decisions were made by the scheduler or why some pods were evicted from the node. All core components and extensions (operators) may create events through the API Server.
Access event logs 🔗︎
Event objects are not regular log events, therefore the Kubernetes logs do not include them. Kubernetes has no builtin support to store or forward these events on the long term, and they are cleaned up after a short retention time.
Developers, application and infrastructure operators can use the kubectl describe command against specific resources, or use the more generic kubectl get event command to list events for a specific resource, or for the entire cluster.
You can collect the events from the audit log, but a better alternative is to use a dedicated application.
A dedicated application inside the Kubernetes cluster can watch these events on the API Server and write them to the standard output, where you can collect them using the Banzai Cloud Logging operator or other log aggregation methods.
Collect event logs 🔗︎
The easiest way to collect event logs is to simply run kubectl get events --watch in a deployment, and collect its output with the Banzai Cloud Logging operator.
The Logging operator Advanced Extensions provide a more sophisticated solution based on this idea.
Note: Events have no direct relationship with log messages generated by the various components, and are not affected with the log verbosity level. When a component creates an event, it often emits a corresponding log message. Events are garbage collected by the API Server after a short time (typically after an hour, 5 minutes in case of EKS), which means that they can be used to understand issues just happening, but you have to collect them to investigate past events.
Who needs event logs
Events are the first thing to look at for application, as well as infrastructure operations when something is not working as expected. Keeping them for a longer period is essential if the failure is the result of earlier events, or when conducting post-mortem analysis.
Etcd 🔗︎
Etcd is the standard persistence layer behind the Kubernetes API Server. It is used exclusively by the API Server, and as such, isn’t really interesting just until it stops working as expected. In this case, long term historic logs may also be useful for the infrastructure ops engineers to find out if specific events have already happened earlier, or track down the details and root causes of a failure.
Cloud provider managed Kubernetes offerings give no access to etcd logs, but infrastructure operations may need them in case of self-managed clusters. In the most common scenarios, etcd is running on the master hosts, but outside the Kubernetes cluster. That makes log collection methods quite similar to the API server logs.
Authenticator 🔗︎
Kubernetes provides a powerful integration point for external authentication providers, although a generic cluster is completely functional without one. For example, our Kubernetes distribution (the Banzai Cloud Pipeline Kubernetes Engine) has no authenticator service, but uses client certificates instead.
In most managed Kubernetes offerings, the authenticator is a unique control plane component that uses provider-specific credentials sent by external clients for authentication, and provides information required by the API Server for authorization.
Note: The authenticator is typically used to authenticate users or external components, not in-cluster services.
Usually, you can access the authenticator logs only using the cloud provider’s log stack. If you operate the authenticator yourself, log collection may be as simple as configuring the Banzai Cloud Logging operator to collect the component’s standard outputs.
Who needs authenticator logs
Authenticator logs are relevant for either security or infrastructure ops teams during the investigation of incidents or troubleshooting.
Controller manager 🔗︎
The controller manager is responsible for ensuring state changes and the logic behind core Kubernetes constructs.
Note: In a high availability scenario, only one of the controller managers — the leader — is producing logs, because all the other ones are idle.
The Banzai Cloud Logging operator collects the controller manager logs if the controller manager is running inside the cluster, which is the case frequently. Managed Kubernetes offerings may channel these logs to their own logging stack.
Who needs controller manager logs
The logs of the controller manager can be used to reconstruct the precedence of events during the investigation of an incident, or to understand the behavior of the system. These logs are needed for the operation of cloud native applications, the infrastructure, or for security incident analysis.
Scheduler 🔗︎
The main responsibility of the scheduler is to choose which nodes to start newly launched pods on, based on resource requests and other conditions.
The scheduler log itself is not very helpful on its own.
Most of the scheduling decisions are available as Kubernetes events, which can be logged easily in a vendor-independent way, thus are the recommended source for troubleshooting.
The scheduler logs might be needed in the rare case when the scheduler is not functioning, but a kubectl logs call is usually sufficient.
Anyway, the Banzai Cloud Logging operator can collect the logs of an in-cluster scheduler.
Note: In a high availability scenario, only one of the Schedulers — the leader — is producing logs, because all the other ones are idle. This is true even if you are running custom schedulers in the cluster for some reason.
Kubelet 🔗︎
Kubelet is an agent that runs on each node of the cluster. Its main responsibility is to launch and manage the containers and other resources of the pods that are scheduled to the node.
You can collect Kubelet logs with the Banzai Cloud Logging operator from the host filesystem of each worker node.
Who needs Kubelet logs
Kubelet logs can be useful for infrastructure ops during troubleshooting issues that may be caused by failures in and around the container runtime.
Kube-proxy 🔗︎
Kube-proxy runs on each node and maintains the network rules on the nodes, most of the time in Kubernetes pods. These network rules allow network communication to pods from network sessions inside or outside of the cluster.
Just like for other components running in Kubernetes, you can configure the Banzai Cloud Logging operator to collect the logs from the container output. If Kube-proxy is running on the host, the Banzai Cloud Logging operator can collect its logs using a helper pod that tails the log files or the journal on the host.
Who needs Kube-proxy logs
Kube-prox logs are mostly relevant for infrastructure operations teams to identify issues related to network access of services.
Conclusions 🔗︎
In this post, we have reviewed how the most important components of a Kubernetes cluster emit log messages, and how you can access them in different situations.
The open source Banzai Cloud Logging operator is a handy way to collect all your logs from a Kubernetes cluster. While the operator itself works on most if not every possible Kubernetes distribution, architecture, or deployment, it may take considerable effort to collect logs from Kubernetes components hosted outside of the cluster.
That is why we created the Logging operator Extensions, which is a component of our commercial observability product line. Logging operator Extensions is a ready-to-use set of tools and configurations for collecting logs from a wide variety of sources present in real-world Kubernetes deployments, with a focus on PKE and the distributions supported by Banzai Cloud Pipeline.