


On this blog we’ve already discussed our totally redesigned logging operator, which automates logging pipelines on Kubernetes. Thanks to the tremendous amount of feedback and the numerous contributions we received from our community, we’ve been able to rethink and redesign that operator from scratch, but the improvements aren’t going to stop coming any time soon. Our goal is to continue removing the burden from human operators, and to help them manage the complex architectures of Kubernetes.
Naturally, our logging operator is already integrated into Pipeline, the Banzai Cloud hybrid cloud container management platform. However, having so many users in our open source community means having users with a wide variety of requirements - one of which is invariably the storing of logs in Elasticsearch.
Spoiler alert!
Besides logging, we are working on an end-to-end observability solution for Kubernetes, which will rely heavily on our logging operator, extending it with features like:
- A CLI tool to install and manage logging configurations
- A feature to deploy and manage multi-cluster scenarios
- Tools for even more in-depth analysis of your logs
In this post you’ll be able to learn about an actual use-case brought to us by one of our customers. After reading it, you should be able to parse, transform and display access logs with geolocation data using the logging operator.
If you want to learn more about the basics of our operator (its architecture and configuration) please read the previous blog post in this series.
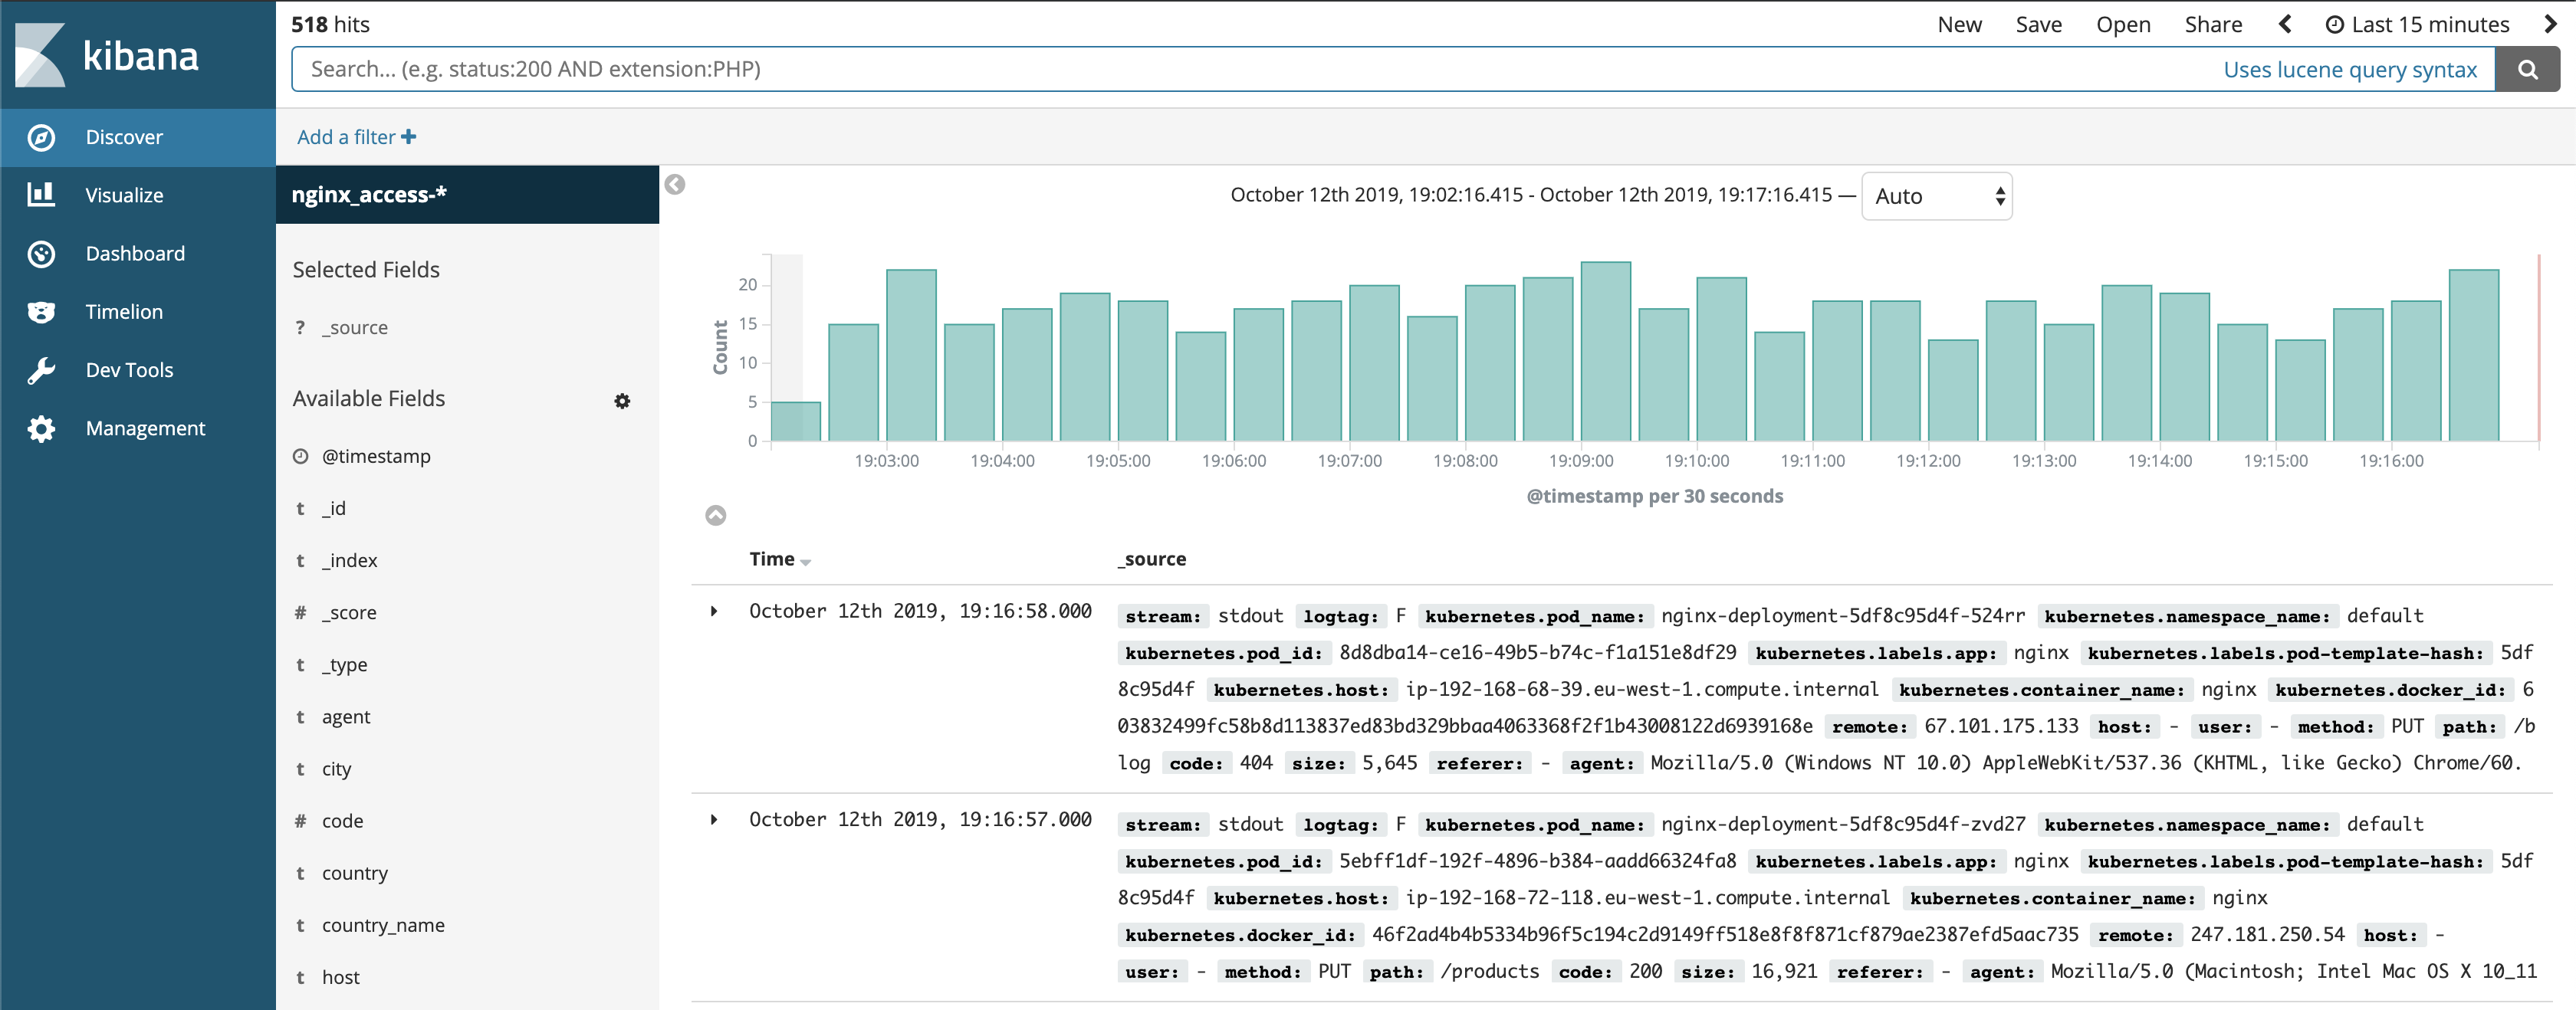
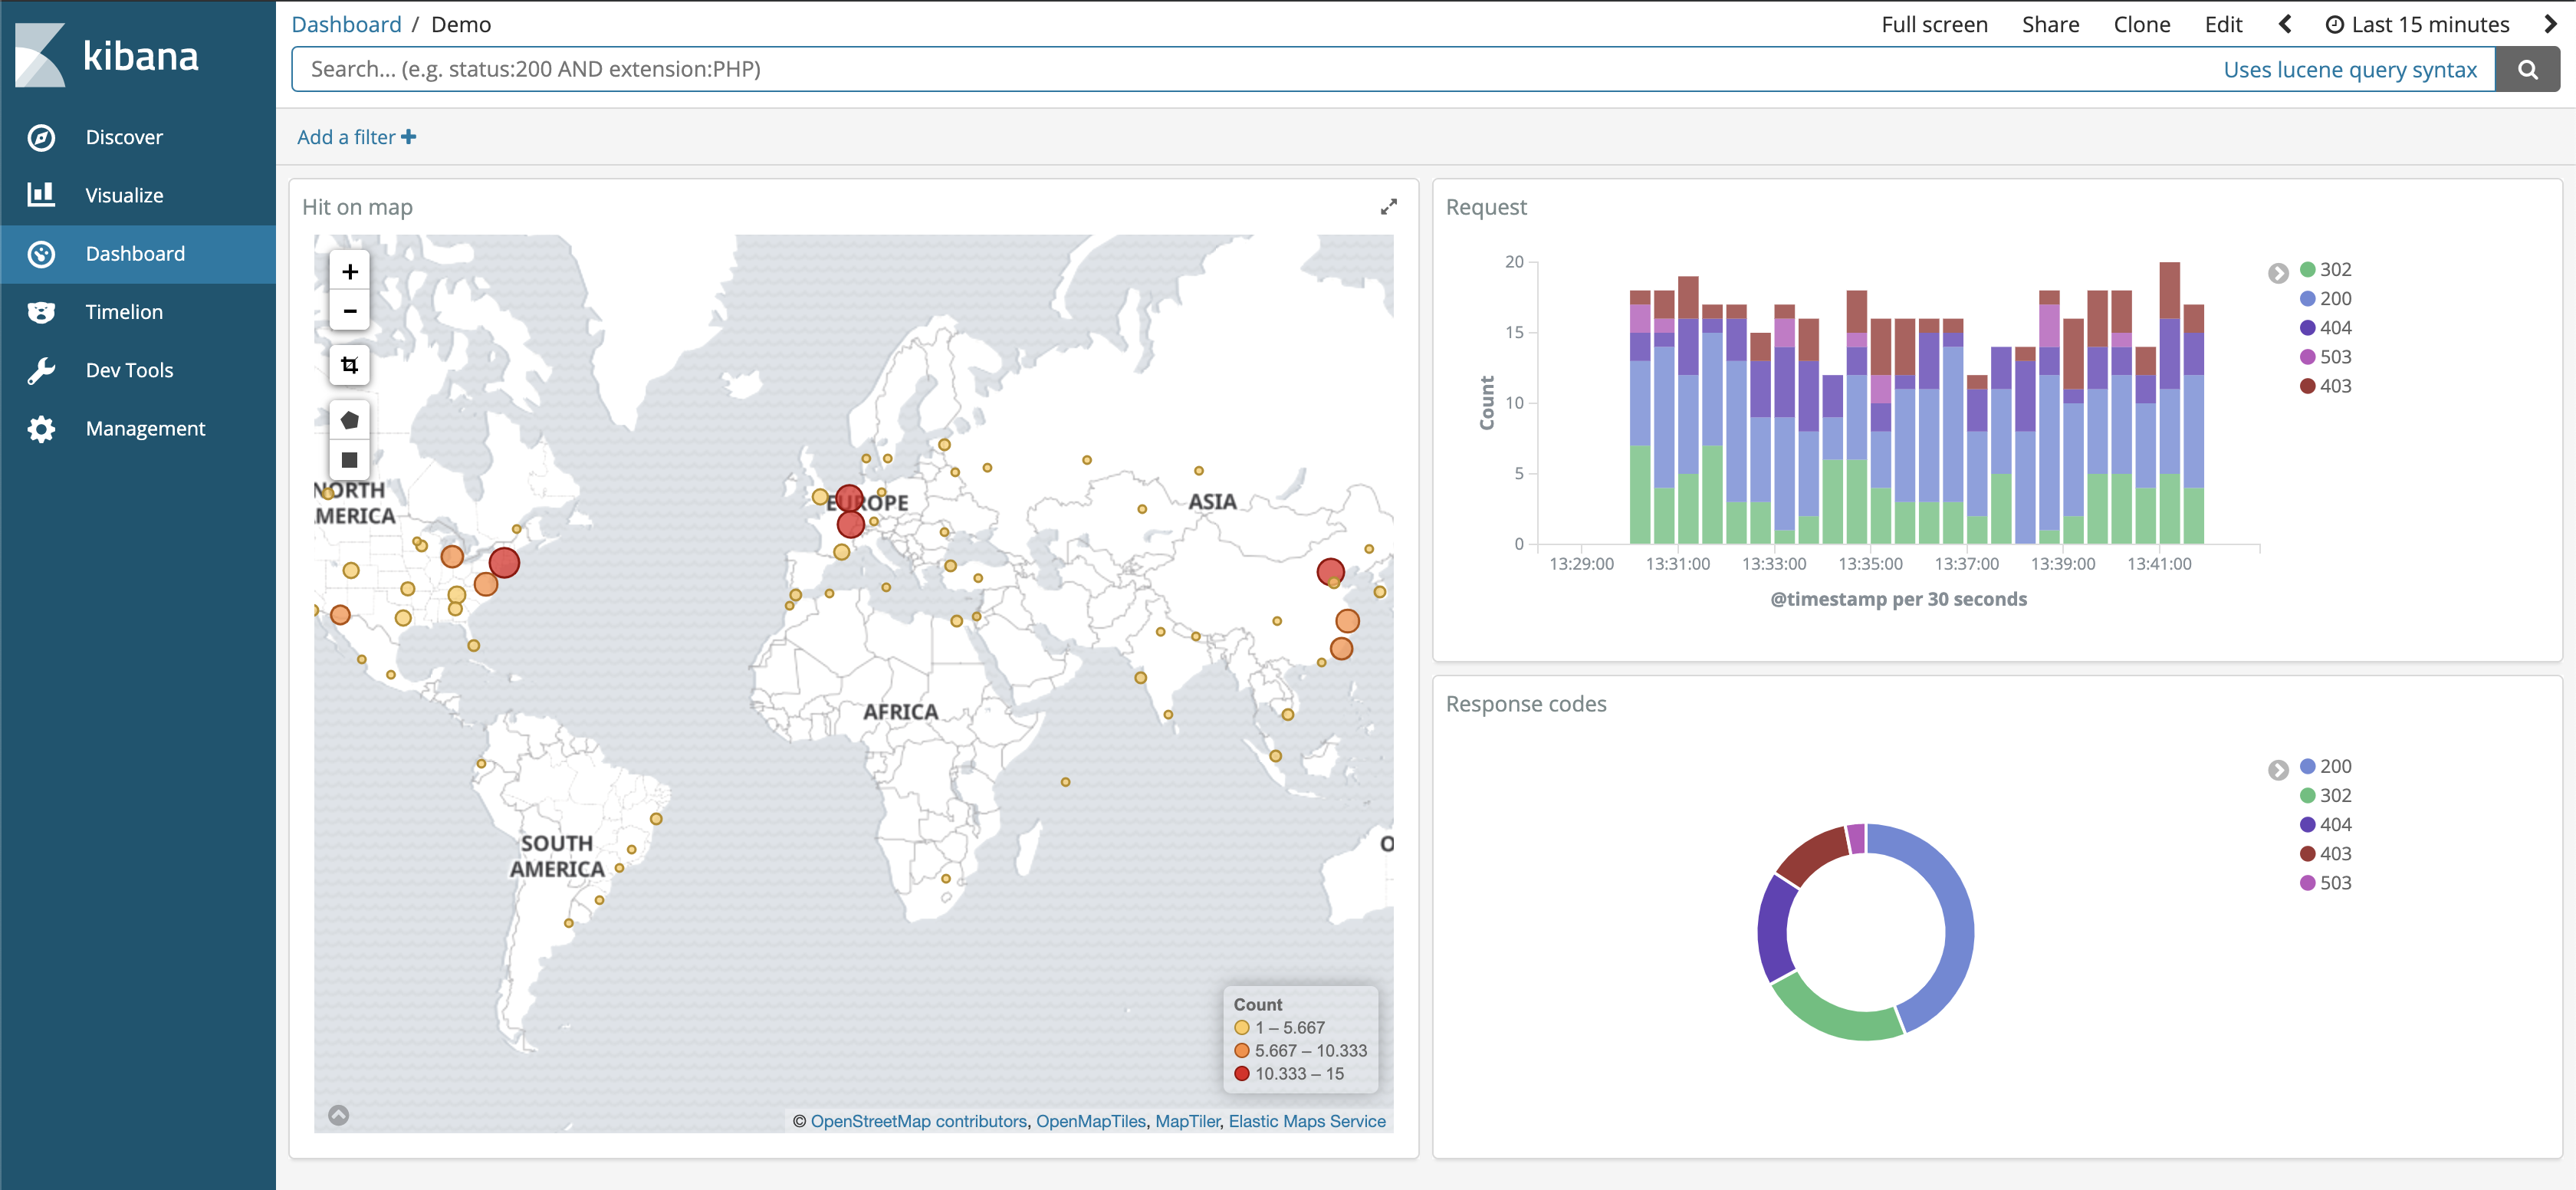 Nginx access log on Kibana
The EFK stack 🔗︎
I am sure most of you are familiar with the acronym EFK. It stand for Elasticsearch - Fluentd - Kibana. We’ve blogged before about how we used to use the EFK stack; feel free to refresh your memory on the subject by reading the “The EFK (Elasticsearch-Fluentd-Kibana) stack” section before you do anything else.
Analysing access logs 🔗︎
Access logs are the most basic source of information for any web application. In them, you can find important metrics like a site’s traffic volume (request/min), its HTTP response codes, and more. Typically, you also get the real IP addresses of visitors and thus their locations. The following example showcases the production, deployment, and the analysis of, one of our nginx access logs.
How GeoIP filters work 🔗︎
Every incoming connection has a source IP address. All IP addresses are registered in global and regional databases; one of the most famous of these is Maxmind’s GeoIP. A free Lite version of that database is available, but, of course, more detailed and accurate versions are also available for purchase. The database itself consists of structured information about IP address ranges.
This structured information usually comes in the form of several pieces of data. A few examples:
- City - Name of the City (Nashville)
- Country - ISO code of the Country (US)
- Country Name - Name of the Country (United States)
- Postal Code - (37243)
- Latitude - Coordinate latitude part (-86.7845)
- Longitude - Coordinatelongitude part (36.1676)
To extract this information we’ll use the Fluent GeoIP plugin.
Showtime 🔗︎
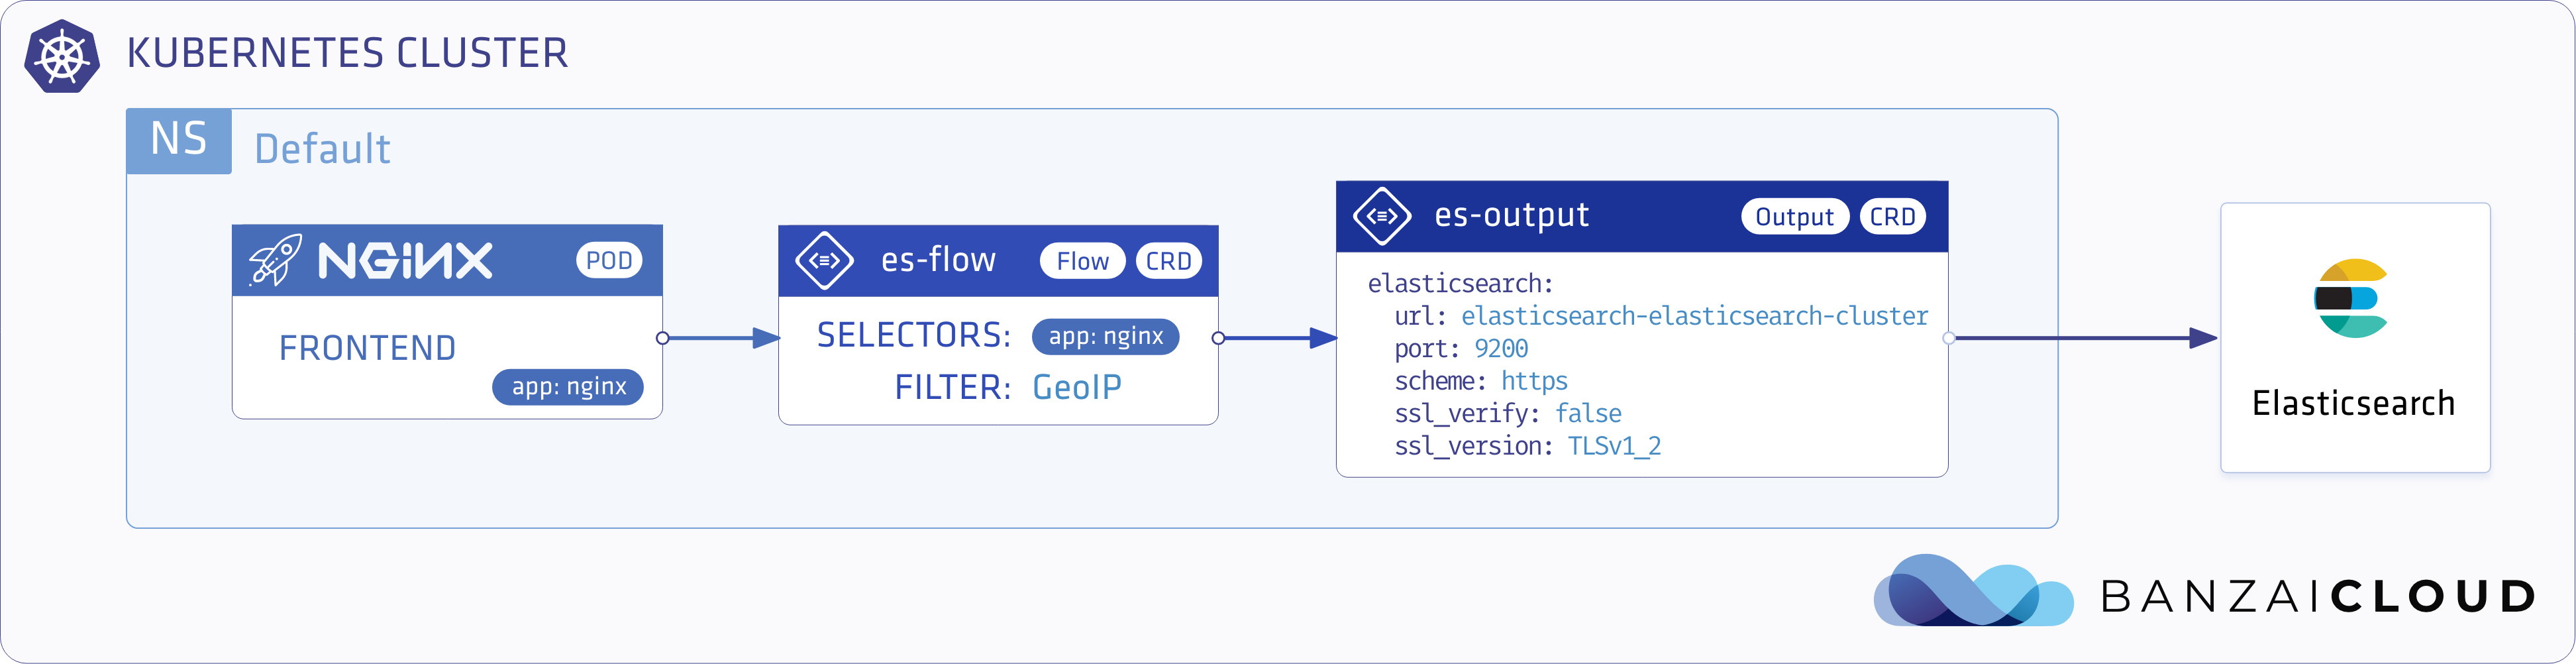
The architecture involved in this exercise is relatively simple. We’re going to use a log generator to imitate nginx instances. These will be our log producers. Then we’ll move on and install Elasticsearch with Kibana. Finally, we’ll install the logging operator, and configure an Elasticsearch Output and a Flow to filter nginx logs and attach GeoIP data.
Provision a cluster 🔗︎
You can use any Kubernetes cluster above version 1.13, or you can use the free hosted developer version of our Pipeline platform to create a Kubernetes cluster in minutes (across any one of five cloud providers). If you’re not familiar with Pipeline, a good place to start is with our cluster creation guidelines!
Install Elasticsearch 🔗︎
Today we’ll be using UPMC’s Elasticsearch operator to install Elasticsearch, Cerebro and Kibana into the cluster. Note that we install the operator in the logging namespace.
Add the Helm repository
helm repo add es-operator https://raw.githubusercontent.com/upmc-enterprises/elasticsearch-operator/master/charts/
helm repo update
Install Elasticsearch Operator
helm install --namespace logging --name es-operator es-operator/elasticsearch-operator --set rbac.enabled=True
Install Elasticsearch stack
helm install --namespace logging --name es es-operator/elasticsearch --set kibana.enabled=True --set cerebro.enabled=True
Verify installation
You should see the Elasticsearch cluster pods.
kubectl get po -n logging
NAME                                        READY   STATUS    RESTARTS   AGE
cerebro-es-cluster-d466677fb-fw7p4          1/1     Running   0          110s
elasticsearch-operator-59ffdc9cf6-4n92l     1/1     Running   0          3m29s
es-client-es-cluster-65995496cd-w8g4n       1/1     Running   0          111s
es-data-es-cluster-default-0                1/1     Running   0          110s
es-master-es-cluster-default-0              1/1     Running   0          110s
kibana-es-cluster-58dbd44fbb-d8zjq          1/1     Running   0          110s
Mappings and templates 🔗︎
Elasticsearch supports several types of fields. To apply functions in fields you need to first define the type being used.
“Mapping is the process of defining how a document, and the fields it contains, are stored and indexed.”
Mapping makes it possible to perform arithmetic operations or, as in our case, mark fields as coordinates. You can read more about varieties of mapping in the official documentation
Keep in mind that it’s common practice to use the logstash format when ingesting data into Elasticsearch. That way indexes can be easily rotated, and queried on a daily basis. In our example, the index names look like this: nginx_access-2019.10.12.
Logstash format means Fluentd uses the conventional index name format
prefix-%Y.%m.%d
Because we want to define mappings for all nginx_access-* formatted indices, we have to create a template that applies to them.
To access Elasticsearch you can use kubectl port-forward
kubectl port-forward svc/elasticsearch-es-cluster 9200 -n logging
POST the template to the Elasticsearch API
curl -v -k -X PUT -H "Content-Type: application/json" https://localhost:9200/_template/nginx_template -d '{
  "index_patterns": [
    "nginx_access-*"
  ],
  "settings": {
    "number_of_shards": 1
  },
  "mappings": {
    "nginx": {
      "properties": {
        "@timestamp": {
          "type": "date"
        },
        "code": {
          "type": "integer"
        },
        "location_array": {
          "type": "geo_point"
        },
        "size": {
          "type": "integer"
        }
      }
    }
  }
}'
With the snippet above you apply all nginx_access-* formatted logs to the following type definitions.
| Name | Type | Descriptions |
|---|---|---|
| Code | integer | Response code as numbers. |
| Size | integer | Request sizes as bytes. We can calculate Min, Max, Average etc |
| Location | Geo point | Place markers on a map |
Be careful! If you ingest logs before adding their mapping template to Elasticsearch, it will throw an error because of the conflicting mapping types. This is due to the fact that, if there is no mapping, Elasticsearch will generate one.
2019-10-04 13:53:12 +0000 [warn]: #0 dump an error event: error_class=Fluent::Plugin::ElasticsearchErrorHandler::ElasticsearchError error="400 - Rejected by Elasticsearch" location=nil tag="default.nginx-deployment-7cb4dfcfff-c5j6n.nginx"
 time=2019-10-04 13:52:52.000000000 +0000 record={"stream"=>"stdout", "logtag"=>"F", "kubernetes"=>{"pod_name"=>"nginx-deployment-7cb4dfcfff-c5j6n", "namespace_name"=>"default",
"pod_id"=>"b3d73149-2d7f-4057-b270-5d67d2310f99", "labels"=>{"app"=>"nginx", "pod-template-hash"=>"7cb4dfcfff"}, "host"=>"ip-192-168-72-118.eu-west-1.compute.internal", "container_name"=>"nginx", "docker_id
"=>"ba9c90d71ac3f0ffdf44e0617203109d55af4887bb1597c23395bc0c24e25d28"}, "remote"=>"10.20.192.0", "host"=>"-", "user"=>"-", "method"=>"GET", "path"=>"/", "code"=>"200", "size"=>"612", "referer"=>"-", "agent"=>"kube-probe/1.15", "http_x_forwarded_for"=>"-"}
Install the Logging operator using Helm
helm install banzaicloud-stable/logging-operator --namespace logging --name logging-operator
Install the logging custom resource via Helm
helm install banzaicloud-stable/logging-operator-logging --namespace logging --name logging
Configure the Output for Elasticsearch
cat <<EOF | kubectl apply -f -
apiVersion: logging.banzaicloud.io/v1beta1
kind: Output
metadata:
  name: es-output
spec:
  elasticsearch:
    host: elasticsearch-es-cluster.logging.svc.cluster.local
    port: 9200
    logstash_format: true
    logstash_prefix: nginx_access
    type_name: nginx
    scheme: https
    ssl_verify: false
    ssl_version: TLSv1_2
    buffer:
      timekey: 1m
      timekey_wait: 10s
      timekey_use_utc: true
      flush_thread_count: 8
EOF
Set up the Flow to parse logs and attach GeoIP data
cat <<"EOF" | kubectl apply -f -
apiVersion: logging.banzaicloud.io/v1beta1
kind: Flow
metadata:
  name: es-flow
spec:
  filters:
    - parser:
        key_name: message
        remove_key_name_field: true
        reserve_data: true
        parsers:
          - type: nginx
    - geoip:
        geoip_lookup_keys: remote
        backend_library: geoip2_c
        records:
          - city: ${city.names.en["remote"]}
            location_array: '''[${location.longitude["remote"]},${location.latitude["remote"]}]'''
            country: ${country.iso_code["remote"]}
            country_name: ${country.names.en["remote"]}
            postal_code:  ${postal.code["remote"]}
  selectors:
    app: nginx
  outputRefs:
    - es-output
EOF
Let’s explore this configuration in a little bit more detail:
- The
selectorfield states that these logs only be applied to Pods withnginxlabels. - There are two filters in this flow
- Parser: a pretty straightforward parsing nginx access log
- GeoIP: which looks up location info in the
geoip_lookup_keysfield, and attaches data as defined in therecordssection.
- And, last but not least, the Elasticsearch output reference
To imitate nginx logs, we created a small demo app to generate them for us. (This is much easier than simulating calls from several continents)
Example application to generate randomized log events
cat <<EOF | kubectl apply -f -
apiVersion: apps/v1
kind: Deployment
metadata:
  name: nginx-deployment
spec:
  selector:
    matchLabels:
      app: nginx
  replicas: 2
  template:
    metadata:
      labels:
        app: nginx
    spec:
      containers:
      - name: nginx
        image: banzaicloud/loggen:latest
EOF
After a few minutes we should see logs in our Kibana deployment!
Using port-forward to access Kibana
kubectl -n logging port-forward svc/kibana-es-cluster 5601:80
After setting up port-forwarding, we can open https://localhost:5601 in a browser, and follow the instruction to initialise the nginx index.
Configure the World Map
- Go to the
Visualizemenu andaddnew visualisation. - Select
Coordinate Mapand choose thenginx_access-*index. - In the new menu select
Geo CoordinatesandGeohashaggregation. - Choose the
location_arrayfield, and click on thePlaybutton at the top.
And that’s how you can create your very own location map based on nginx logs.
Thanks for reading. You should now be able to parse, transform and display access logs with geolocation data. Make sure to keep tabs on us as we continue to add more features. Remember, it’s the contributions and feedback of passionate users and customers like you that makes the Pipeline community different.
About Banzai Cloud Pipeline 🔗︎
Banzai Cloud’s Pipeline provides a platform for enterprises to develop, deploy, and scale container-based applications. It leverages best-of-breed cloud components, such as Kubernetes, to create a highly productive, yet flexible environment for developers and operations teams alike. Strong security measures — multiple authentication backends, fine-grained authorization, dynamic secret management, automated secure communications between components using TLS, vulnerability scans, static code analysis, CI/CD, and so on — are default features of the Pipeline platform.