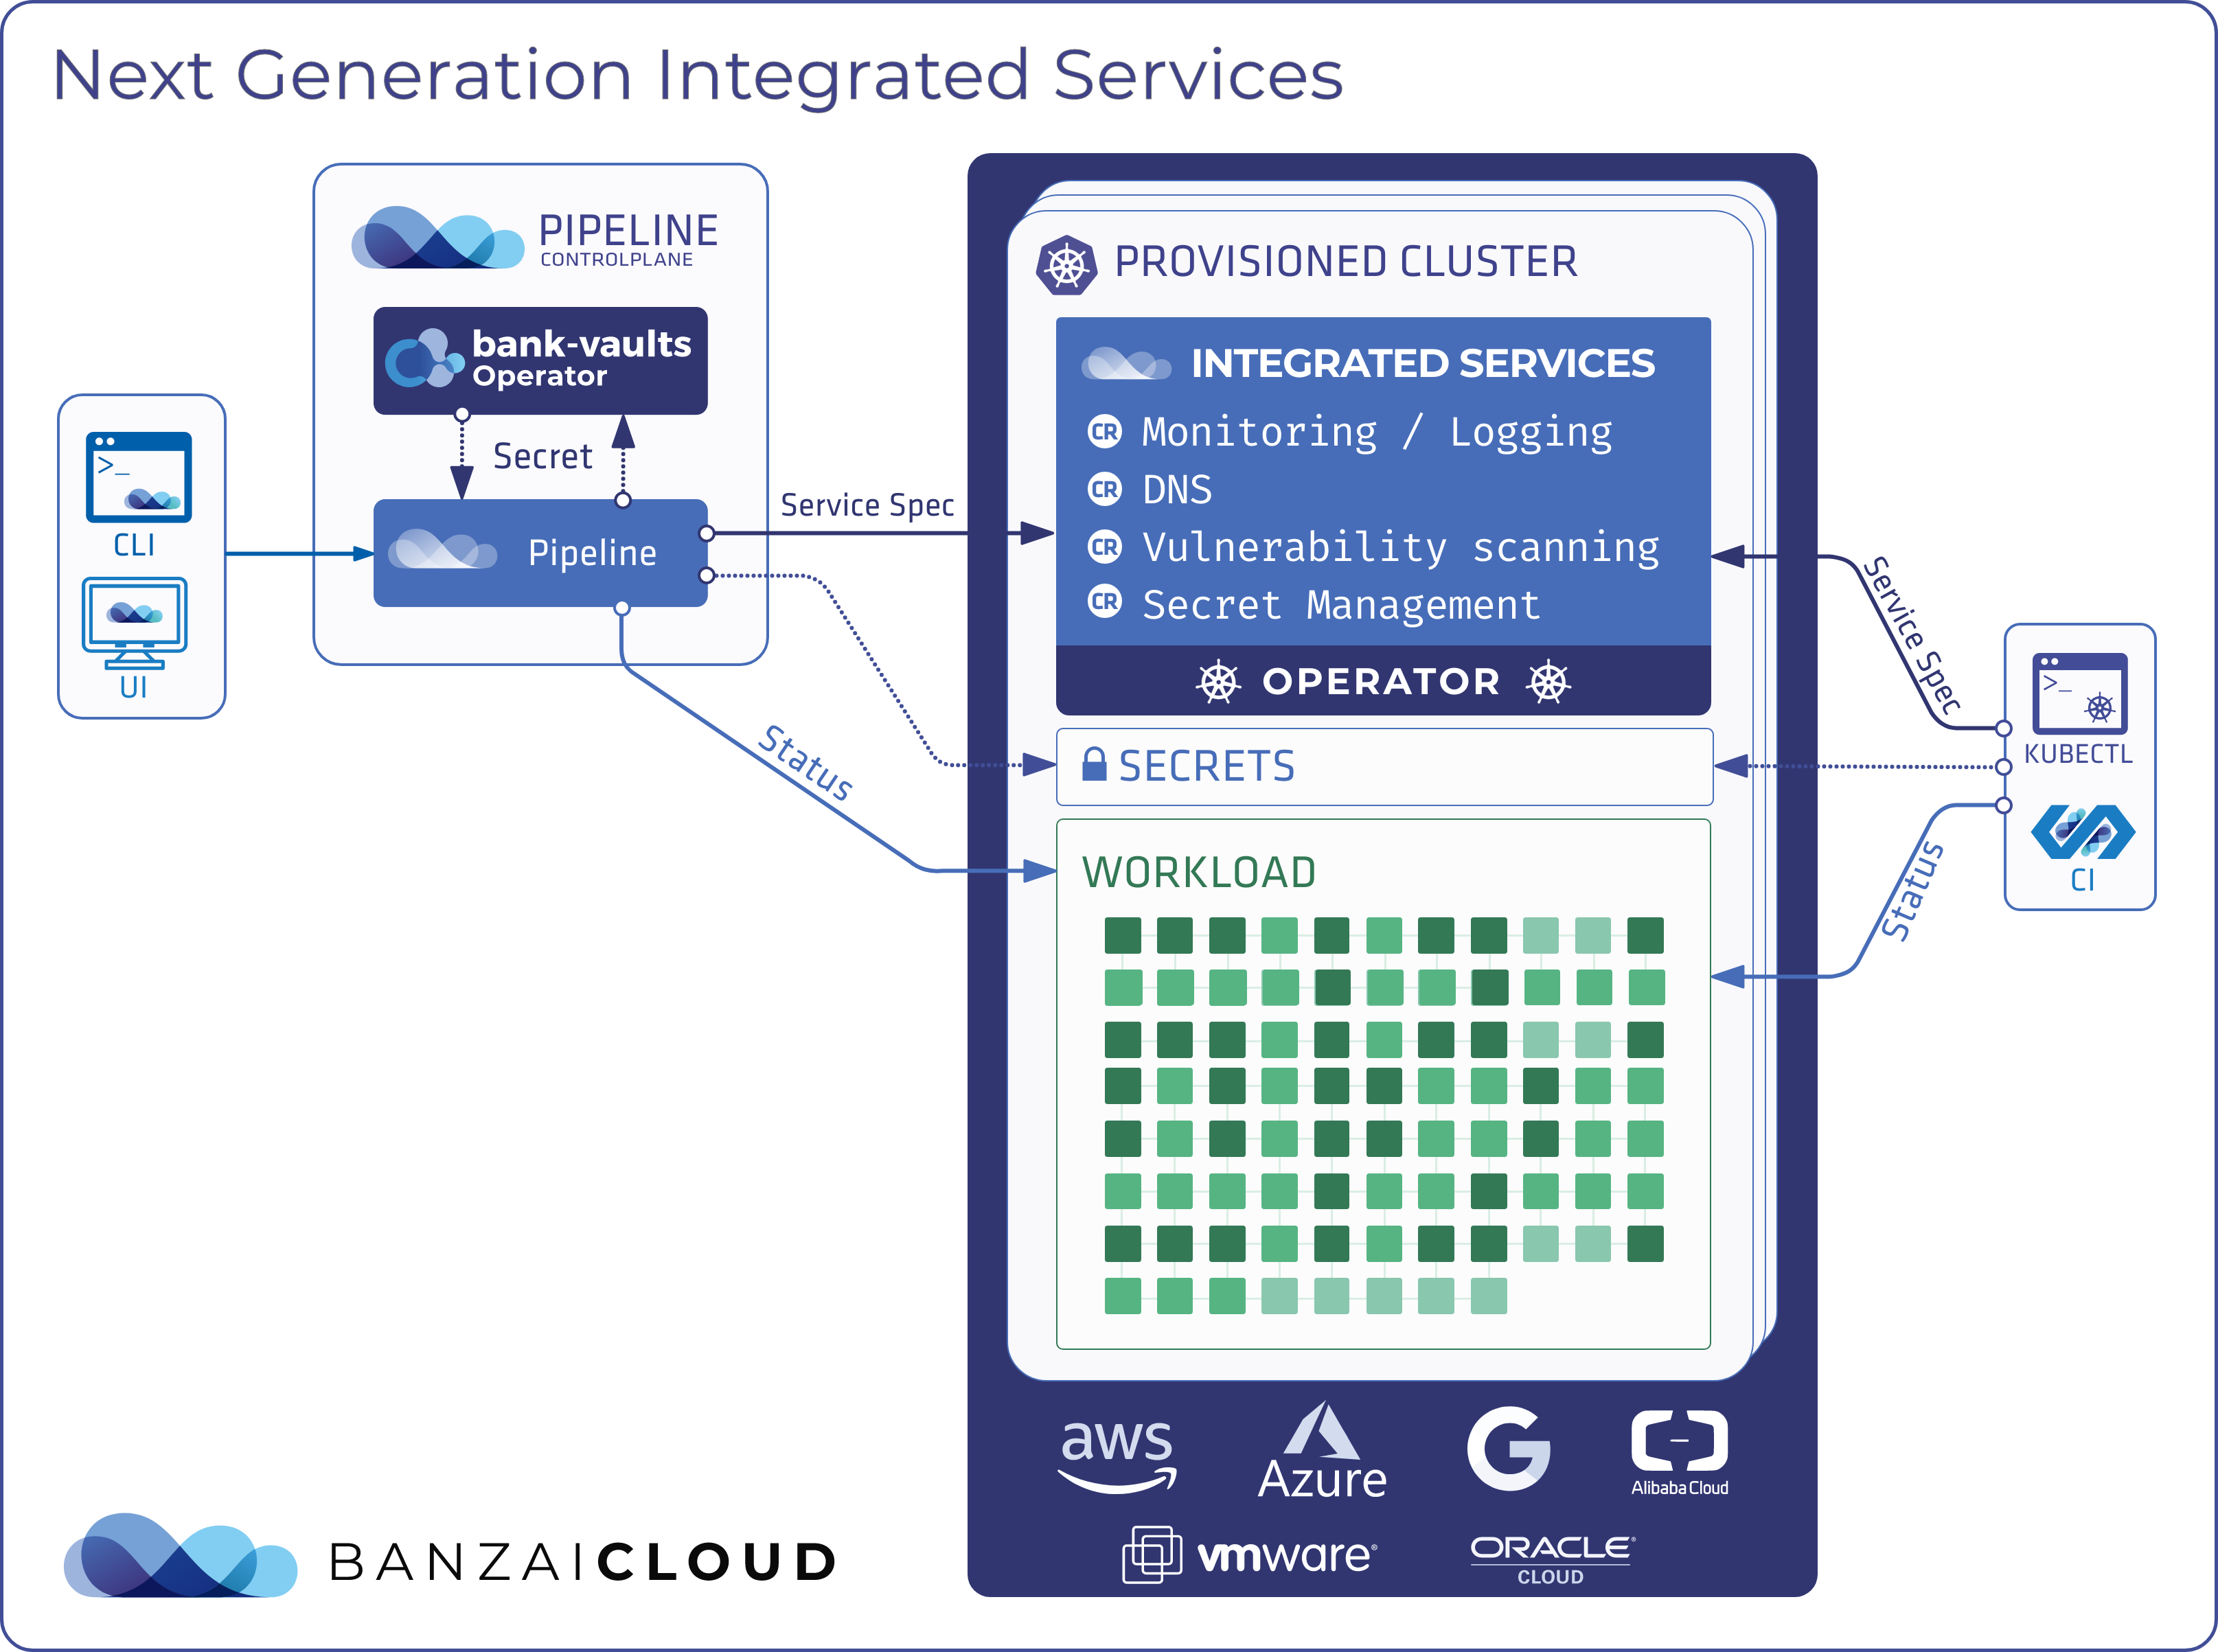


Frequent readers of our blog and users of our hybrid cloud container management platform, Pipeline, will be familiar with the integrated cluster services that come with it. These services are automated end-to-end solutions for centralized logging, federated monitoring, security scans, advanced credential management, autoscaling, registries and lots more (see, for example, automated DNS management for Kubernetes).
Providing an automated logging solution, and making sure it works seamlessly across multiple clusters, has always been part of Pipeline. This is made possible with our highly popular, open source logging-operator. As the numbers of clusters that we manage with Pipeline (and their sizes) grew into the hundreds, the size of their logs grew along with them. Now we have clusters from which we extract 2TB of logs, daily. The question that naturally arises from this is how large a logging system (and the Fluent ecosystem managed by the logging-operator) has to be, in order to meet these requirements.

tl;dr: 🔗︎
- Basic requirements were:
- an in-cluster monitoring solution
- separate log flows per customer
- average throughput of 1.5+ TB per day (17.5MB/sec or 100K+ events/sec)
- linear scale
- Create a logging flow with the logging-operator
- Make a load generator and load the system
- These values are derived from log-generator metrics:
- Average emit/s
- Average byte/s
- Total bytes sent
- Total events sent
- Total event in 24h
- Total bytes in 24h
Now let’s really dig into this process, starting by setting up the environment.
Set up the environment 🔗︎
You can use Pipeline to set up a Kubernetes cluster on 5 cloud providers, on-premise data centers (VMware and bare metal) or a hybrid cloud combination of all of the above. Once you have a cluster ready, you can proceed by installing its individual components.
For our tests we simulated 20 heavy load log sources on Amazon, running our own CNCF certified Kubernetes distribution, PKE.
Install the Prometheus Operator 🔗︎
To monitor the logging subsystem - business as usual with Pipeline - we use Prometheus.
Deploy prometheus-operator via Helm
helm install --namespace logging --name monitor stable/prometheus-operator \
    --set "grafana.dashboardProviders.dashboardproviders\\.yaml.apiVersion=1" \
    --set "grafana.dashboardProviders.dashboardproviders\\.yaml.providers[0].orgId=1" \
    --set "grafana.dashboardProviders.dashboardproviders\\.yaml.providers[0].type=file" \
    --set "grafana.dashboardProviders.dashboardproviders\\.yaml.providers[0].disableDeletion=false" \
    --set "grafana.dashboardProviders.dashboardproviders\\.yaml.providers[0].options.path=/var/lib/grafana/dashboards/default" \
    --set "grafana.dashboards.default.logging.gnetId=7752" \
    --set "grafana.dashboards.default.logging.revision=3" \
    --set "grafana.dashboards.default.logging.datasource=Prometheus" \
    --set "prometheus.prometheusSpec.serviceMonitorSelectorNilUsesHelmValues=False"
Note: The prometheus-operator installation may take awhile, so please be patient.
Install the logging-operator 🔗︎
If you are not familiar with the logging-operator, please read our introductory blog post.
Add the Banzai Cloud chart repository
helm repo add banzaicloud-stable https://kubernetes-charts.banzaicloud.com
Install the logging-operator Chart
helm install --namespace logging --name logging banzaicloud-stable/logging-operator
Install the logging resources 🔗︎
Create a logging resource 🔗︎
kubectl -n logging apply -f - <<"EOF"
apiVersion: logging.banzaicloud.io/v1beta1
kind: Logging
metadata:
  name: default-logging-simple
spec:
  fluentd:
    metrics:
      serviceMonitor: true
  fluentbit:
    metrics:
      serviceMonitor: true
  controlNamespace: logging
EOF
Create an AWS secret 🔗︎
If you have your $AWS_ACCESS_KEY_ID and $AWS_SECRET_ACCESS_KEY set you can use the following snippet.
kubectl -n logging create secret generic logging-s3 --from-literal "accesskey=$AWS_ACCESS_KEY_ID" --from-literal "secretkey=$AWS_SECRET_ACCESS_KEY"
Or set up the secret manually.
kubectl -n logging apply -f - <<"EOF"
apiVersion: v1
kind: Secret
metadata:
  name: logging-s3
type: Opaque
data:
  accesskey: <base64encoded>
  secretkey: <base64encoded>
EOF
You MUST install the
secretand theoutputdefinition in the SAME namespace
Create an output definition 🔗︎
kubectl -n logging apply -f - <<"EOF"
apiVersion: logging.banzaicloud.io/v1beta1
kind: Output
metadata:
  name: demo-output
spec:
  s3:
    aws_key_id:
      valueFrom:
        secretKeyRef:
          key: accesskey
          name: logging-s3
    aws_sec_key:
      valueFrom:
        secretKeyRef:
          key: secretkey
          name: logging-s3
    buffer:
      timekey: 1m
      timekey_use_utc: true
      timekey_wait: 0s
    force_path_style: "true"
    path: logs/${tag}/%Y/%m/%d/
    s3_bucket: banzailoggingdemo
    s3_region: us-west-1
EOF
Create a flow resource 🔗︎
kubectl -n logging apply -f - <<"EOF"
apiVersion: logging.banzaicloud.io/v1beta1
kind: Flow
metadata:
  name: demo-flow
spec:
  filters:
    - tag_normaliser: {}
    - parser:
        remove_key_name_field: true
        reserve_data: true
        parsers:
          - type: nginx
  selectors:
    app.kubernetes.io/instance: nginx-demo
    app.kubernetes.io/name: nginx-logging-demo
  outputRefs:
    - demo-output
EOF
Generate workload 🔗︎
We’ve written a handy tool to generate logs extremely rapidly. For now it generates nginx access logs, which is a common web server on Kubernetes and is therefore a good choice for testing.
The tool is available on the Banzai Cloud Docker hub repo: banzaicloud/log-generator:0.3.2 and, after some code cleanup, we’ll opensource it.
log-generator arguments
[~]$ docker run --rm -it banzaicloud/log-generator:0.3.2 --help
Usage of /loggen:
  -byte-per-sec int
    	The amount of bytes to emit/s (default 200)
  -count int
    	The amount of log message to emit.
  -event-per-sec int
    	The amount of log message to emit/s (default 2)
  -metrics.addr string
    	Metrics server listen address (default ":11000")
  -randomise
    	Randomise log content (default true)
There are two important (and mutually exclusive) options:
- the
byte-per-seccalculates the rate of event sending based on average log size - the
event-per-secsets the event sending rate
Note, by default, the tool randomizes log outputs, but this method is compute heavy. You can turn this off for higher throughput.
Metrics from the generator 🔗︎
To correlate metrics we integrated Prometheus endpoint metrics into the tool. Later, we’ll be able to easily aggregate this data at query time.
eventEmitted = promauto.NewCounter(prometheus.CounterOpts{
		Name: "loggen_events_total",
		Help: "The total number of events",
	})
	eventEmittedBytes = promauto.NewCounter(prometheus.CounterOpts{
		Name: "loggen_events_total_bytes",
		Help: "The total number of events",
	})
It’s worth mentioning that from a mere two metrics - loggen_events_total and loggen_events_total_bytes - we can derive several useful piece of information:
- Total events sent = loggen_events_total
- Total bytes sent = loggen_events_total_bytes
- Average emit/s = rate(loggen_events_total[1m])
- Average byte/s = rate(loggen_events_total_bytes[1m])
- Total event in 24h = rate(loggen_events_total[1m]) * 86400
- Total bytes in 24h = rate(loggen_events_total_bytes[1m]) * 86400
Install the log generator deployment 🔗︎
This is an example deployment for log generator.
You can use the args section to provide more command line options.
kubectl -n logging apply -f - <<"EOF"
apiVersion: apps/v1
kind: Deployment
metadata:
  name: nginx-deployment
spec:
  selector:
    matchLabels:
      app: nginx
  replicas: 1
  template:
    metadata:
      labels:
        app: nginx
    spec:
      containers:
      - name: nginx
        image: banzaicloud/log-generator:0.3.2
        command:
        - /loggen
        args:
        - --event-per-sec=10
EOF
Dashboards 🔗︎
Who doesn’t love dashboards? Well, we do, so let’s take a look at some interesting ones! Let’s open Grafana!
Grab your Grafana login credentials.
kubectl get secret --namespace logging monitor-grafana -o jsonpath="{.data.admin-password}" | base64 --decode ; echo
Default username: admin
Forward the Service
kubectl -n logging port-forward svc/monitor-grafana 3000:80
Open the Grafana dashboard: http://localhost:3000
Log generator metrics
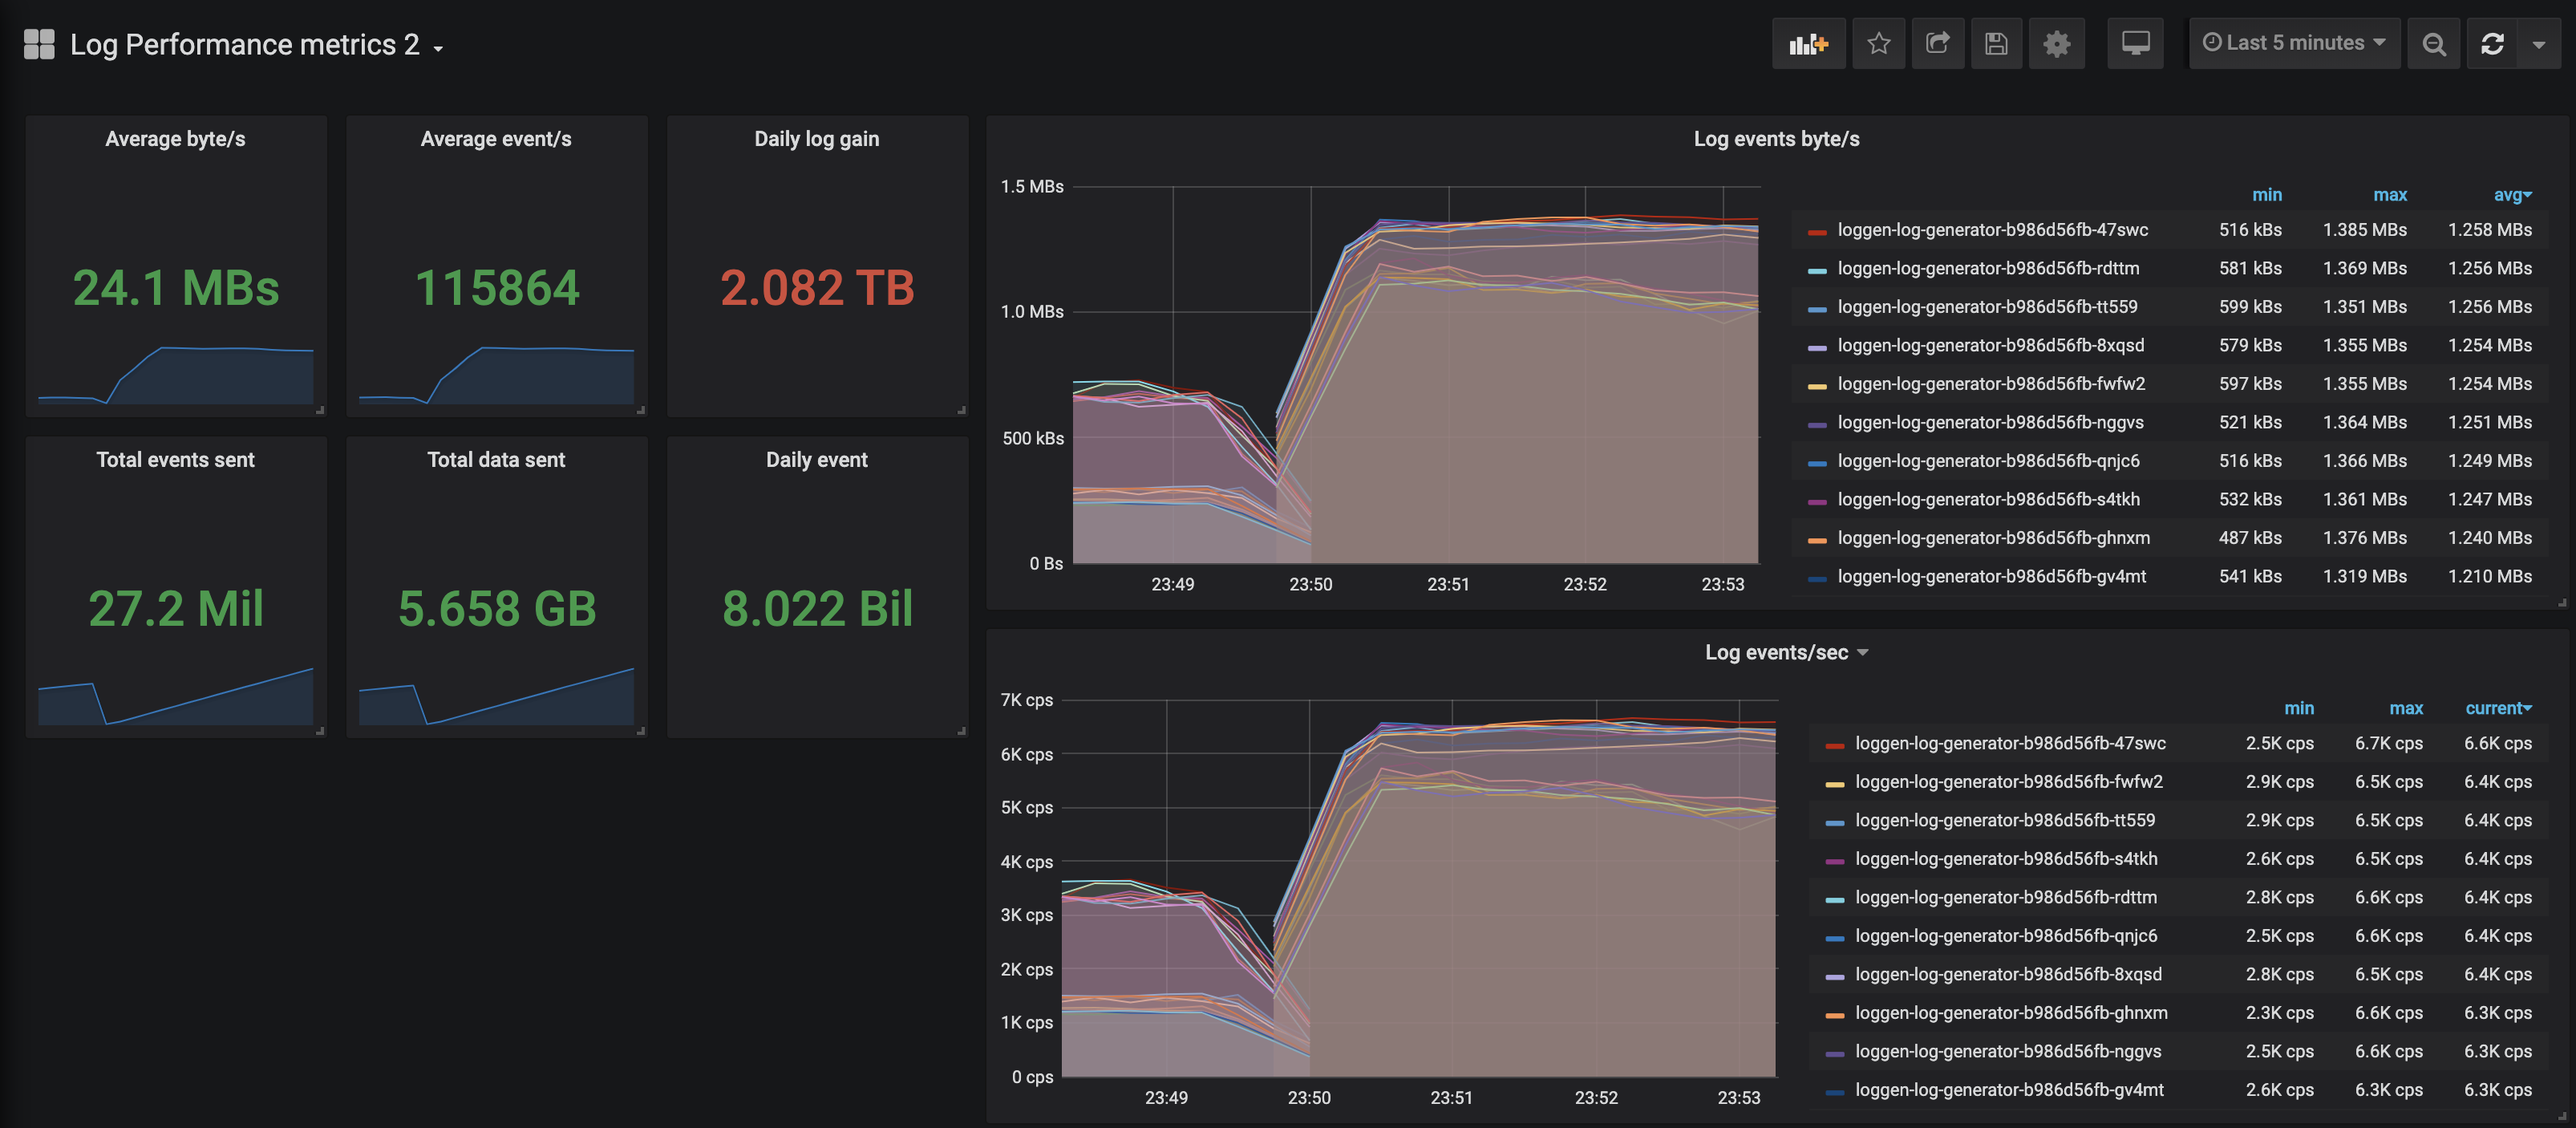
The first dashboard is about log generators.
You can see the loggen_events_total and loggen_events_total_bytes and it’s derivated metrics.
Fluentd metrics
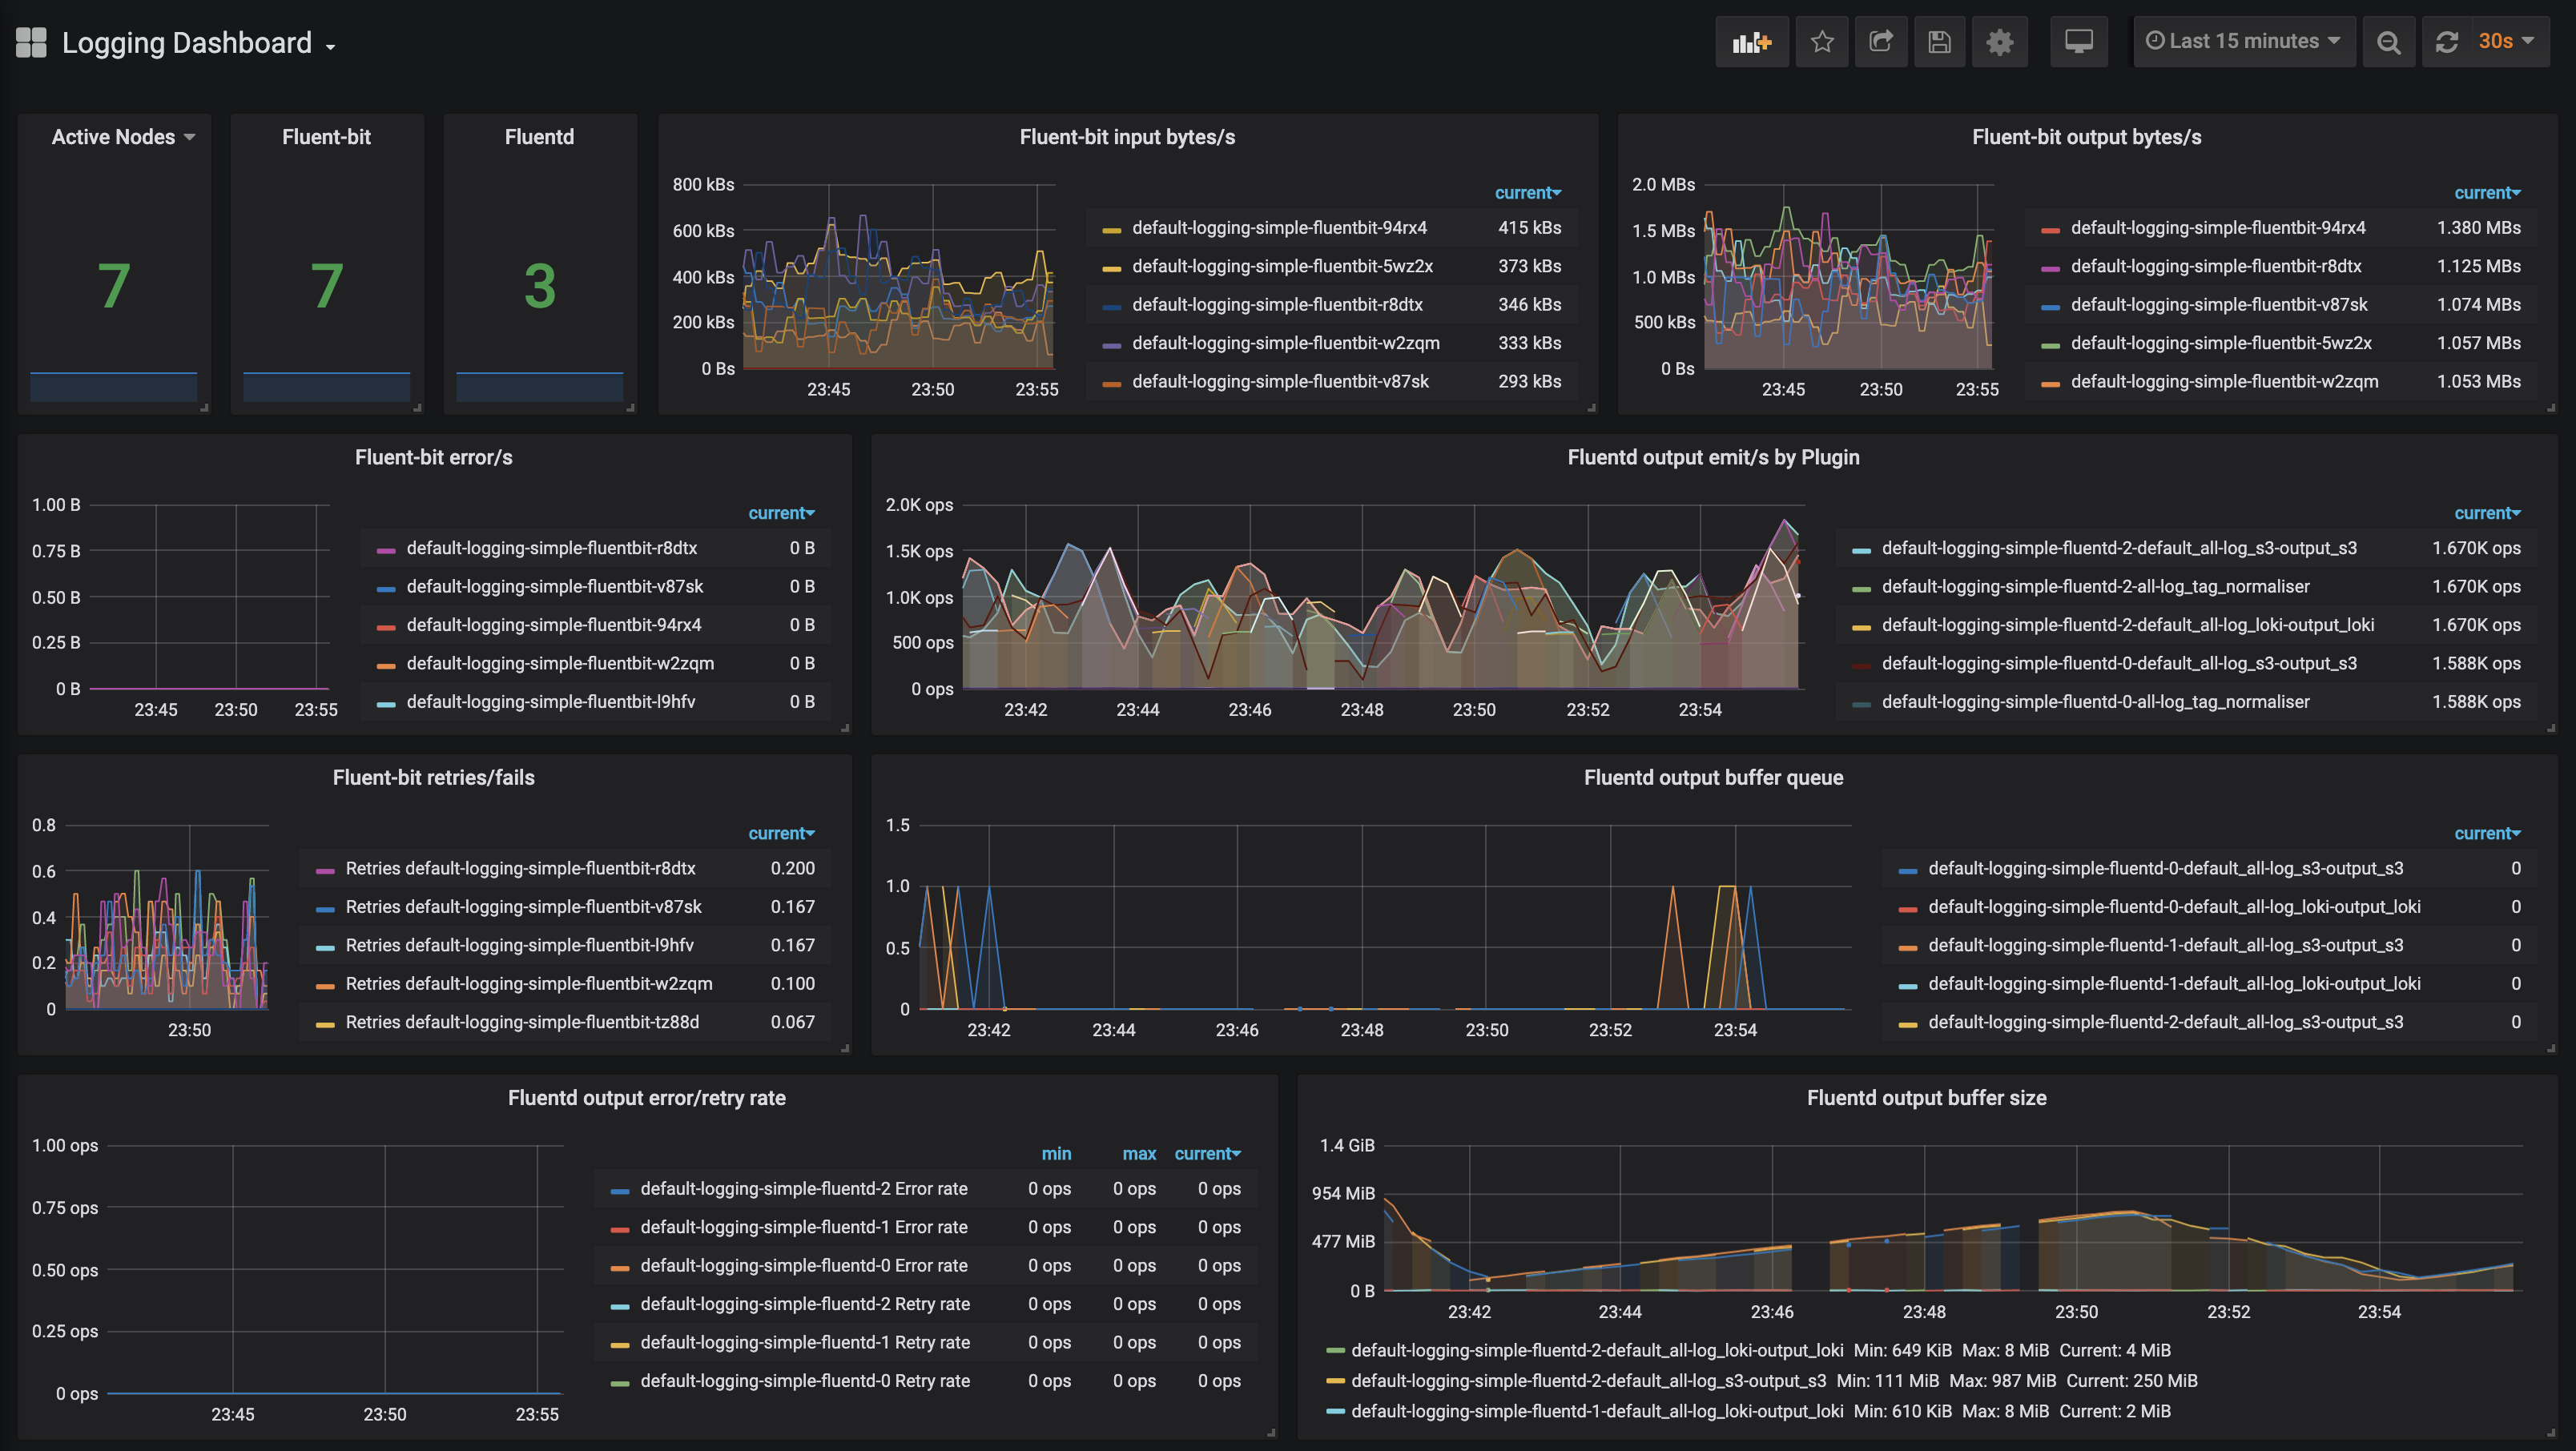
Statistics and Conclusions 🔗︎
Since both fluent-bit and fluend provide lots of useful metrics, we’ll take a look at how the logging system performs under a high load. Let’s dig into some of the highlights of this dashboard:
-
The fluentd output buffer size shows the amount of disk space necessary for respective buffering outputs. In order not to lose logs, it’s important that the
bufferdirectory should be on persisted volumes and have enough space to operate properly. -
If the
buffer sizeis always growing, or if thebuffer queueis crowded, we can increase the number of fluentd instances. We can do that because fluent-bit chooses fluentd endpoints via a round-robin methodology. -
Missing parts of
buffer sizegraph indicate that fluentd is under a heavy load, and serving a metrics endpoint that’s timed out. Again, scaling fluentd helps release pressure, but this test was intended to push those limits. -
The fluent-bit (and fluentd) retry rates indicate transportation problems between fluent-bit (or fluentd) destination. A low retry rate should not cause any problems. However, failures (and errors) can cause log loss so be careful there. As you can see, there’s a lot of information (and alerts) that can be read from this simple dashboard. That information will help you calibrate a system for your workload and effectively eliminate errors and bottlenecks.
As a final conclusion, for all clusters installed and managed with our container management platform, Pipeline, all these above are considered, the logging subsystem is automatically installed and properly sized. Nevertheless, if someone would like to go ahead with the our open source logging-operator, by taking note of the suggestions above that will make sure that the logging system is always performing well.
At Banzai Cloud logging and monitoring goes hand in hand. We are working on a new product called One Eye - the ultimate solution to observe, correlate and identify issues and anomalies within single or across multiple Kubernetes clusters. Built on several open source components (some of our operators, Thanos, Loki, Grafana, the Fluent ecosystem to name a few), our experience of operating and managing large Kubernetes clusters in production with Pipeline, and our desire to automate
everything, One Eye will bring a smooth experience when comes to observability of K8s.
Stay tuned and happy logging!