


Monitoring series:
Monitoring Apache Spark with Prometheus
Monitoring multiple federated clusters with Prometheus - the secure way
Application monitoring with Prometheus and Pipeline
Building a cloud cost management system on top of Prometheus
Monitoring Spark with Prometheus, reloaded
Hands on Thanos
Monitoring Vault on Kubernetes using Cloud Native technologies
In depth application observability is a must-have feature for us; we put significant effort into monitoring all our customers’ Kubernetes deployments on the Pipeline platform, as well as the platform itself. The platform is made up of several components, some of which expose functionality through REST interfaces. To collect more information about how these components behave, we have enabled monitoring for them using Prometheus.
Find the right tools 🔗︎
All our web applications are written in Golang, and we use the Gin Web Framework to implement/expose RESTful APIs. We use Prometheus all across the Pipeline platform, so we needed a metrics exporter that would feed Prometheus from different applications. We wanted to collect general metrics (which are observed by many other web applications) and some proprietary metrics, so we chose to use this library, more specifically a fork of it, which is where we added a small feature to the code that allowed us to get some specific information. This library comes with a generic set of metrics that fits almost all of our needs:
requests_total- HTTP requests processed, partitioned by status code and HTTP methodrequest_duration_seconds- HTTP request latencies in secondsresponse_size_bytes- HTTP response sizes in bytesrequest_size_bytes- HTTP request sizes in bytes
Customize the exporter 🔗︎
By default, the Prometheus exporter library takes into account all path parameters and provides counters. This may lead to the proliferation of metric instances (especially counters in our case). We wanted a bit more control over this, so we left the original behavior as it was and added a feature that makes it possible to configure the parameters taken into account during counting.
E.g. the original behavior, in case of requests_total, generates metrics like the following from URLs of the form http://[host]:[port]/api/v1/providers/ec2/services/eks/regions/us-east-1:
1 # separate counter for every path parameter (provider, service, region)
2 http_requests_total{code="200",host="localhost:9091",method="GET",url="/api/v1/providers/aws/services/eks/regions/us-east-1"} 1
3 http_requests_total{code="200",host="localhost:9091",method="GET",url="/api/v1/providers/aws/services/compute/regions/us-east-1"} 1
4 ...
5
Note that there will be prometheus counter instances for every provider, every service and every region, as well as other path parameters.
With our modification, we can provide a list of “important” path parameters, so the number of counter instances can be reduced, making it possible to focus exclusively on relevant counters.
“Important” parameters can be configured in Prometheus when it’s created:
1 p := ginprometheus.NewPrometheus("http", []string{"provider"})With the above modification, the example url will only generate metrics like:
1 # counters for separate providers only
2 http_requests_total{code="200",host="localhost:9091",method="GET",url="/api/v1/providers/aws/services/:service/regions/:region"} 1
3 http_requests_total{code="200",host="localhost:9091",method="GET",url="/api/v1/providers/azure/services/:service/regions/:region"} 1
4 ...
5
6
(Path parameters not explicitly passed to Prometheus are replaced with their name)
Please note, the information we get using our change can be retrieved with Prometheus queries. The change only reduces the number of metrics and metric values.
Alter the web app’ code by adding monitoring lines 🔗︎
Let’s add the necessary code to the application and enable monitoring. Provided we want to collect the number of a given endpoint, the following steps need to be taken:
Define the metric structs 🔗︎
 1	type Metric struct {
 2    	MetricCollector prometheus.Collector
 3    	ID              string
 4    	Name            string
 5    	Description     string
 6    	Type            string
 7    	Args            []string
 8    }
 9
10    var reqCnt = &Metric{
11    	ID:          "reqCnt",
12    	Name:        "requests_total",
13    	Description: "the number of HTTP requests processed",
14    	Type:        "counter_vec",
15    	Args:        []string{"status"}}
Create a Prometheus client 🔗︎
 1	type Prometheus struct {
 2    	reqCnt        *prometheus.CounterVec
 3    	router        *gin.Engine
 4    	listenAddress string
 5
 6    	Metric      *Metric
 7    	MetricsPath string
 8    }
 9
10    func newPrometheus(subsystem string) *Prometheus {
11    	p := &Prometheus{
12    		Metric:        reqCnt,
13    		MetricsPath:   "/metrics",
14    		listenAddress: ":9901",
15    	}
16
17    	p.registerMetrics(subsystem)
18    	p.router = gin.Default()
19
20    	return p
21    }
22
23    func (p *Prometheus) registerMetrics(subsystem string) {
24		metric := prometheus.NewCounterVec(
25			prometheus.CounterOpts{
26				Subsystem: subsystem,
27				Name:      reqCnt.Name,
28				Help:      reqCnt.Description,
29			},
30			reqCnt.Args,
31		)
32		if err := prometheus.Register(metric); err != nil {
33			log.Infof("%s could not be registered: ", reqCnt, err)
34		} else {
35			log.Infof("%s registered.", reqCnt)
36		}
37		p.reqCnt = metric
38
39		reqCnt.MetricCollector = metric
40    }
Register the handler that collects/exports the desired metric as middleware 🔗︎
 1	// use adds the middleware to a gin engine.
 2    func (p *Prometheus) use(e *gin.Engine) {
 3    	e.Use(p.handlerFunc())
 4    	p.setMetricsPath(e)
 5    }
 6
 7    func (p *Prometheus) handlerFunc() gin.HandlerFunc {
 8    	return func(c *gin.Context) {
 9    		if c.Request.URL.String() == p.MetricsPath {
10    			c.Next()
11    			return
12    		}
13    		c.Next()
14
15    		status := strconv.Itoa(c.Writer.Status())
16    		p.reqCnt.WithLabelValues(status).Inc()
17    	}
18    }
19
20    func (p *Prometheus) setMetricsPath(e *gin.Engine) {
21    	p.router.GET(p.MetricsPath, prometheusHandler())
22    	go p.router.Run(p.listenAddress)
23    }
24
25    func prometheusHandler() gin.HandlerFunc {
26    	h := promhttp.Handler()
27    	return func(c *gin.Context) {
28    		h.ServeHTTP(c.Writer, c.Request)
29    	}
30    }
Initialize Prometheus when the application starts 🔗︎
1		// initialize Prometheus metric
2    	p := newPrometheus("http")
3    	p.use(router)
Examples 🔗︎
Our web applications in which monitoring through Gin is enabled have the following layout:
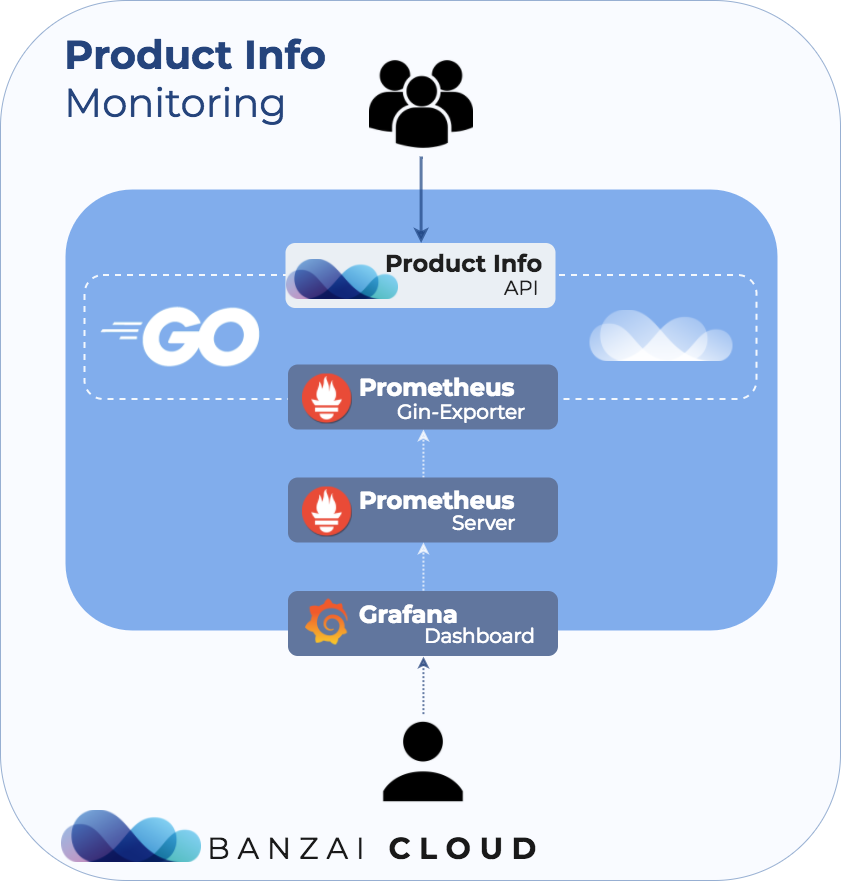
We have enabled monitoring for all of our web applications, and you can check our repositories for more details, here:
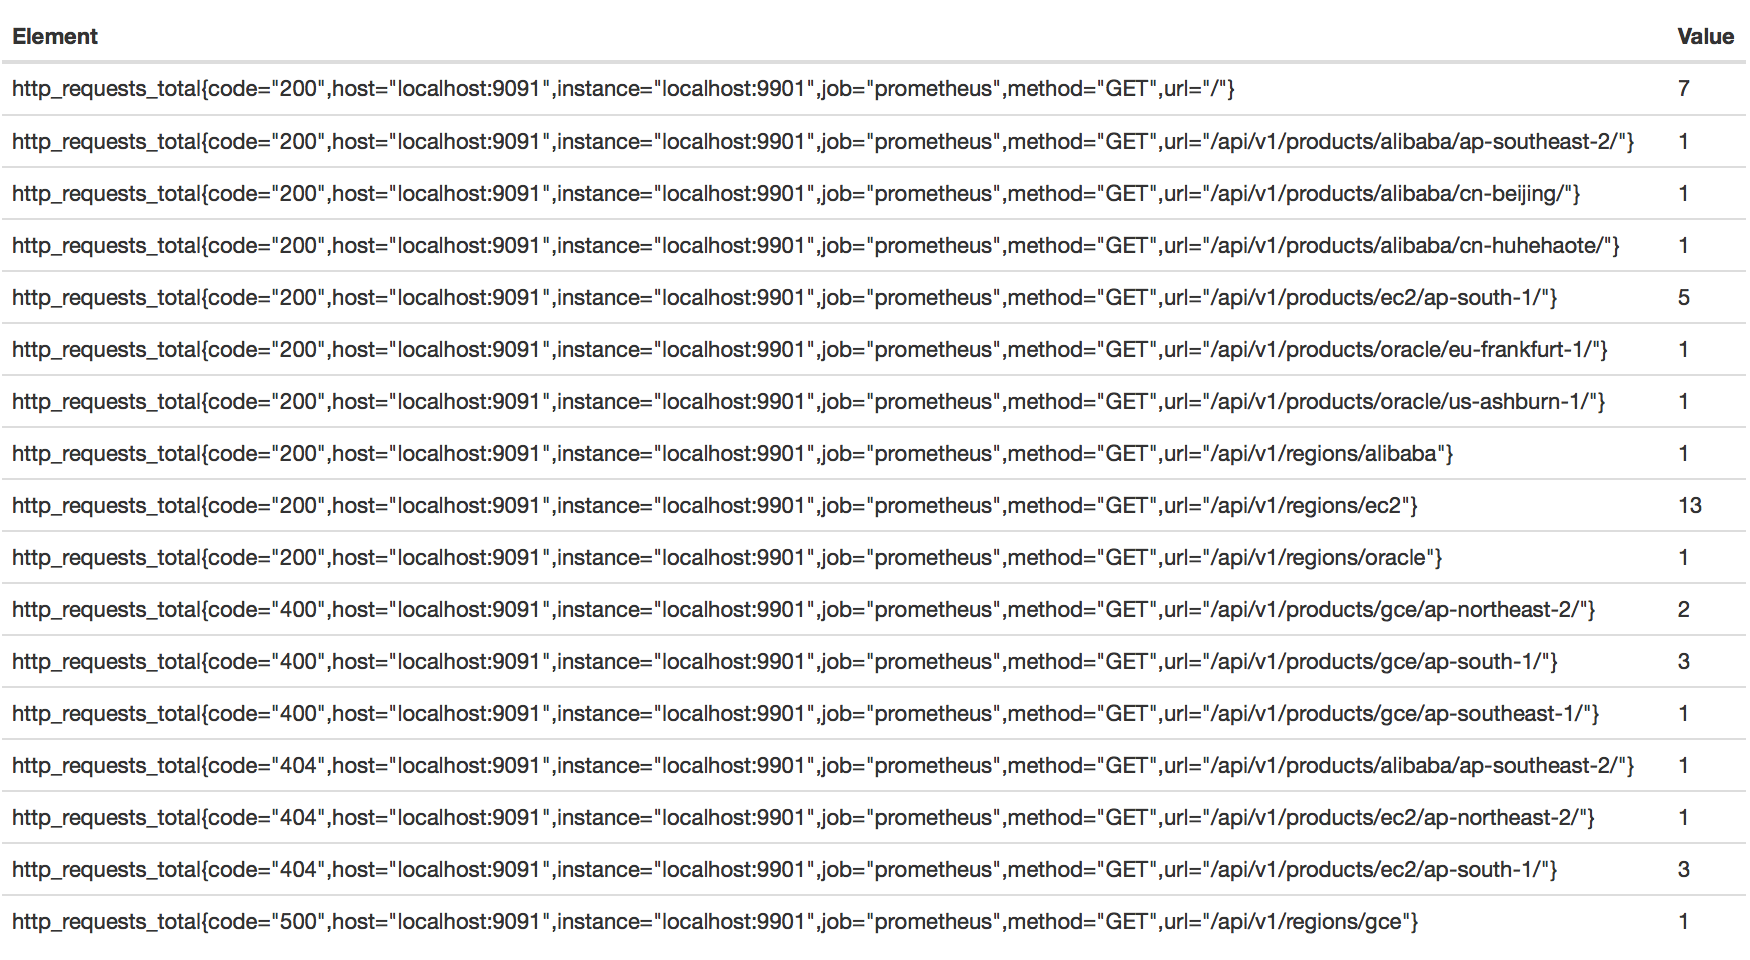
The results on the Prometheus UI look as follows (screenshots are taken from our cloudinfo app):
requests_total metrics from Cloudinfo:
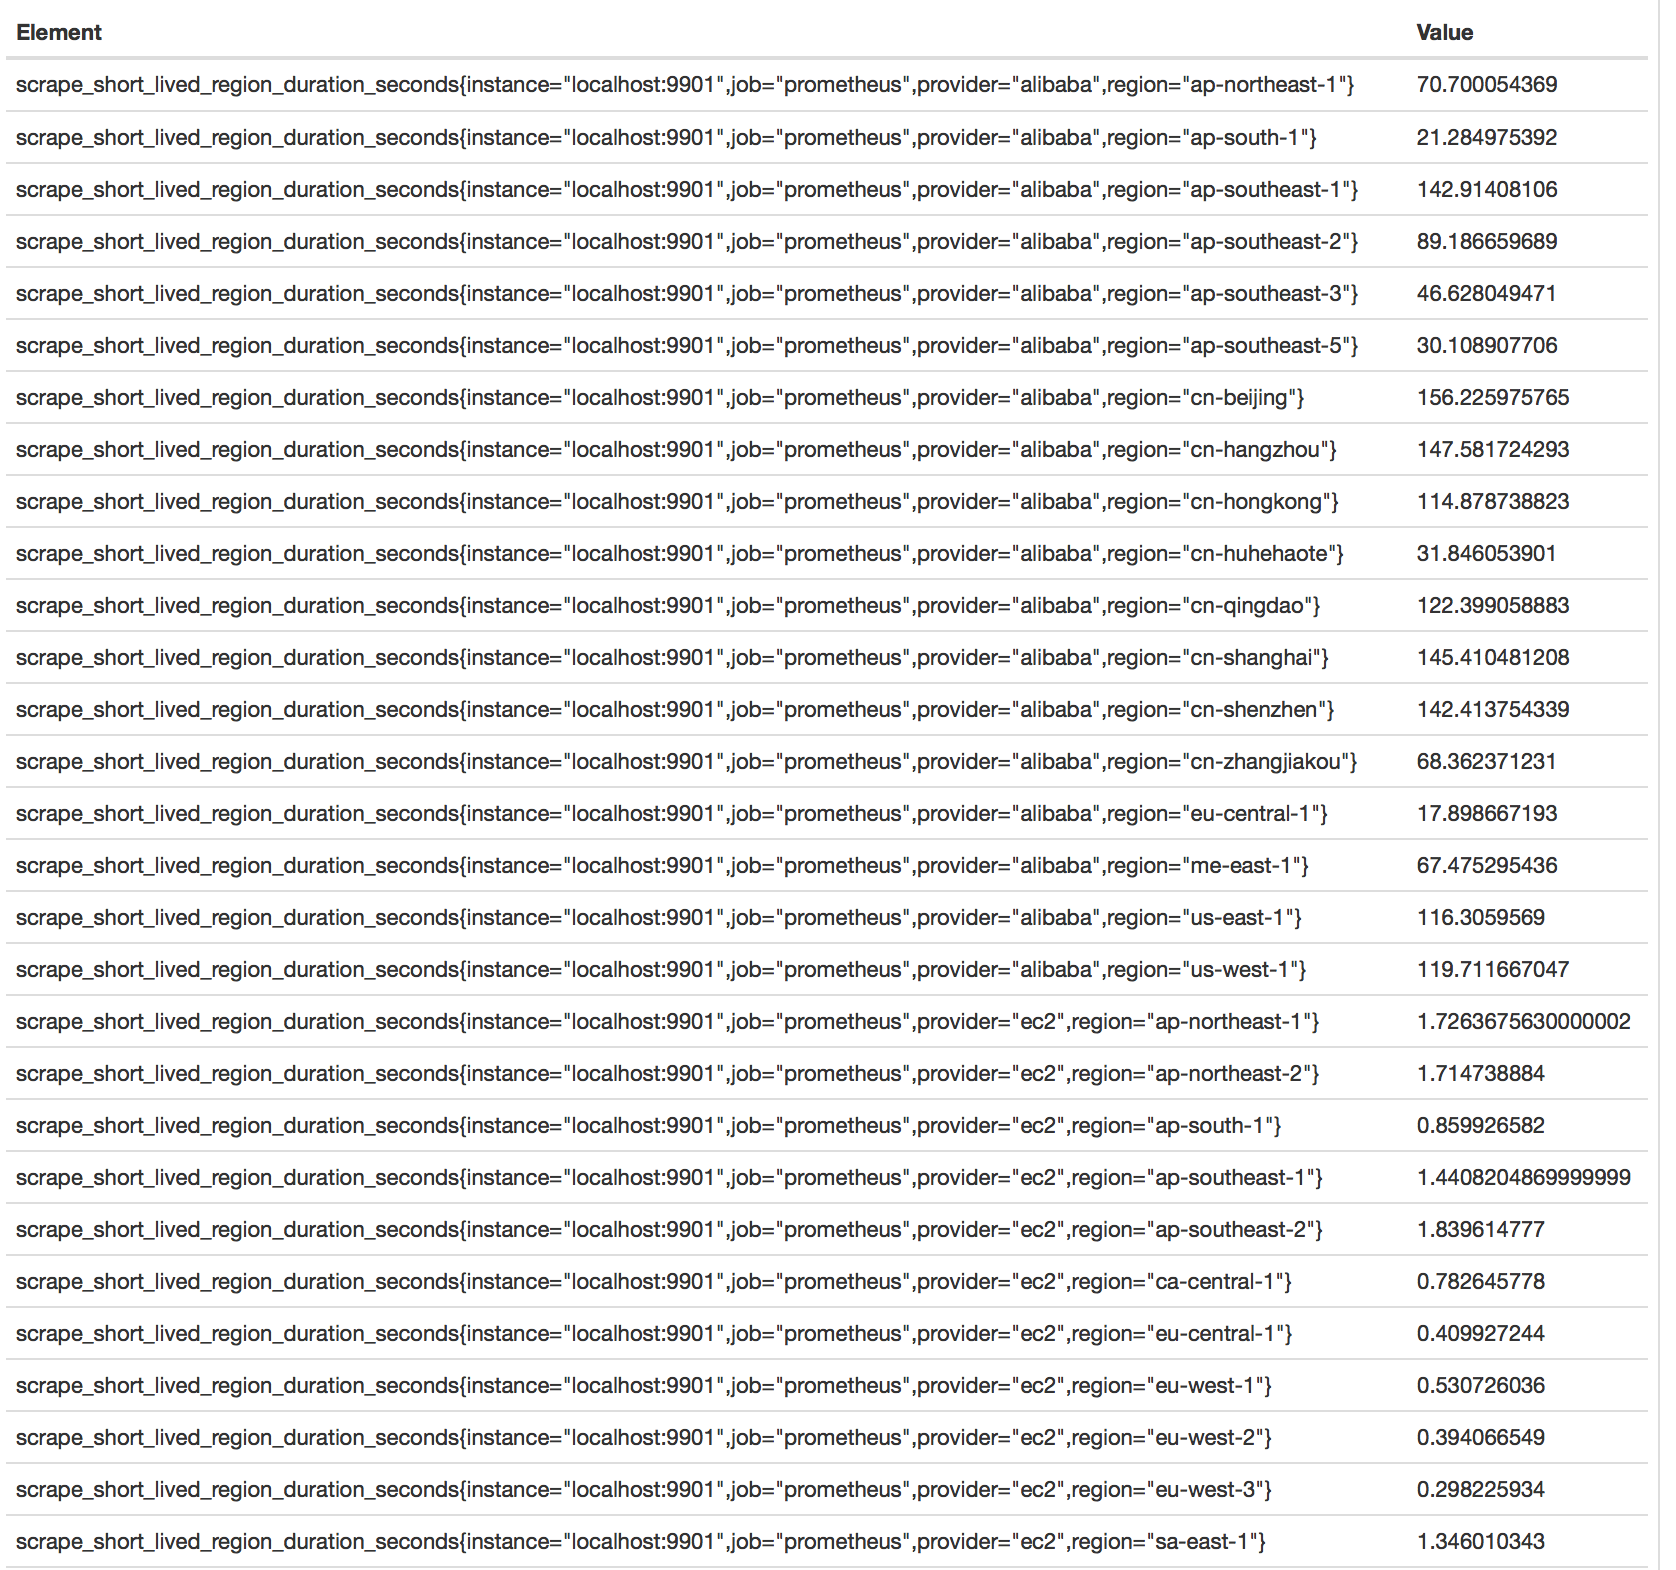
Duration of data collection, or an error when a provider is unavailable:
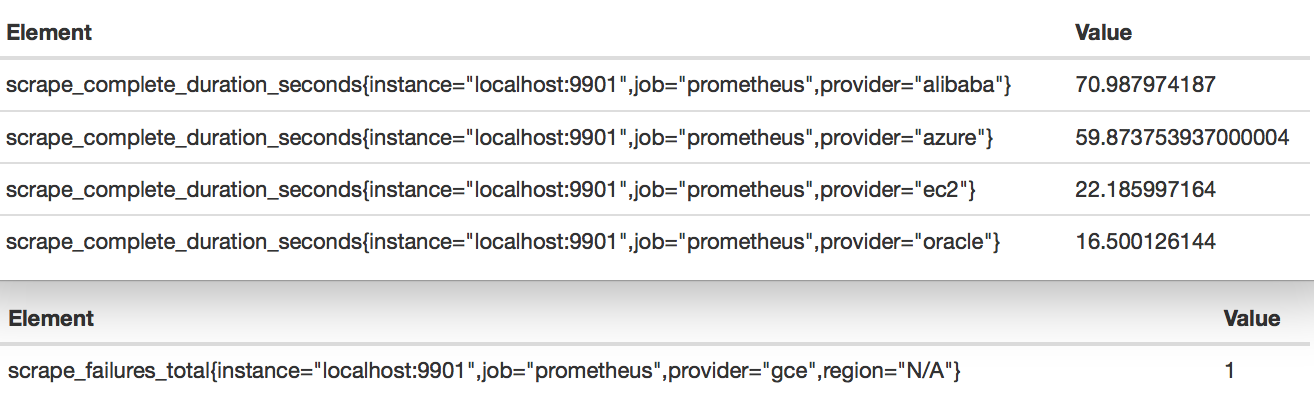
Duration of scraping rapidly changing prices: