


Two core features of the Pipeline platform are advanced security and observability for all Kubernetes deployments. We make sure that all secrets are securely stored, transported, images scanned, deployments monitored, and logs centrally collected. As you might expect from us, we use the industry standard in security components, such as Vault, Prometheus, Grafana, Fluent and more.
This post is about monitoring Vault with Prometheus (on Kubernetes) and displaying metrics on Grafana.
tl;dr: 🔗︎
- You can deploy Vault on Kubernetes using our Bank-Vaults K8s operator, Helm chart or CLI tool
- Bank-Vaults by default installs the statsd Prometheus exporter which annotates the deployment, so that it is ready to be scraped
- Banzai Cloud has open sourced a Grafana dashboard for Vault metrics
- We have added a new exporter to monitor and show Vault’s seal state
Monitoring Vault with Prometheus 🔗︎
We have already standardized secret management within the Pipeline platform on Vault - and we built and open sourced some advanced features on top of that. Follow this link for further details.
Deploy Vault to Kubernetes 🔗︎
The Bank-Vaults project supports several ways - Helm chart, operator, CLI - to deploy Vault on Kubernetes. Once Vault is up and running, we can start monitoring it with Prometheus.
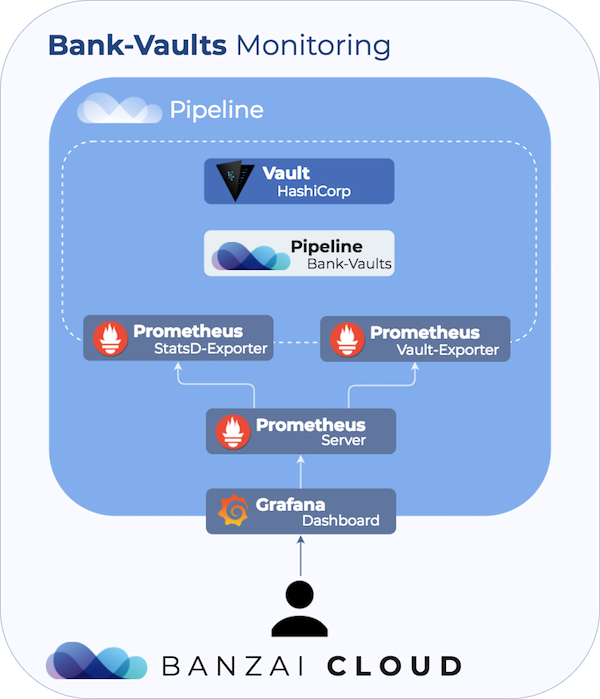
There is a comprehensive guide on monitoring Vault by Hashicorp here, however, this guide is not focused on Vault deployments to Kubernetes and Prometheus. For basic monitoring, Vault is able to push metrics into statsd and Prometheus has a statsd exporter. This exporter is practical to the point of allowing us to scrape metrics using Prometheus. Although this flow covers most metrics, there is some information that it overlooks. For example, it is important to have acesses to Vault’s initialization information, and to know whether it’s in a sealed/unsealed state, or if it’s an active master. In order to facilitate the retrieval of this information, we wrote and opensourced a custom exporter for Bank-Vaults. This exporter is part of the Bank-Vaults project and is enabled by default for all Vault deployments through the Kubernetes Vault operator or Helm chart.
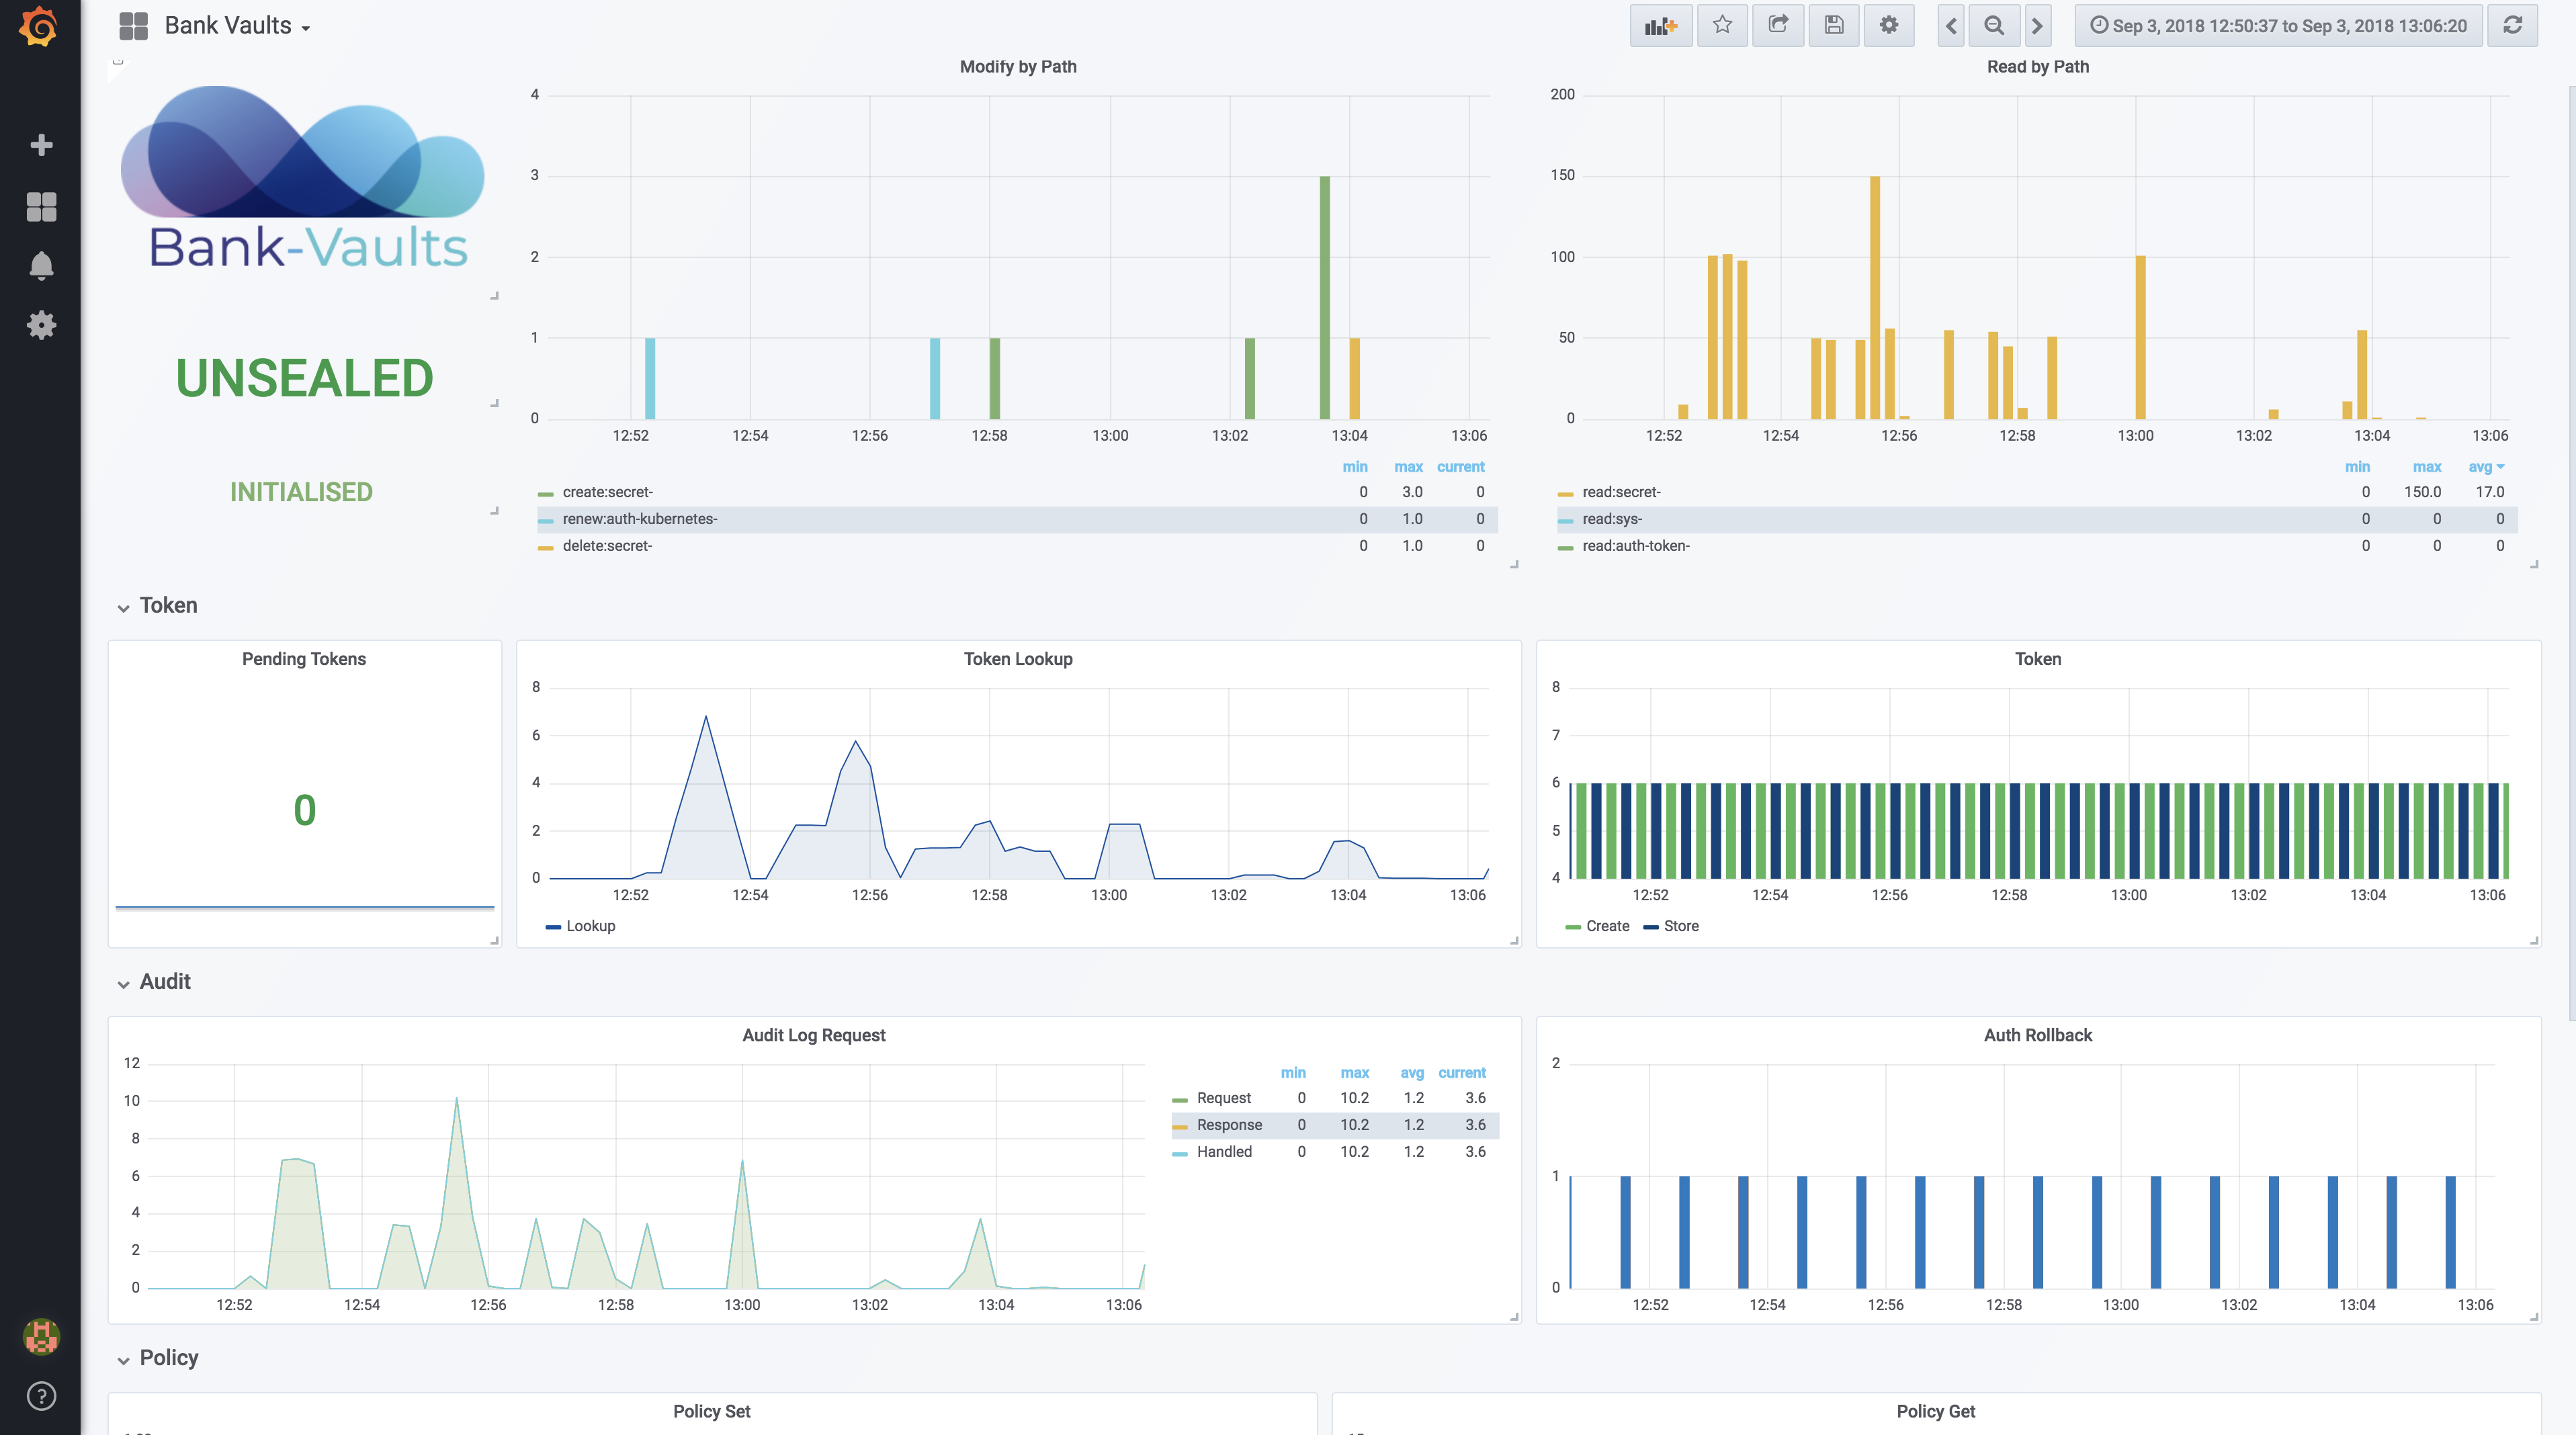
Displaying monitoring information on a dashboard 🔗︎
We have organized all this information in a Grafana dashboard and made it available on the Grafana marketplace in the form of a Banzai Cloud Vault Grafana Dashboard. There exists a wide variety of metrics available from Vault, but we have narrowed them down to their absolute essentials. The monitoring functions are integrated into Pipeline and provide out-of-the-box moitoring via our Banzai Cloud Pipeline cluster monitoring Helm chart (including Prometheus and Grafana) and our logging-operator.
cat <<EOF >> values.json
{
	"dashboardProviders": {
		"dashboardproviders.yaml": {
			"apiVersion": 1,
			"providers": [
				{
					"name": "default",
					"orgId": 1,
					"folder": "",
					"type": "file",
					"disableDeletion": false,
					"editable": true,
					"options": {
						"path": "/var/lib/grafana/dashboards/default"
					}
				}
			]
		}
	},
	"dashboards": {
		"default": {
			"vault": {
				"gnetId": 7700,
				"revision": 3,
				"datasource": "Prometheus"
			}
		}
	}
}
EOF
helm install stable/grafana -f values.json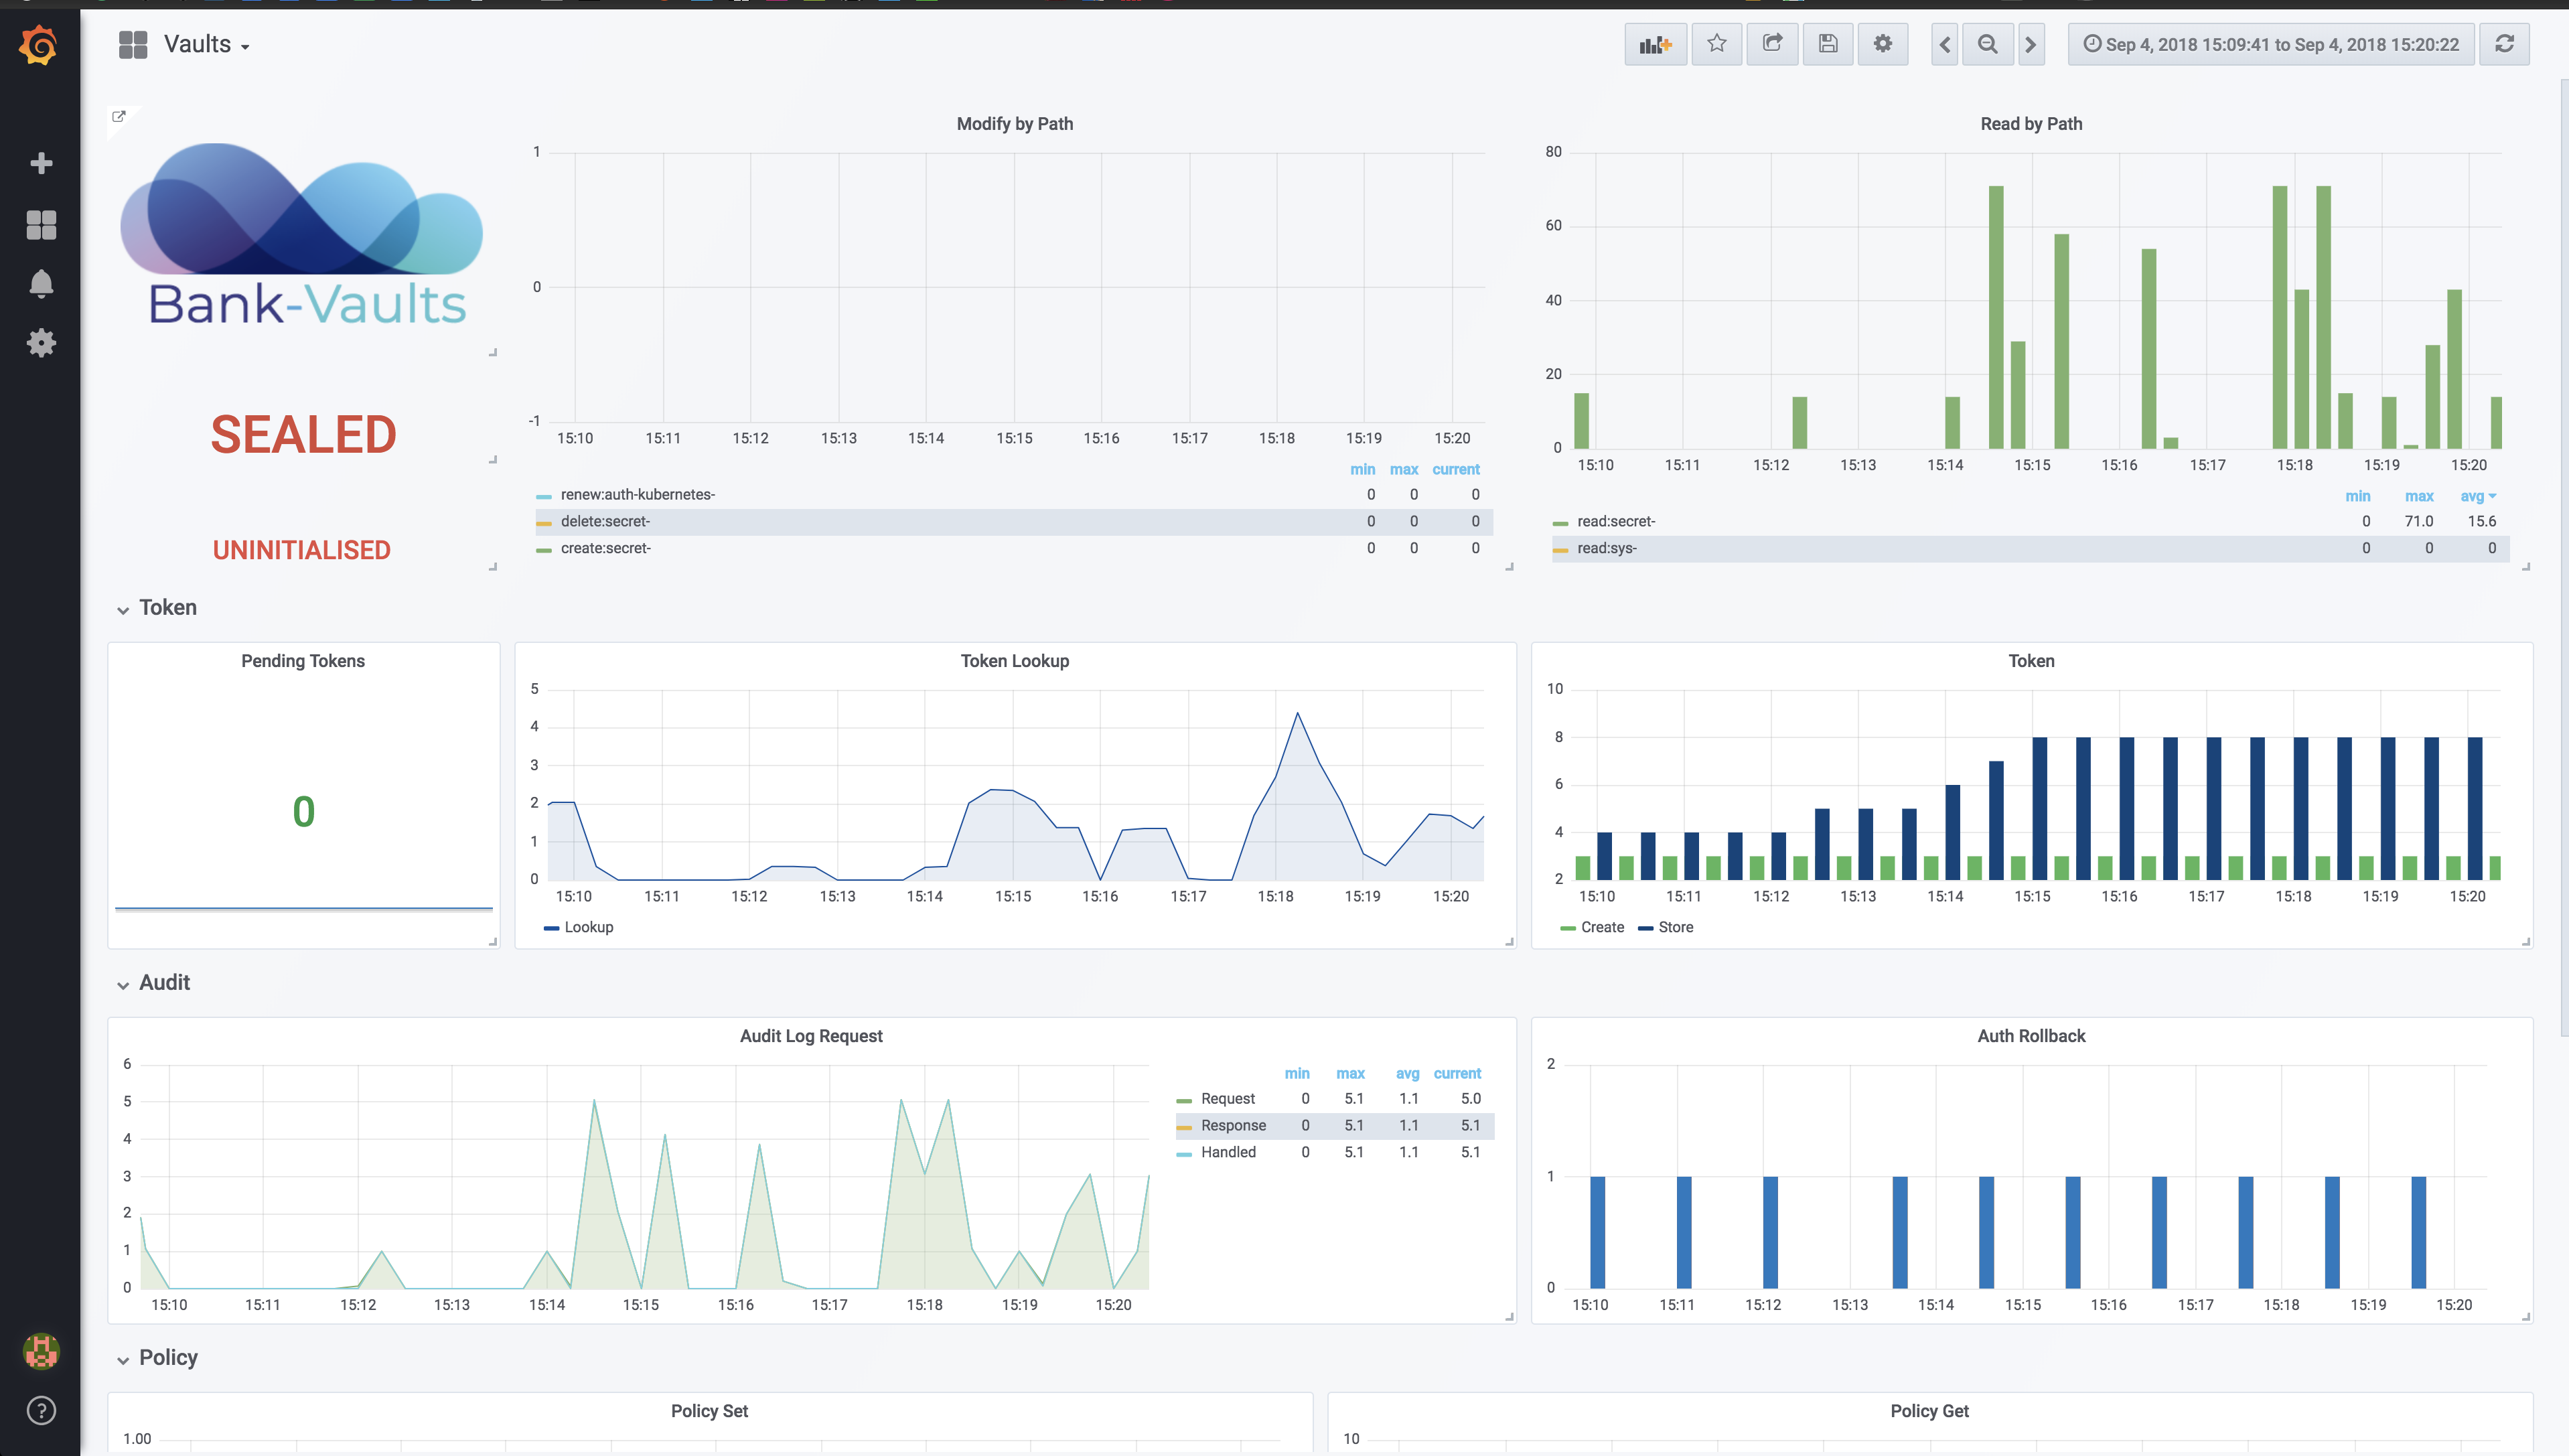
Happy monitoring! We hope you like what you see and appreciate the extra effort we go to in order to ensure out-of-the-box security and observability for all Pipeline users.
We take bank-vaults security and the trust of users very seriously, so if you believe you have found a security issue in bank-vaults, please contact us at security@banzaicloud.com.
Learn more about Bank-Vaults:
- Secret injection webhook improvements
- Backing up Vault with Velero
- Vault replication across multiple datacenters
- Vault secret injection webhook and Istio
- Mutate any kind of k8s resources
- HSM support
- Injecting dynamic configuration with templates
- OIDC issuer discovery for Kubernetes service accounts
- Show all posts related to Bank-Vaults