


Note: The Spotguides feature mentioned in this post is outdated and not available anymore. In case you are interested in a similar feature, contact us for details.
This post showcases how to enable a simple Spring Boot application for the Banzai Cloud CI/CD flow, build and save the necessary artifacts, and deploy it to a Kubernetes cluster. We have already posted about our CI/CD flow several times, and have set up a few example projects to illustrate how it works; this time we’ll show you how to use it with an arbitrary Spring Boot application.
To do that we’ve chosen this Spring Boot example project.
Note: The Pipeline CI/CD module mentioned in this post is outdated and not available anymore. You can integrate Pipeline to your CI/CD solution using the Pipeline API. Contact us for details.
Note: in order to follow along, you’ll need a Pipeline Control Plane running on a cloud provider. Check this post and this post for information on how to launch a control plane in one of the supported providers like AWS, Google and Azure, or BYOC. You’ll also need a dedicated s3 bucket to store the application’s artifacts (the Spring Boot Application archive).
CI/CD series:
CI/CD flow for Zeppelin notebooks CI/CD for Kubernetes, through a Spring Boot example Deploy Node.js applications to Kubernetes
Goals 🔗︎
We’ll start by checking out/forking our example project from the GitHub repository. We aim to have a full CI/CD flow triggered after every code change that’s pushed to the repository.
Setup 🔗︎
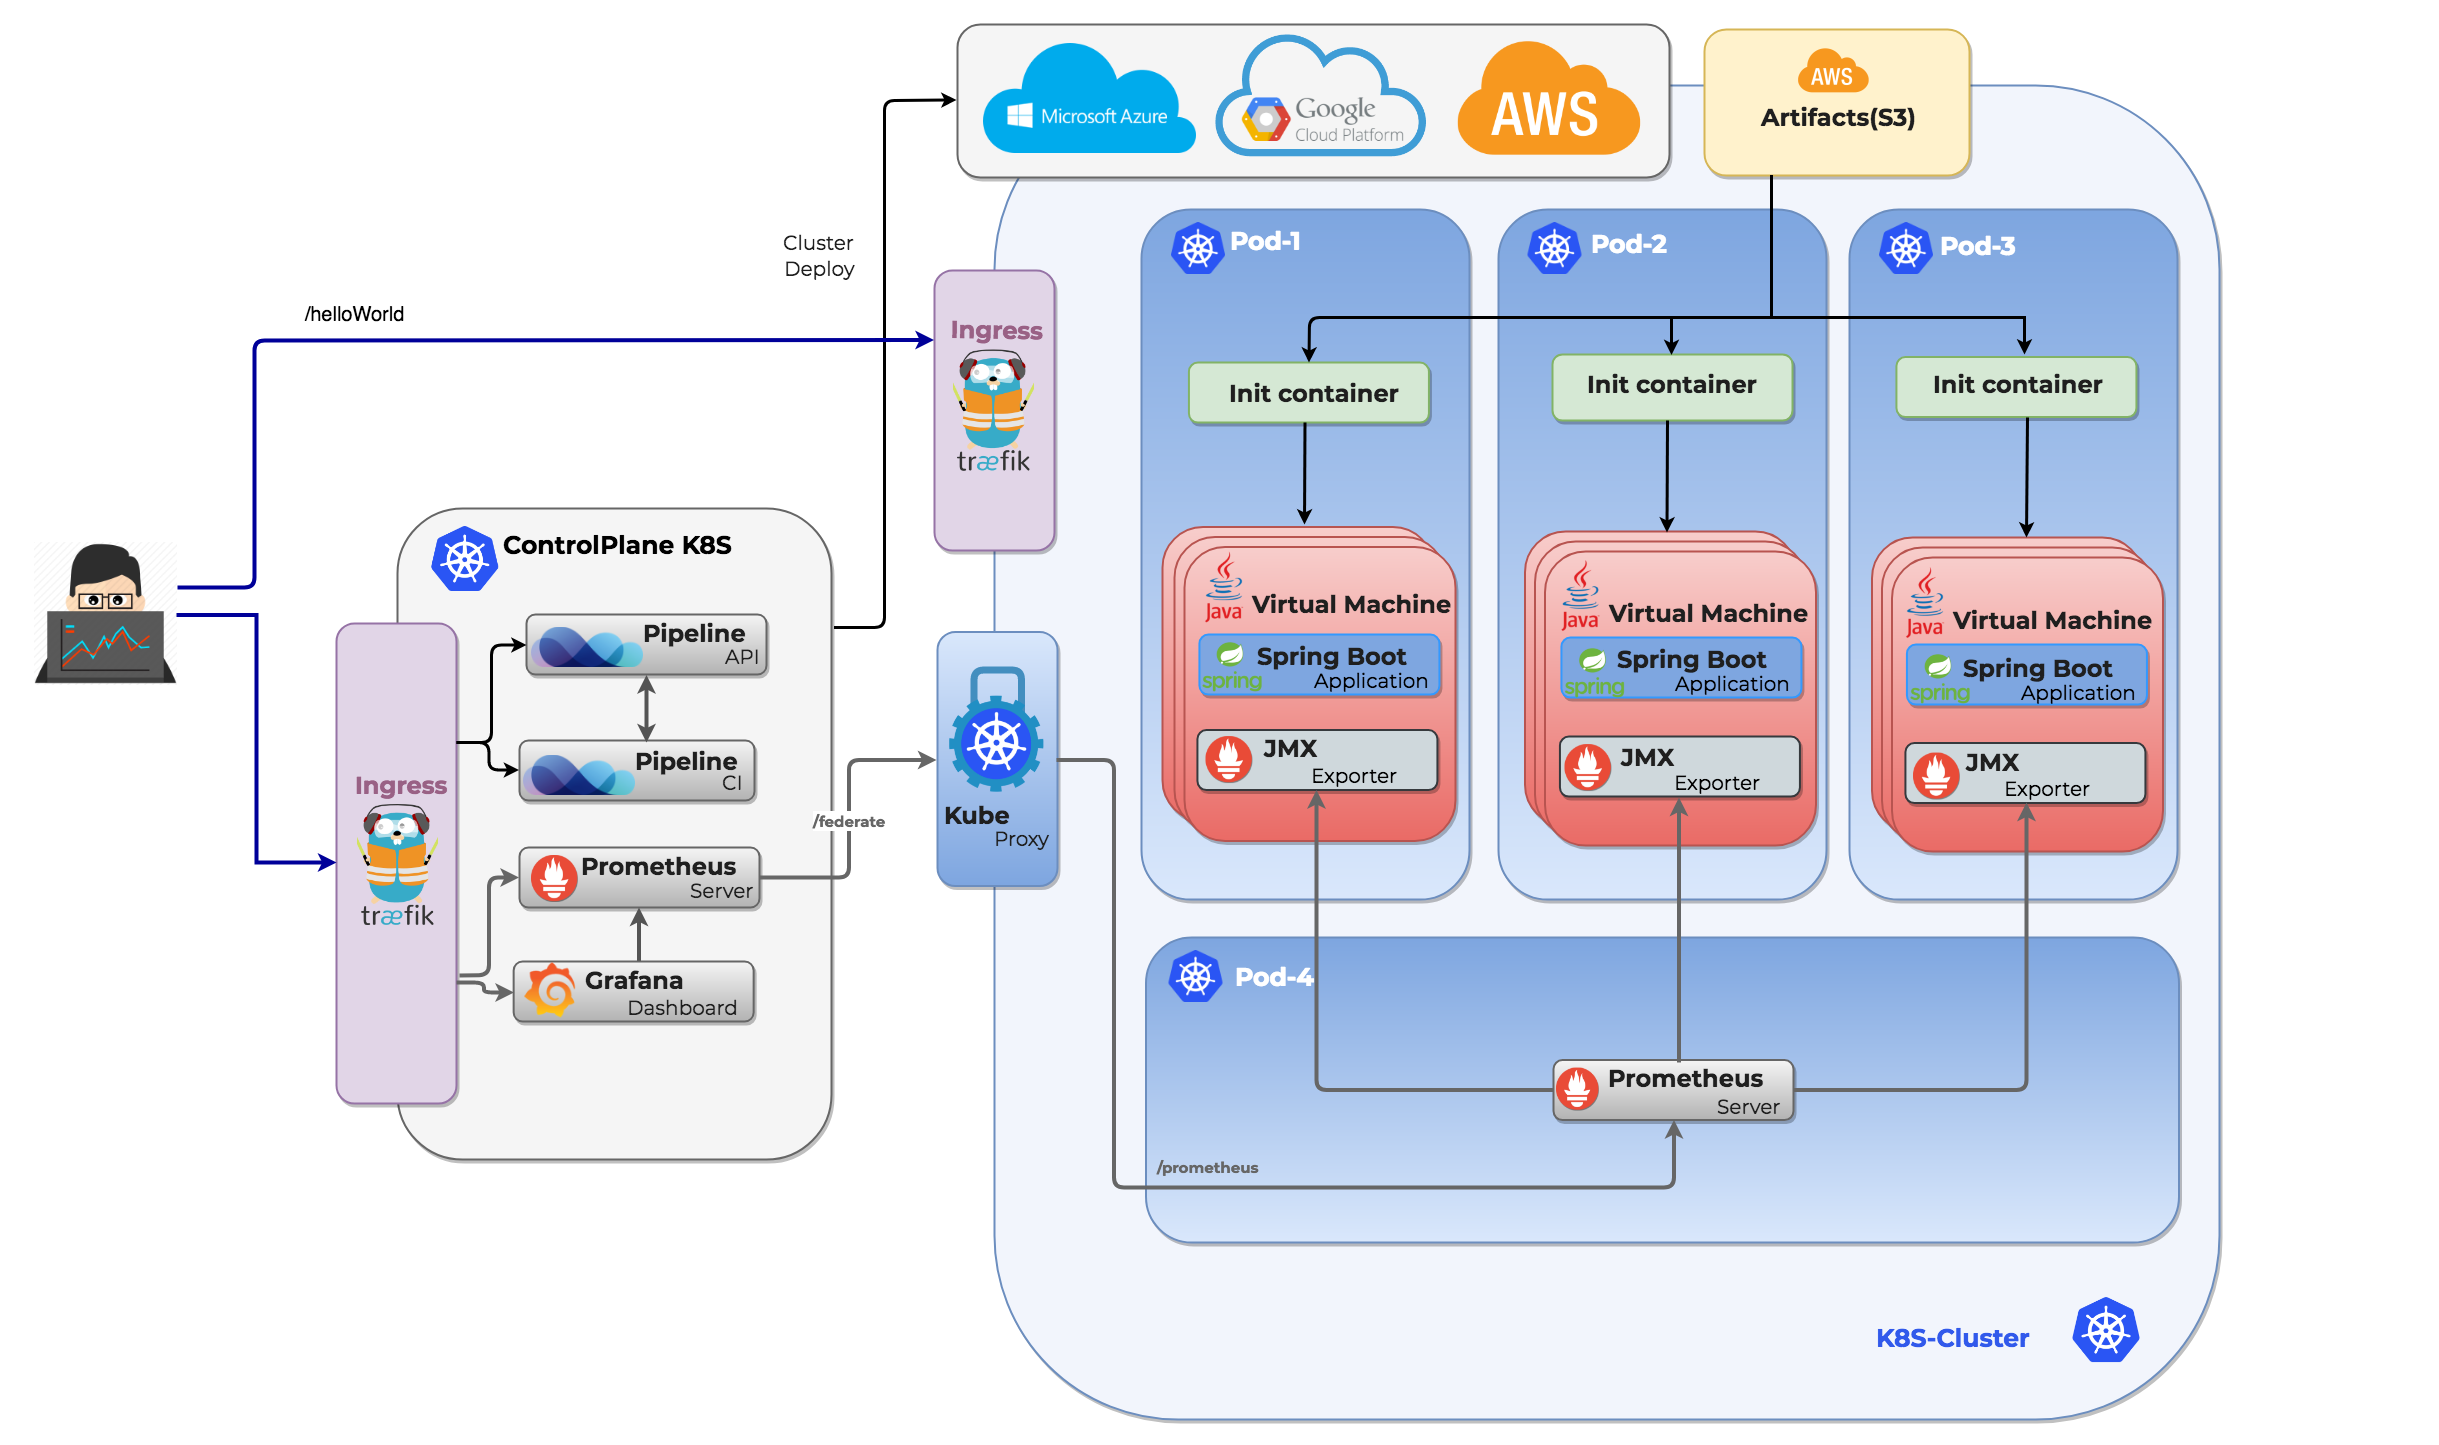
The desired Spring Boot deployment looks like this:
Clone (or fork) the GitHub repository 🔗︎
git clone git@github.com:spring-guides/gs-spring-boot.git
Create the Banzai Cloud Pipeline CI/CD flow descriptor 🔗︎
Create the flow descriptor file in the root folder of the freshly checked out project:
Note: the name of the file must be
.pipeline.yml
cat << EOF > .pipeline.yml
pipeline:

  create_cluster:
    image: banzaicloud/plugin-pipeline-client:0.3.0
    cluster_name: "[[cluster-name]]"
    cluster_provider: "gcloud"
    google_project: "[[google-project-id]]"
    secrets: [plugin_endpoint, plugin_token]

  remote_checkout:
    image: banzaicloud/plugin-k8s-proxy:latest
    original_image: plugins/git

  remote_build:
    image: banzaicloud/plugin-k8s-proxy:latest
    original_image: maven:3.5-jdk-8
    original_commands:
      - mvn -f complete/pom.xml -DskipTests clean package

  remote_publish_s3:
    image: banzaicloud/plugin-k8s-proxy:latest
    original_image:  plugins/s3
    bucket: [[s3-bucket]]
    source: complete/target/gs-spring-boot-0.1.0.jar
    strip_prefix: complete/target
    region: eu-west-1
    acl: public-read
    secrets: [plugin_access_key, plugin_secret_key]

  delete_app:
    image: banzaicloud/plugin-pipeline-client:0.3.0
    deployment_name: "banzaicloud-stable/springboot"
    deployment_release_name: "springboot"
    deployment_state: "deleted"
    secrets: [plugin_endpoint, plugin_token]

  deploy_app:
    image: banzaicloud/plugin-pipeline-client:0.3.0
    deployment_name: "banzaicloud-stable/springboot"
    deployment_release_name: "springboot"
    deployment_values:
      artifactUrl: "https://s3-eu-west-1.amazonaws.com/[[s3-bucket]]/gs-spring-boot-0.1.0.jar"
#      env:
# Java options
#        - name: JAVA_OPTS
#          value: "-Dserver.port=8080"
# Application arguments
#        - name: ARGS
#          value: ""
    secrets: [plugin_endpoint, plugin_token]
EOF
The .pipeline CI/CD descriptor explained 🔗︎
The CI/CD descriptor .pipeline.yml file lists the steps that drive the process, from building the source to deploying the application to a Kubernetes cluster.
Every step runs in a separate container (those prefixed with remote_ run in the Kubernetes cluster). Subsequent containers share a persistent volume, which is created for every iteration/build.
The name of each step should be self explanatory - steps can be named to most accurately describe what they do:
-
create_cluster- creates a Kubernetes cluster for the flow (if the cluster with the given name exists, it will be reused). This step may vary according to your chosen cloud provider. Take a look at our example projects, in which we provide templates for every supported cloud provider.
- this step can be altered to delete an existing cluster by adding the property
cluster_state: deletedline to the block
-
remote checkout- checks the code in a previously created Kubernetes cluster against the persistent volume
-
remote_build- builds the application, and stores its artifacts on the persistent volume
- this step (or a separate one) can also be used to run unit tests and, eventually, to generate reports
-
remote_publish_s3- uploads the built artifact (the Spring Boot application archive) to dedicated s3 storage. The jar will have
public-readacls. This is important, since the archive will be downloaded into the Kubernetes cluster when the application is deployed. It can use custom/restricted ACLs as well.
- uploads the built artifact (the Spring Boot application archive) to dedicated s3 storage. The jar will have
-
delete_app- this step is necessary because the Kubernetes cluster may be reused, and the Spring Boot application is deployed using Helm charts - with this step we make certain that the application is redeployed.
-
deploy_app- the application is deployed. Deployments are done using Helm charts, which you can find in our GitHub charts repository.
The flow descriptor is picked up after each code change is pushed to the git repository, and a series of steps is automatically executed. (Check the CI/CD setup guide for more details about Control Plane and GitHub settings).
The progress can be followed on the user interface available on the Control Plane.
Check the application 🔗︎
At the end of every successful iteration, the application is deployed in a Kubernetes Pod and made available through a Kubernetes ingress to be accessed from outside the cluster.
The endpoint from which the Spring Boot application is available can be retrieved using the Pipeline API, available on the control plane:
curl --request GET \
  --url 'http://{{CP-ip}}/pipeline/api/v1/clusters/{{cluster_id}}/endpoints' \
  --header 'Authorization: Bearer {{token}}' \
  --header 'Content-Type: application/x-www-form-urlencoded'
We’ve created a Postman collection with many useful Pipeline API calls; check those out to find more ways of managing those clusters and deployments managed by the Pipeline instance on the Control Plane
Helm chart for supporting Spring Boot applications 🔗︎
We created a Helm Chart that supports Spring Boot applications in our CI/CD flow - this chart can be used with any Kubernetes cluster.
The chart contains the configuration bits for the infrastructure required by the Spring Boot application deployment.
The sample Spring Boot application runs in an embedded Tomcat. For simplicity’s sake we haven’t changed that.
The chart sets up the following components in the Kubernetes cluster:
- the Spring Boot application is started in a Kubernetes Pod
- the embedded tomcat is exposed as a Kubernetes Service
- the service is further exposed through an Ingress resource
The Spring Boot archive is downloaded as part of the deployment process, using an Init Container. As seen in the example above, the Helm chart allows you to specify JAVA_OPTS and ARGS arguments, as well as those - typical to Spring deployments - specified in the deployment.yaml implementation.
Monitoring 🔗︎
We monitor all the deployments we push to Kubernetes with Pipeline, using Prometheus, out-of-the-box. If you are deploying a Spring Boot application using our CI/CD pipeline, API or spotguides, you’re already the beneficiary of out-of-the-box JVM monitoring. We have a collector that configurably scrapes and exposes the mBeans of a JMX target. It runs as a Java Agent, exposing a HTTP server and serving metrics of the local JVM. It can also be run as an independent HTTP server, and scrape remote JMX targets, but this has various disadvantages, such as making it harder to configure and rendering it unable to expose process metrics (e.g., memory and CPU usage). Running the exporter as a Java Agent is thus strongly encouraged.
We have forked this exporter, and enhanced it a bit with a Dockerfile, which adds support for all of the options above.
- Connect to an exposed JMX port of the JVM (not recommended)
- Java agent version (recommended)
For the agent version, you’ll have three configuration options:
- the Jar file location
- the
portfor the http(s) interface, where the metrics will be available to be scraped, which is already in a Prometheus friendly format - additional configuration options
An example looks like this:
-javaagent:/opt/jmx-exporter/jmx_prometheus_javaagent-0.3.1-SNAPSHOT.jar=9020:/etc/jmx-exporter/config.yaml
For further information of monitoring JVM based applications please read up on our older monitoring posts here.
Benefits 🔗︎
Once the project is enabled for the Banzai Cloud CI/CD flow (note that the setup only needs to be done once!), you can redirect your focus towards development; the infrastructure is automatically set up and every code change is quickly propagated to a freshly deployed version of the application. Happy CI/CD.


