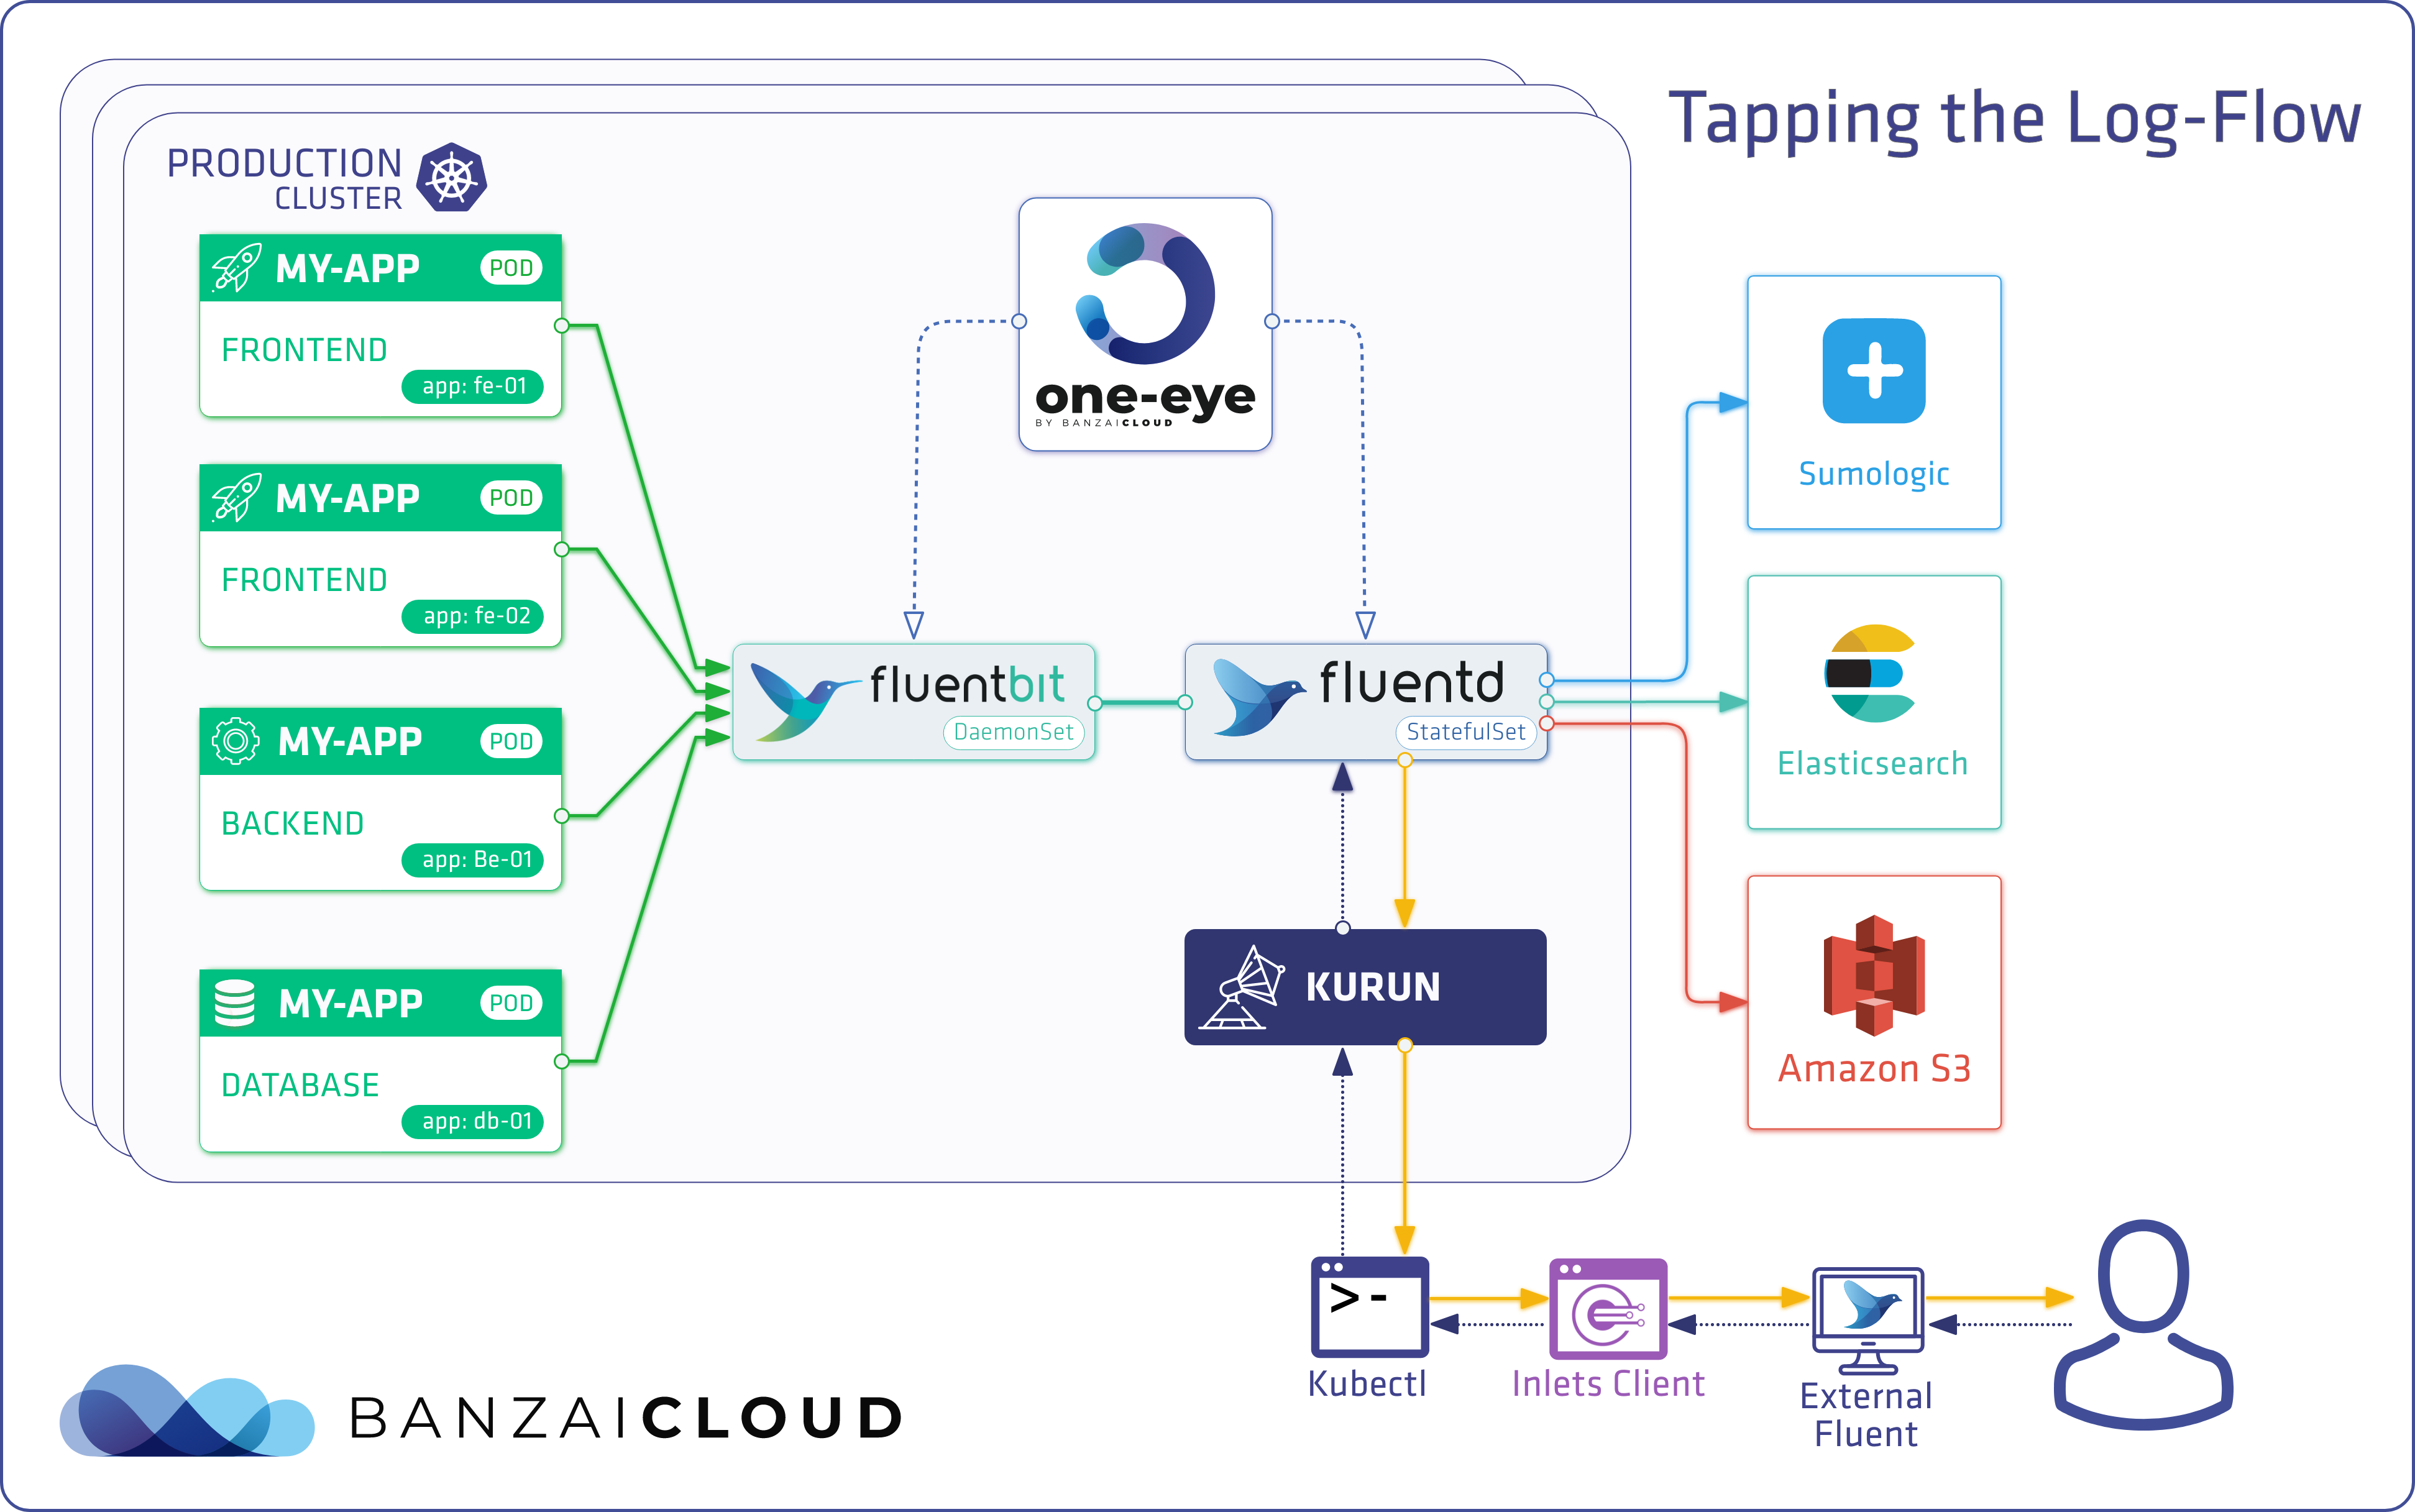
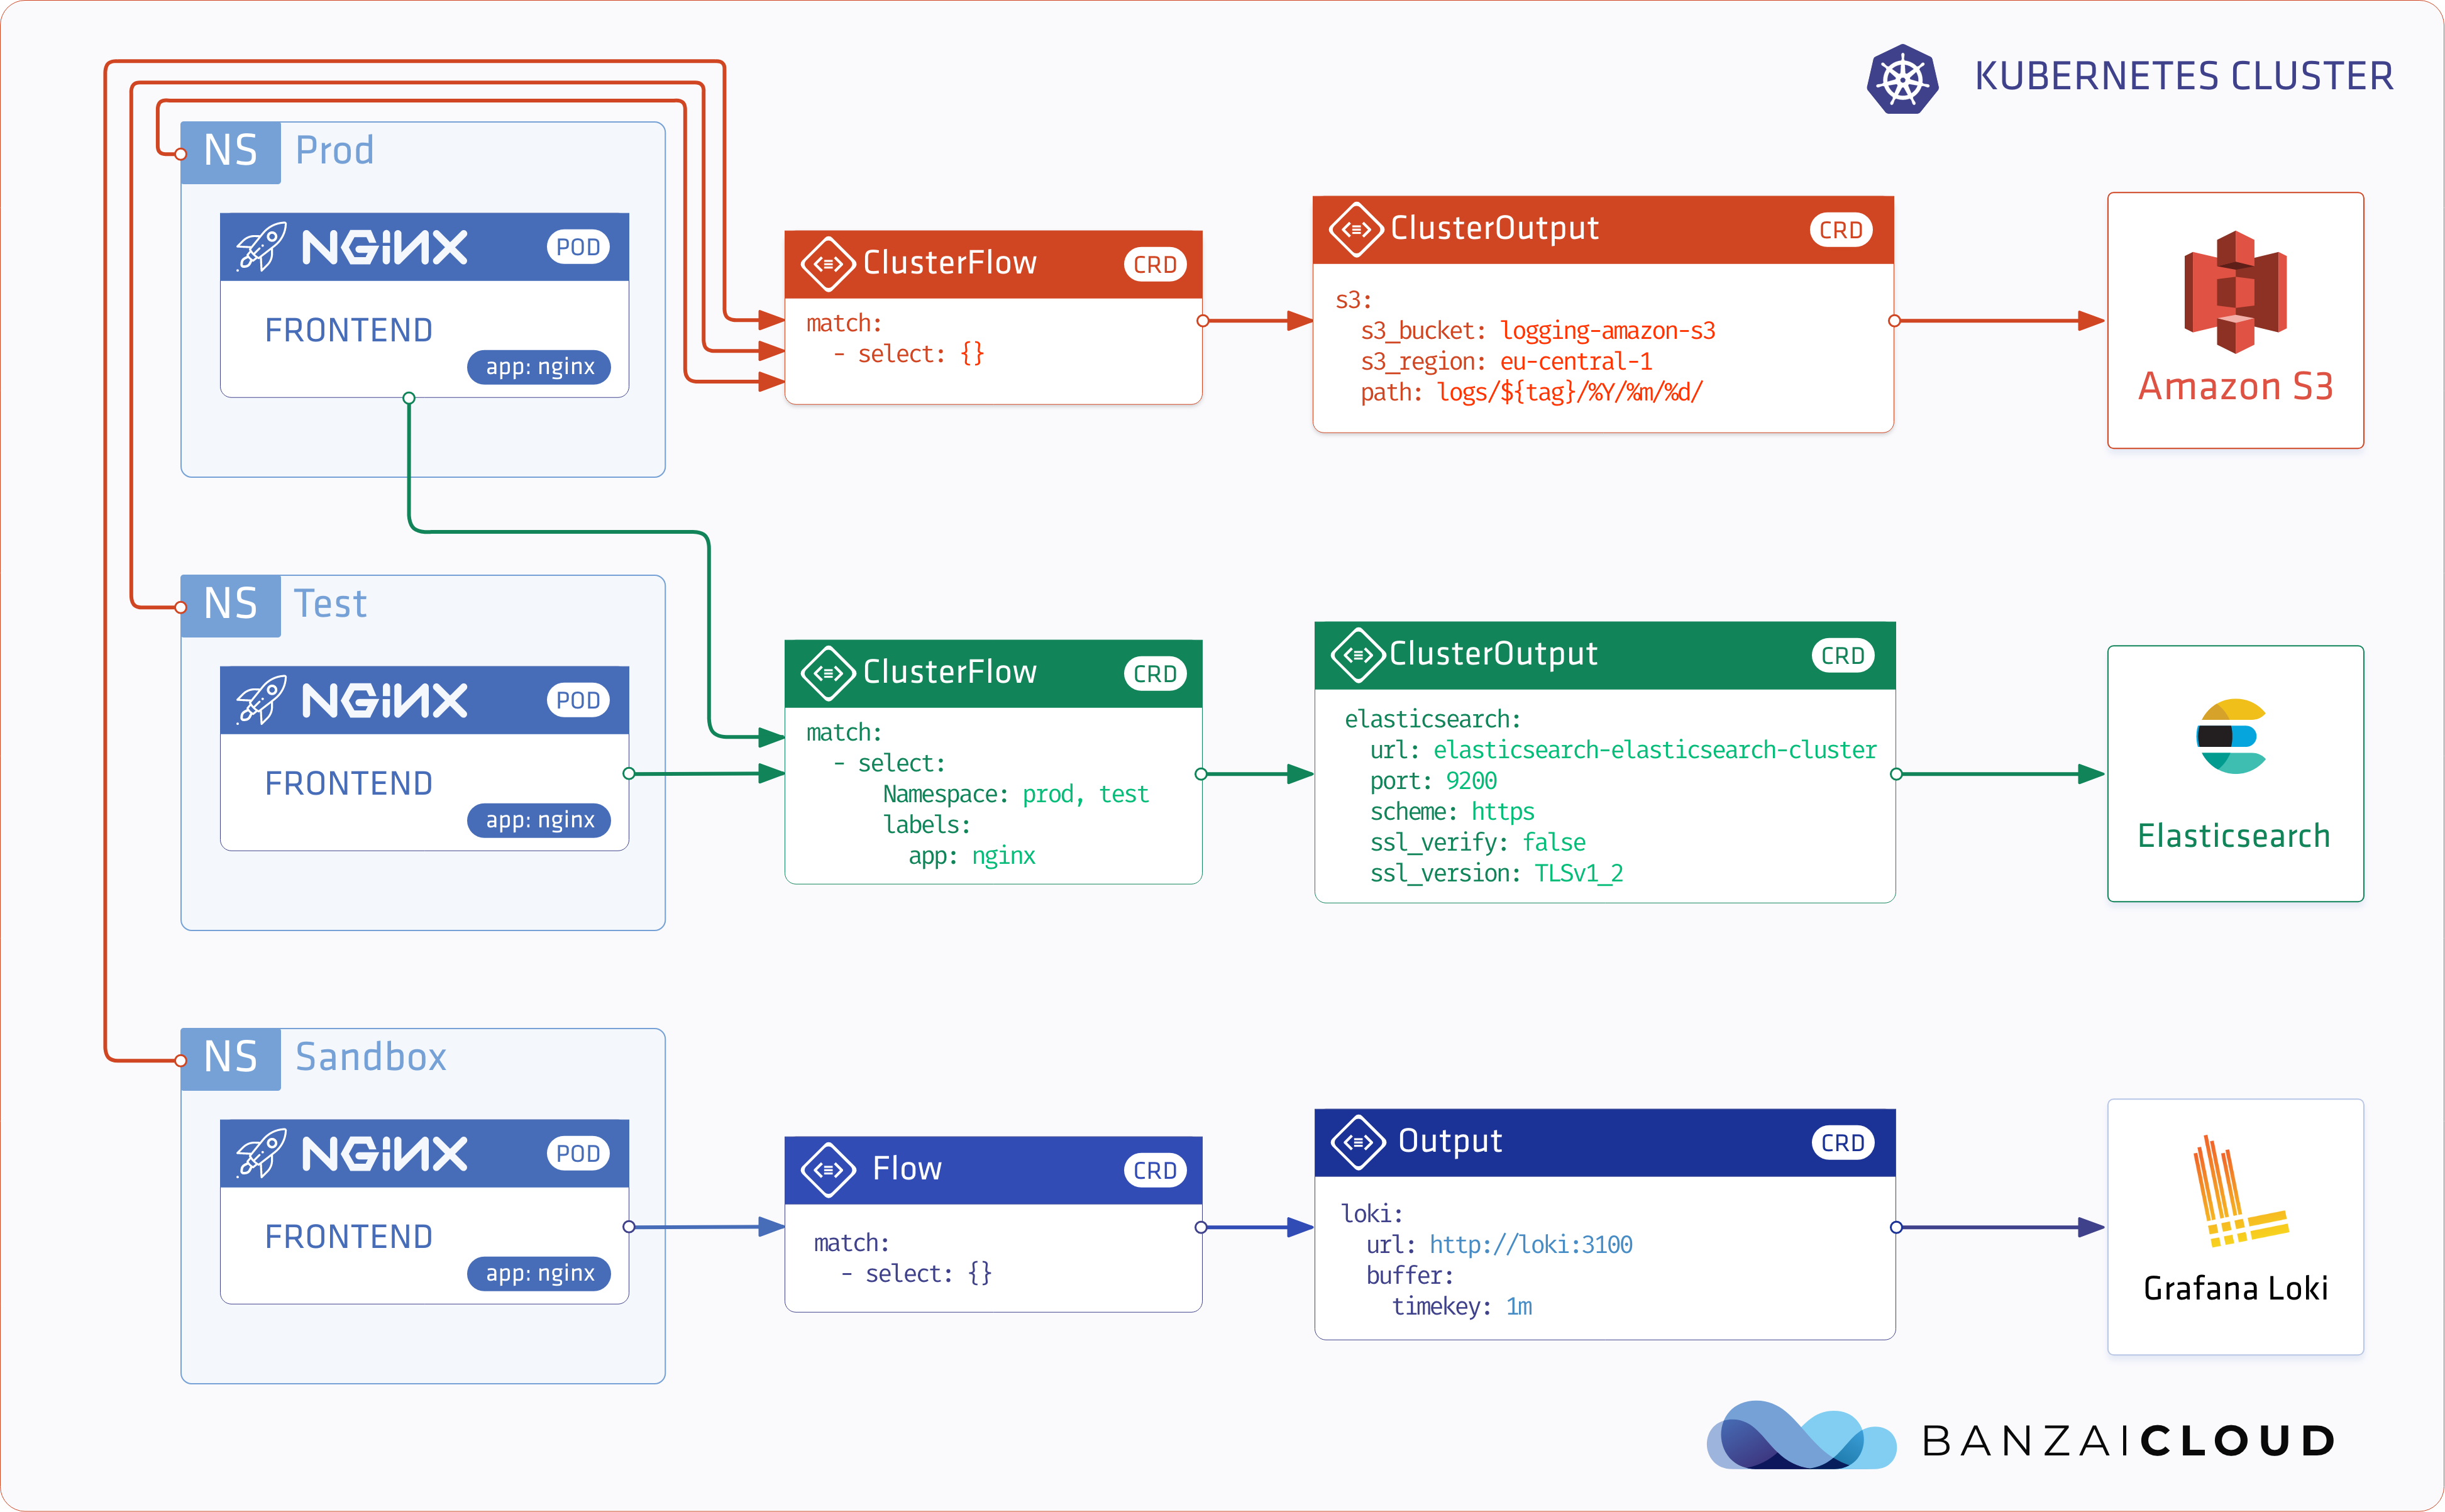
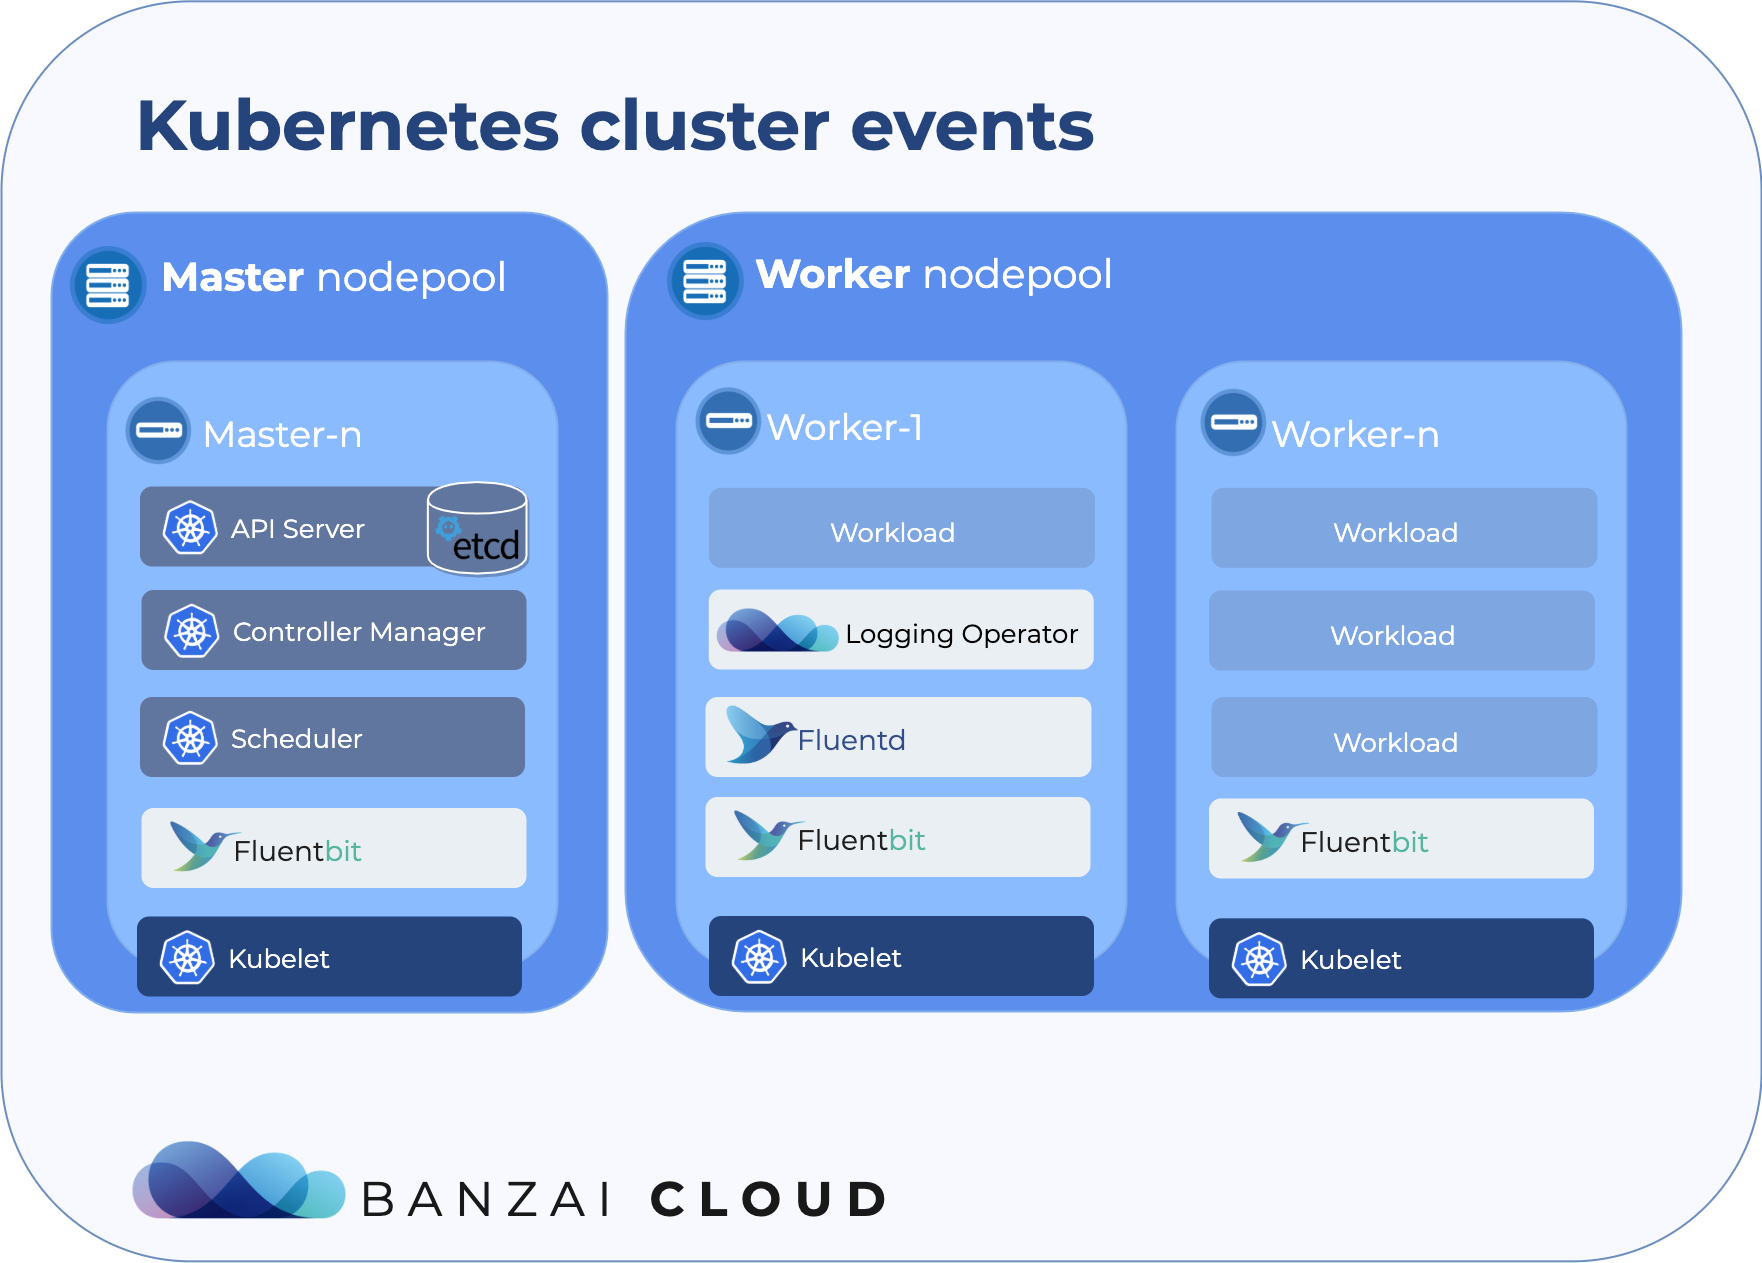
Update: Logging operator v3 (released March, 2020) 🔗︎
We’re constantly improving the logging-operator based on feature requests of our ops team and our customers. The main features of version 3.0 are:
- Log routing based on namespaces
- Excluding logs
- Select (or exclude) logs based on hosts and container names
- Logging operator documentation is now available on the Banzai Cloud site.
Check The Kubernetes logging operator reloaded post for details.
For our Pipeline PaaS, monitoring is an essential part of operating distributed applications in production. We put a great deal of effort into monitoring large and federated clusters and automating these with Pipeline, so all our users receive out of the box monitoring for free. You can read about our monitoring series, below:
Monitoring series:
Monitoring Apache Spark with Prometheus
Monitoring multiple federated clusters with Prometheus - the secure way
Application monitoring with Prometheus and Pipeline
Building a cloud cost management system on top of Prometheus
Monitoring Spark with Prometheus, reloaded
Logging series:
Centralized logging under Kubernetes
Secure logging on Kubernetes with Fluentd and Fluent Bit
Advanced logging on Kubernetes
Monitoring’s best friend is logging, and they go hand in hand. If something doesn’t look good on our Grafana dashboards, or we get an alert from Prometheus, then we need to investigate. To do that, we usually start by checking the logs. In a monolithic environment log checking is relatively easy; there is a small number of machines and it’s enough to obtain file logs or a syslog endpoint when we need to carry out an investigation. Also, for smaller or simpler deployments, Kubernetes provides a smaller, simpler command to check the output of an application.
$ kubectl logs pipeline-traefik-7c47dc7bd7-5mght
time="2018-03-29T21:44:59Z" level=info msg="Using TOML configuration file /config/traefik.toml"
time="2018-03-29T21:44:59Z" level=info msg="Traefik version v1.4.3 built on 2017-11-14_11:14:24AM"
You can read more about official Kubernetes logging, here.
Things grow increasingly complicated when there are a few more (or, in our case, a lot more) containers. Moreover, due to the ephemeral nature of those containers, they may already be terminated when you search for their logs. So, we needed a solution that allows us to get the logs from all cloud virtual machines, Kubernetes itself, and, of course, the deployed applications.
Logging the Kubernetes way 🔗︎
Unfortunately, Kubernetes doesn’t provide many configuration options that pertain to logging. Docker offers multiple logging drivers, but we can’t configure them via Kubernetes. Thankfully, there are already several open source solutions. When it comes to logging, our favorite tools are Fluentd and Fluent-bit.
Fluentd to do the job 🔗︎
Fluentd is an open source data collector for a unified logging layer. It’s written in Ruby with a plug-in oriented architecture. It helps to collect, route and store different logs from different sources.
Under the hood 🔗︎
Running fluentd is relatively easy. A simple configuration file describes the log pipeline.
There are three main types of plugins: Source, Filter and Output. As you’ve probably guessed, the logs come from the input filter. There are several different solutions like tailing files, accepts http or syslog, etc.
<source>
  @type tail
  path /var/log/httpd-access.log
  pos_file /var/log/td-agent/httpd-access.log.pos
  tag apache.access
  format apache2
</source>
After ingressing, the logs are treated as records with metadata. You can use any filter plugin to transform the log data or the attached metadata.
<filter apache.*>
  @type record_transformer
  <record>
    hostname "#{Socket.gethostname}"
  </record>
</filter>
Finally, output plugins can be used to archive the log to files, S3, ElasticSearch and plenty more. For additional information, check the fluentd plugin catalog
<match **>
  @type file
  path /var/log/fluent/myapp
  time_slice_format %Y%m%d
  time_slice_wait 10m
  time_format %Y%m%dT%H%M%S%z
  compress gzip
  utc
</match>
Why’s this cool? Because we can create structured logs from all kinds of applications.
Routing basics 🔗︎
You may notice(apache.*) patterns next to the plugin declarations. These are called tags, and help to route different logs from the same or different sources. Patterns are matched via simple rules.
| Pattern | Action | Example |
|---|
- | matches a single tag part | a.* matches a.b, but does not match a or a.b.c ** | matches zero or more tag parts. | a.** matches a, a.b and a.b.c {X,Y,Z} |matches X, Y, or Z, where X, Y, and Z are match patterns.|{a,b} matches a and b, but does not match c
This can be used in combination with * or ** patterns. Examples include a.{b,c}.* and a.{b,c.**}. The patterns <match a b> match a and b. The patterns <match a.** b.*> match a, a.b, a.b.c (from the first pattern) and b.d (from the second pattern).
Fluent-bit 🔗︎
Why do we need another tool? While Fluentd is optimized to be easily extended using plugin architecture, fluent-bit is designed for performance. It’s compact and written in C so it can be enabled to minimalistic IOT devices and remain fast enough to transfer a huge quantity of logs. Moreover, it has built-in Kubernetes support. It’s an especially compact tool designed to transport logs from all nodes.
Fluent Bit is an open source and multi-platform Log Processor and Forwarder.
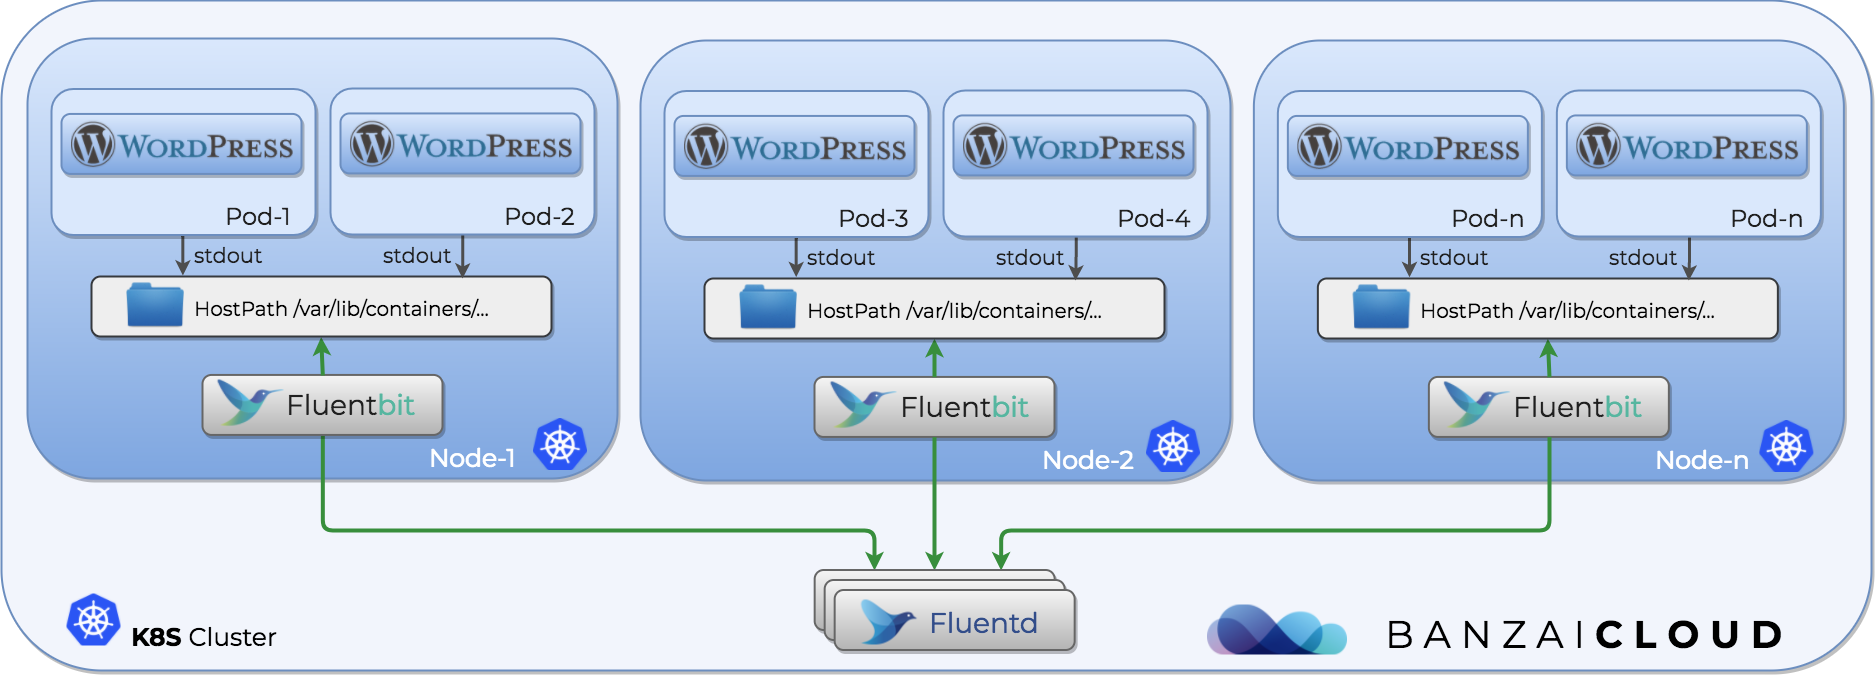
How fluent-bit handles Kubernetes logs 🔗︎
As Kubernetes does not provide logging configurations, we can’t transfer logs directly into the fluent protocol. But every container’s log is available in the host’s /var/log/container/* directory. An example Kubernetes-enabled fluent-bit configuration looks like this:
[SERVICE]
    Flush        1
    Daemon       Off
    Log_Level    info
    Parsers_File parsers.conf

[INPUT]
    Name          tail
    Path          /var/log/containers/*.log
    Parser        docker
    Tag           kube.*
    Mem_Buf_Limit 5MB

[FILTER]
    Name            kubernetes
    Match           kube.*
    Merge_JSON_Log  On
...
There is an official Kubernetes filter bundle that enriches the logs with metadata. For more details check the installation and configuration manuals of fluent-bit.
To use the Kubernetes filter plugin, make sure that fluent-bit has sufficient permissions to get, watch, and list Pods.
Fluent-bit will enrich logs with the following metadata:
- POD Name
- POD ID
- Container Name
- Container ID
- Labels
- Annotations
If you need help configuring Fluent-bit, see the excellent official examples.
Putting it together 🔗︎
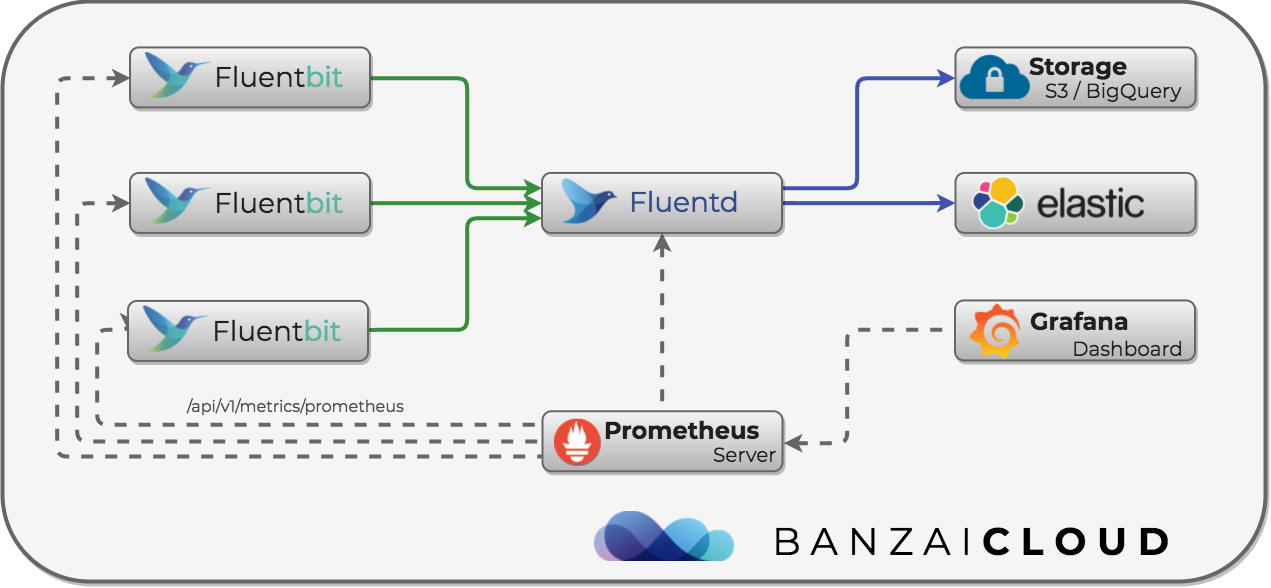
We have all our tools, now we need to set them up. We need to deploy fluent-bit as a DaemonSet in order to collect these logs. These pods will mount the Docker container’s log from the Host machine, and transfer them to the Fluentd service for further transformation.
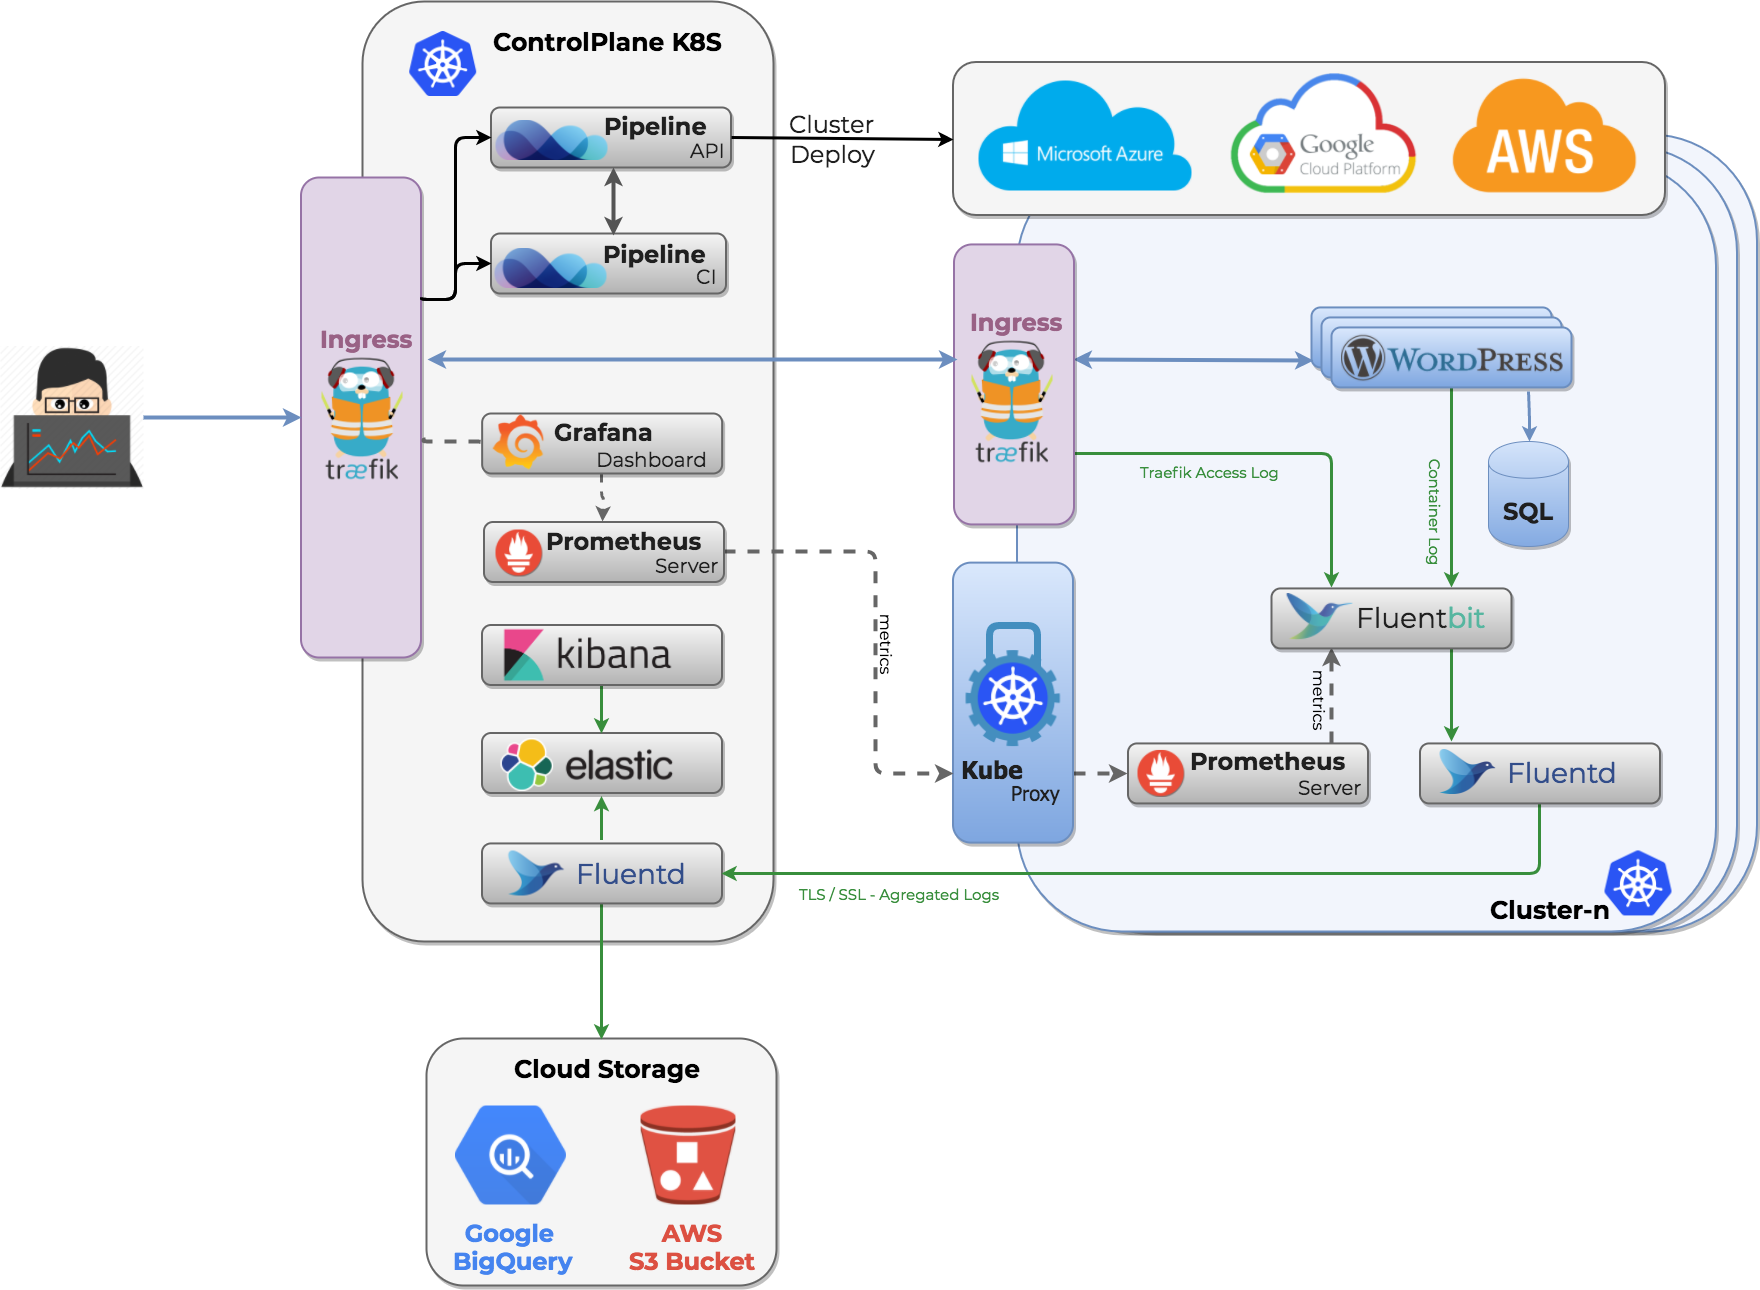
A DaemonSet ensures that all (or some) Nodes run a copy of a Pod.
Monitoring the log deployment 🔗︎
The architecture of this log management solution is quite complex, so let’s not forget to monitor it as well. Because we work with cloud native tools, we use Prometheus for monitoring. Luckily, we can do that here, as well. Fluentd supports Prometheus via the fluent-plugin-prometheus plugin, and Fluent-bit also supports Prometheus.
The following example Fluentd plugin configuration enables Prometheus scraping. For more details, read the plugin’s GitHub page. The plugin gives us an HTTP Prometheus scraping endpoint at http://<service-host>:24231/metrics.
<source>
  @type prometheus
  port 24231
</source>

<source>
  @type prometheus_monitor
</source>

<source>
  @type prometheus_output_monitor
</source>
The following example enables the HTTP server needed for scraping metrics. Its endpoint will be http://<service-host>:2020/api/v1/metrics/prometheus.
[SERVICE]
    HTTP_Server  On
    HTTP_Listen  0.0.0.0
    HTTP_Port    2020
To illustrate this feature, we built a Fluent-bit container that is publicly available from the Banzai Cloud GitHub repository. It is not recommmended that you use this image in production. To find out why, read our post about logging and security in Kubernetes
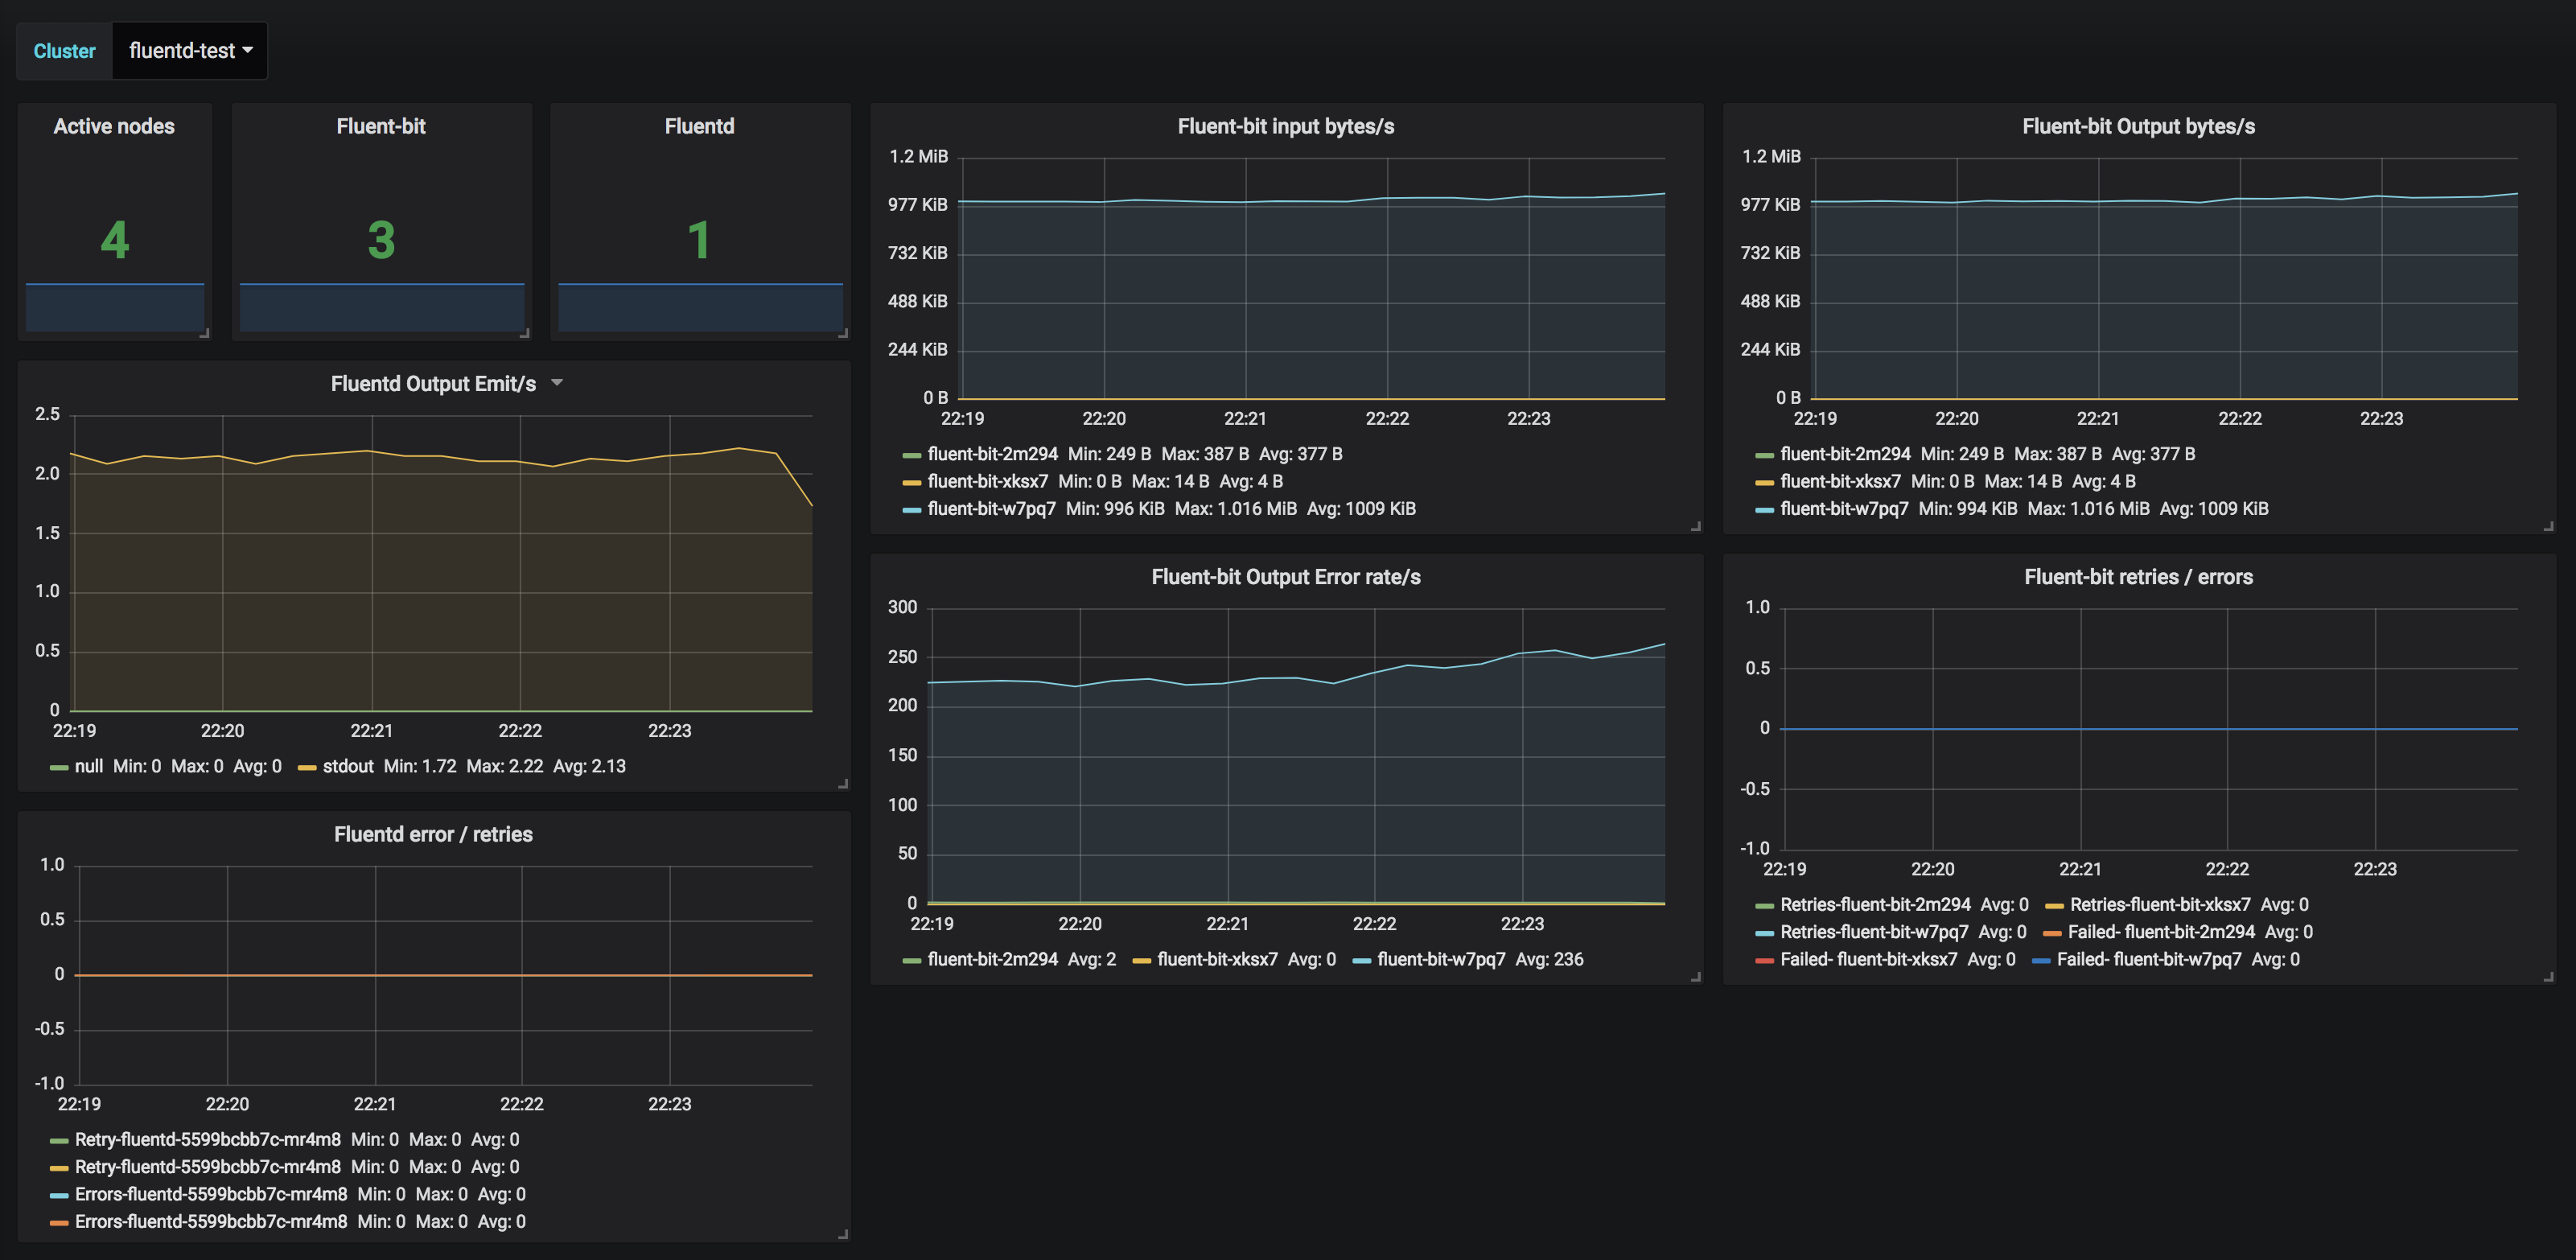
We just need to set-up Prometheus annotations on our Pods and collect their metrics. Here’s a teaser from an upcoming post - a simple Grafana dashboard with metrics:
Next steps 🔗︎
Read the next blog post in this series to learn the best way to enable TLS security and authentication. There will also be a complete example on how to collect, transform and store logs. As usual, all the above is used and automated by Banzai Cloud Pipeline.


