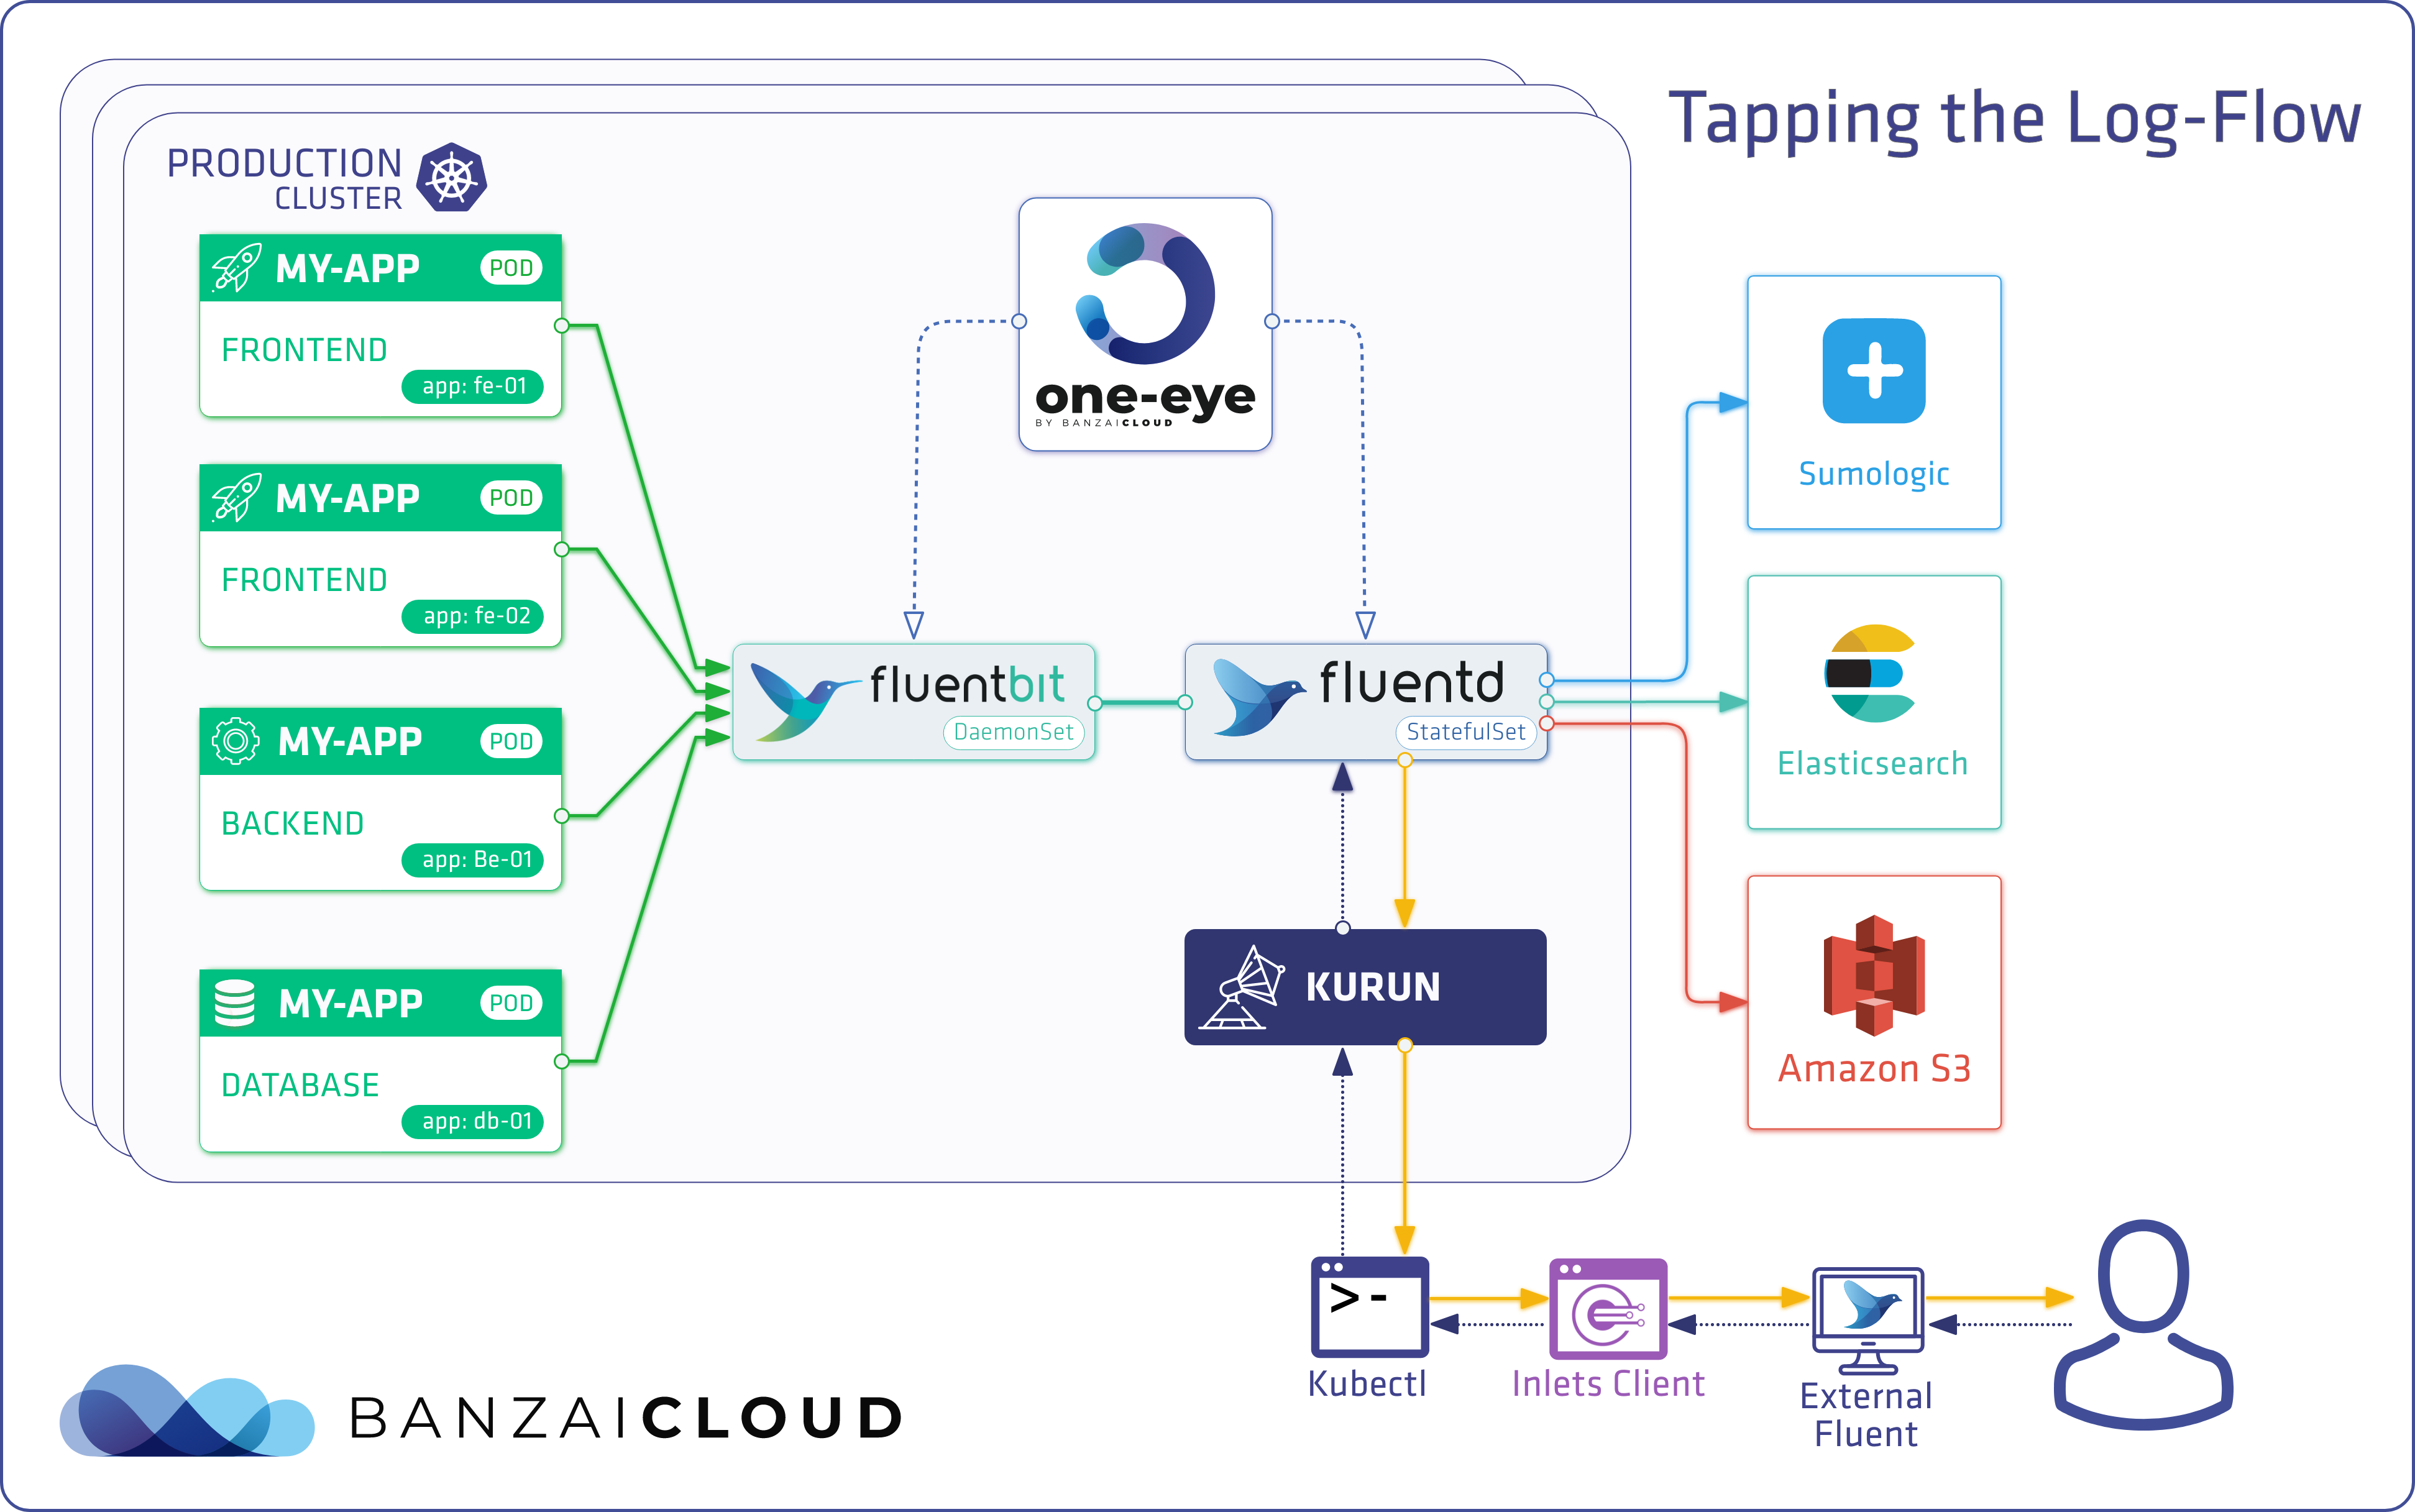
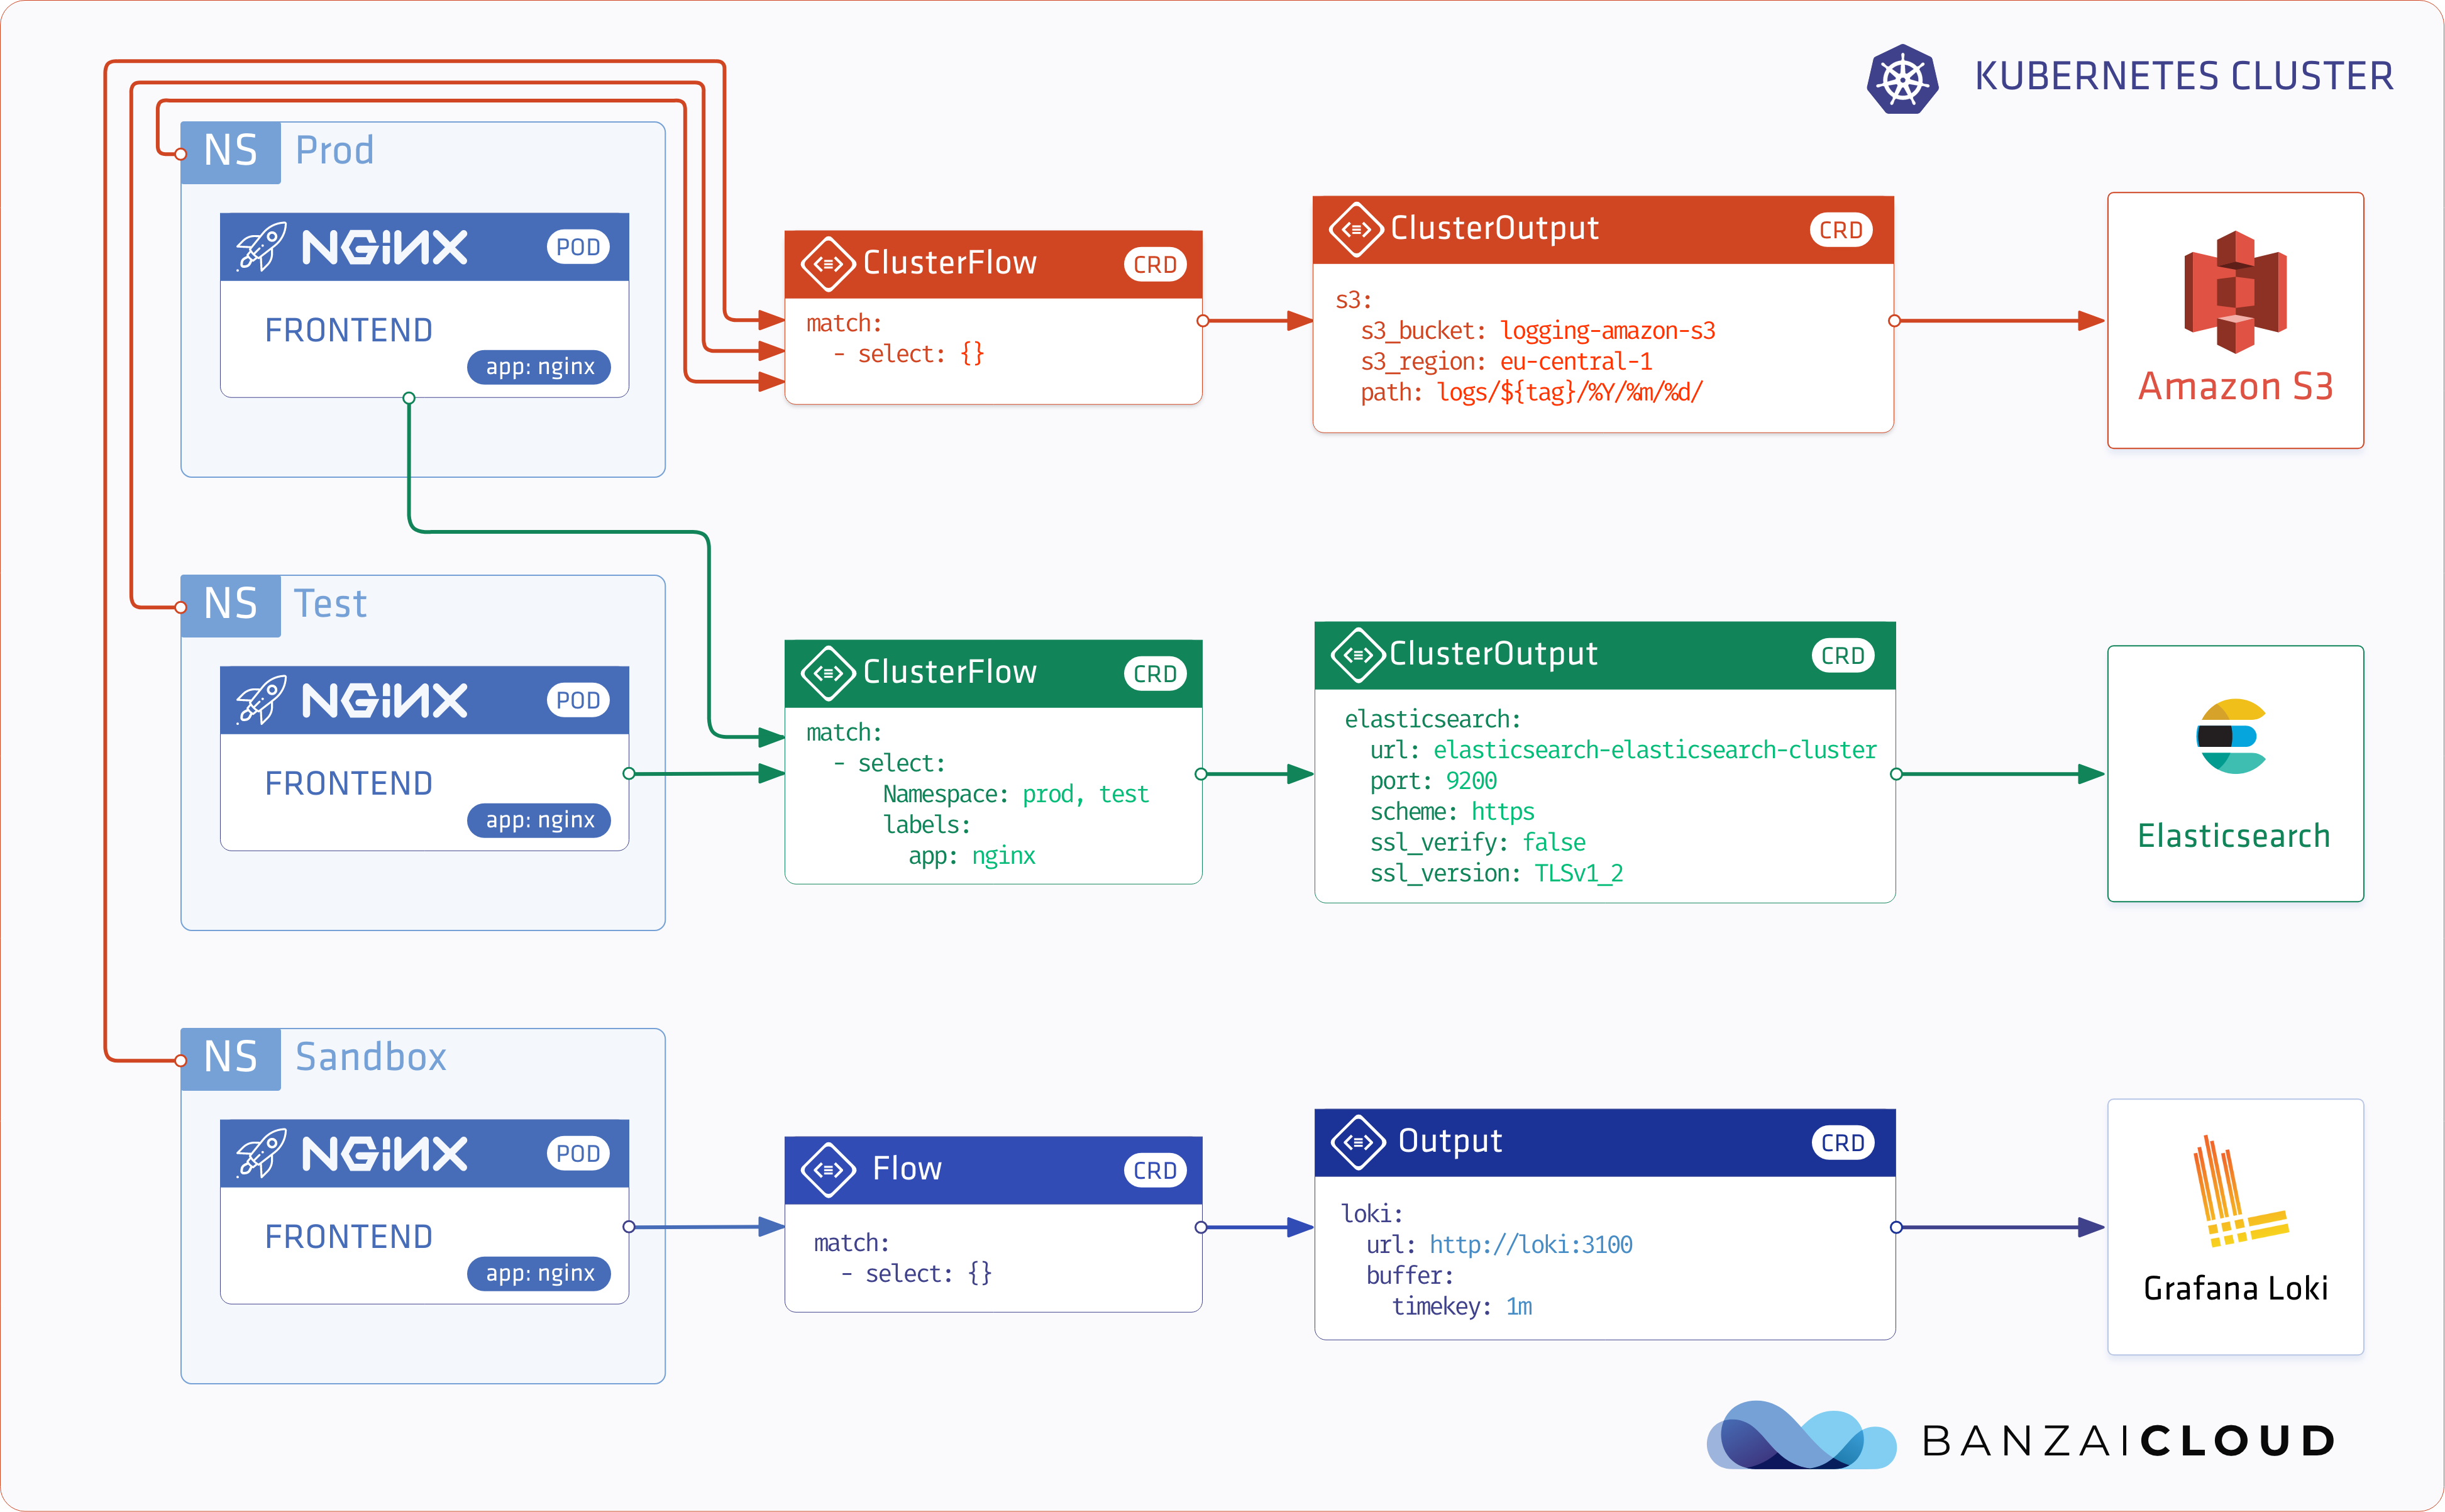
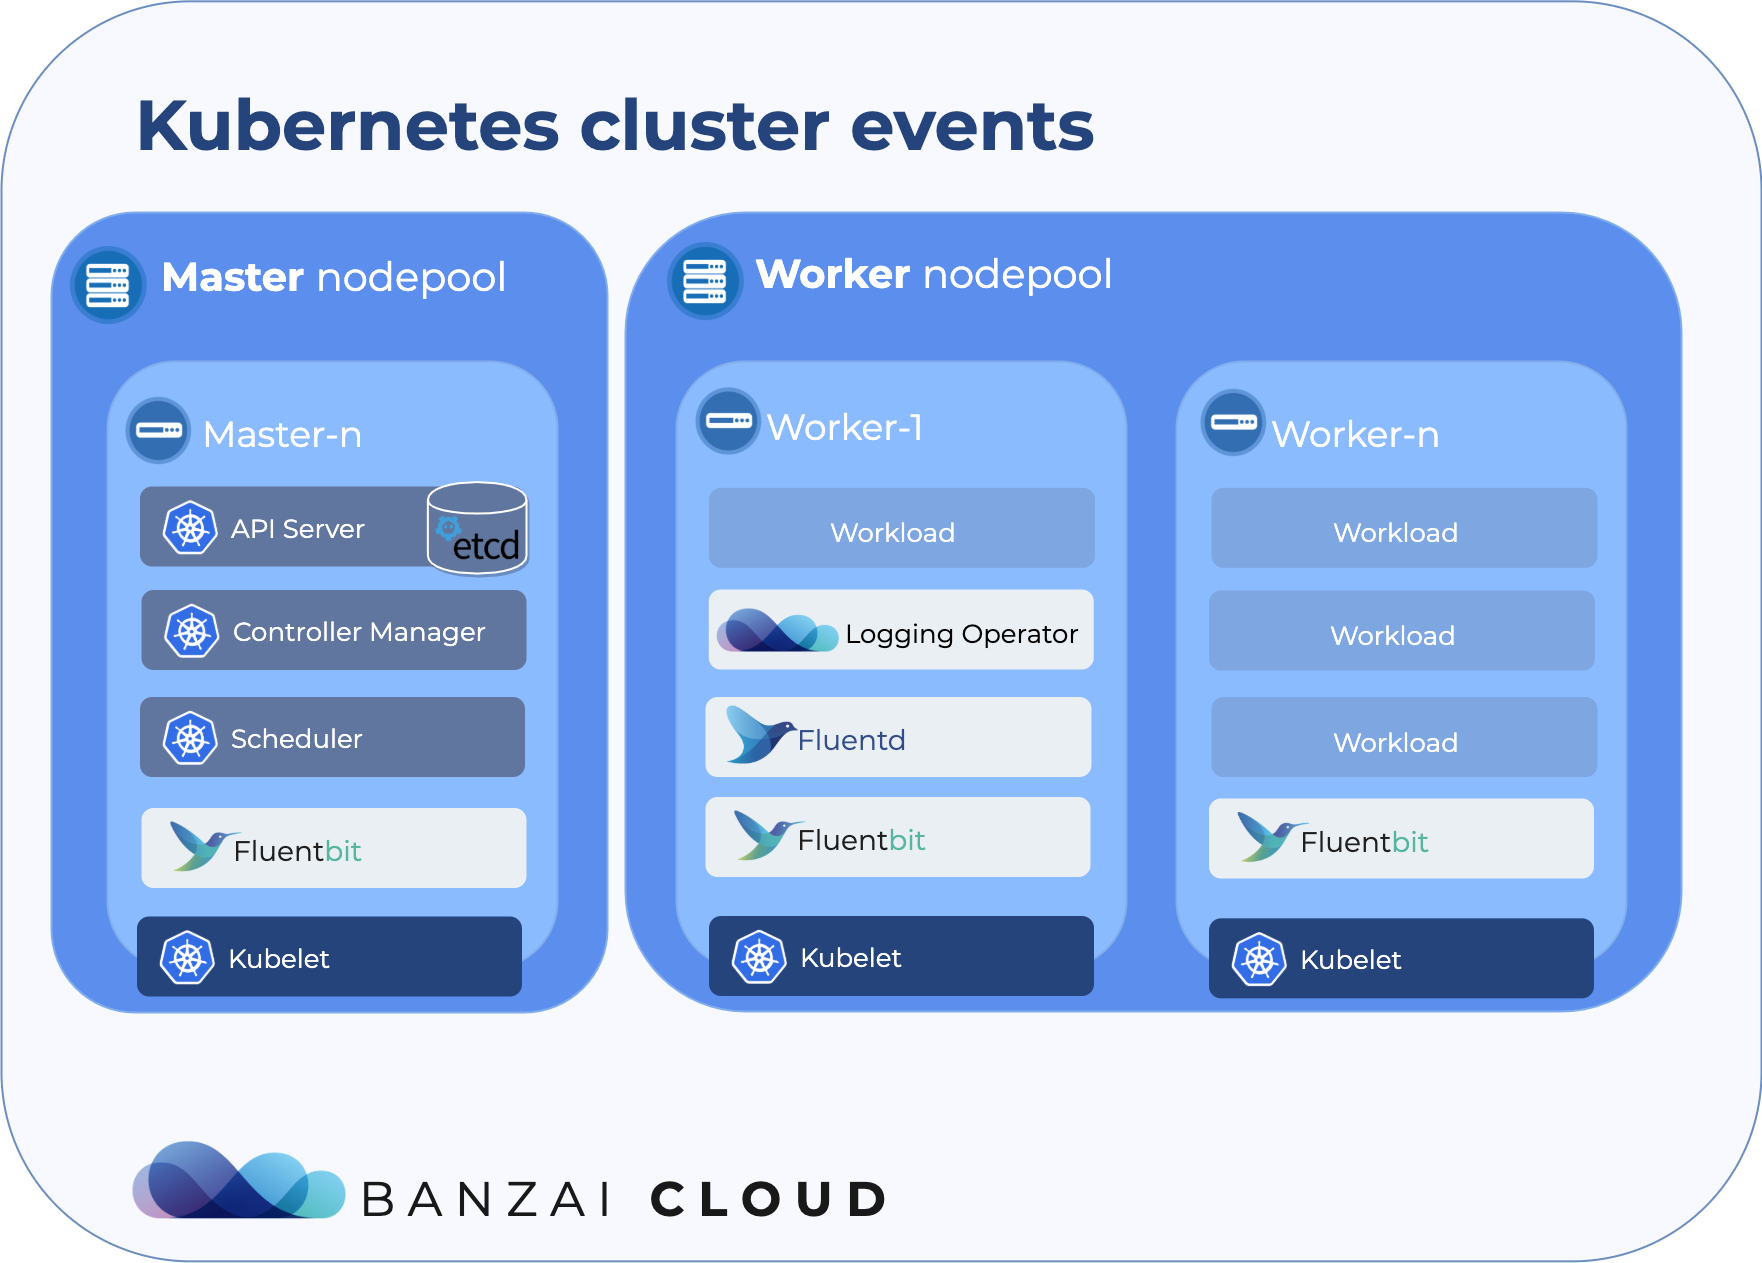
Update: Logging operator v3 (released March, 2020) 🔗︎
We’re constantly improving the logging-operator based on feature requests of our ops team and our customers. The main features of version 3.0 are:
- Log routing based on namespaces
- Excluding logs
- Select (or exclude) logs based on hosts and container names
- Logging operator documentation is now available on the Banzai Cloud site.
Check The Kubernetes logging operator reloaded post for details.
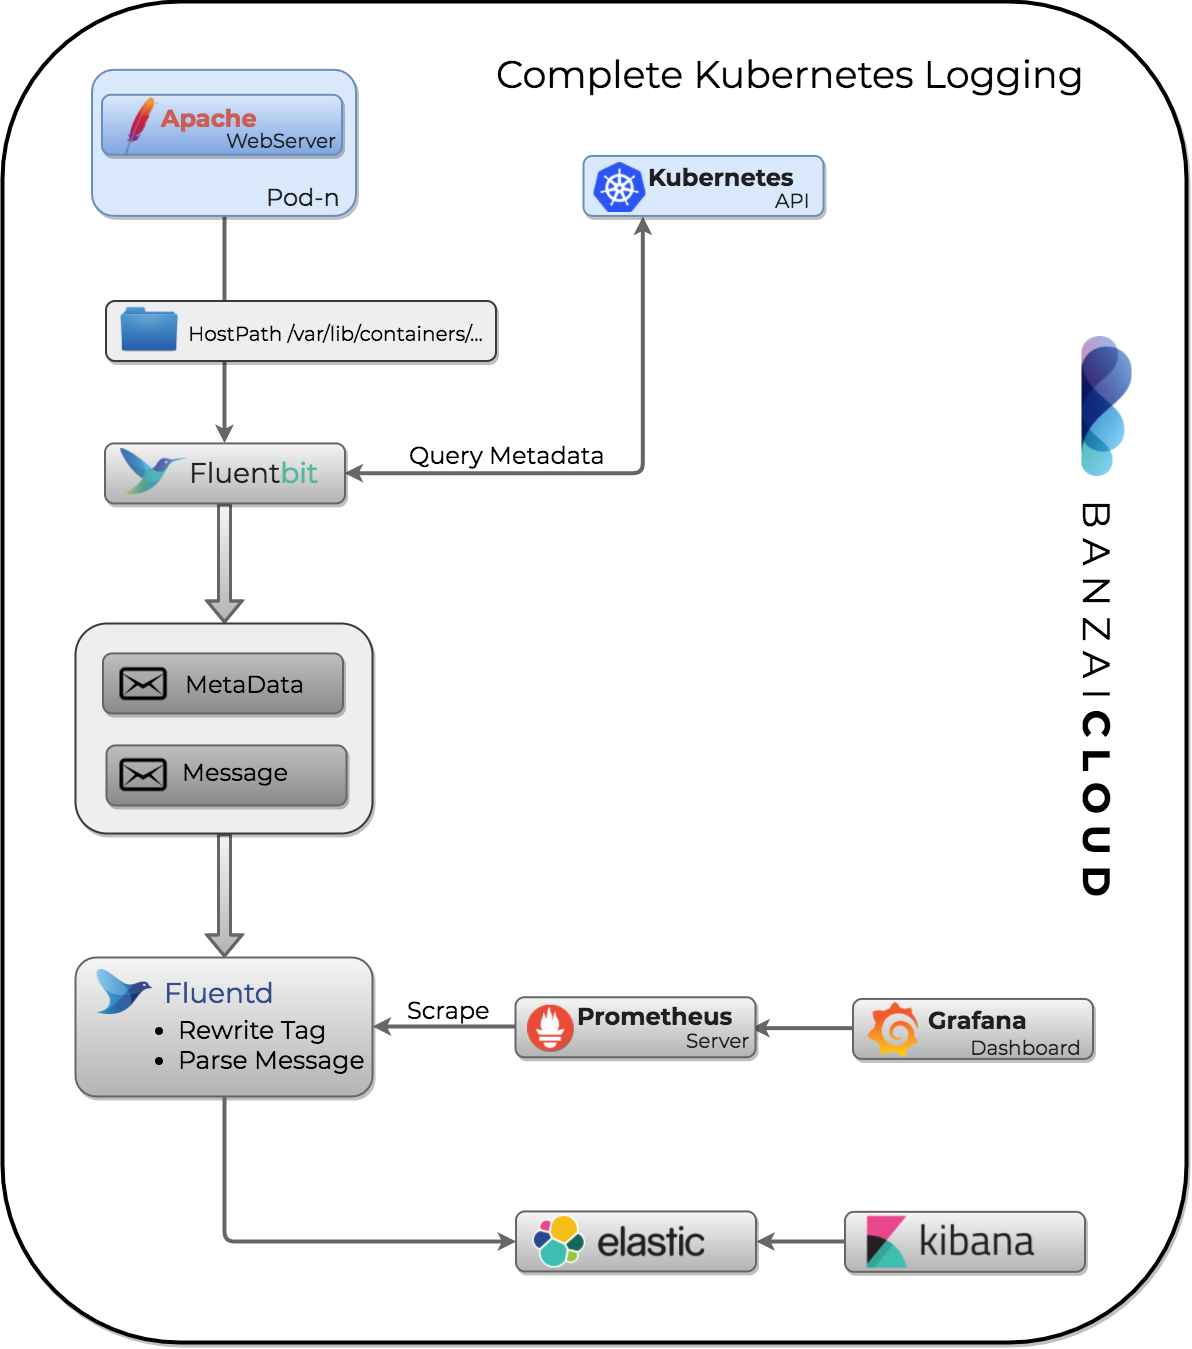
In this blog we’ll continue our series about Kubernetes logging, and cover some advanced techniques and visualizations pertaining to collected logs. Just to recap, with our open source PaaS, Pipeline, we monitor and collect/move a large number of the logs for the distributed applications we push to Kubernetes. We are expending a lot of effort to monitor large and federated clusters, and to automate these with Pipeline, so that our users receive out of the box monitoring and log collection for free.
This blog will build on previous posts, so you may want to read those as well.
Logging series:
Centralized logging under Kubernetes
Secure logging on Kubernetes with Fluentd and Fluent Bit
Advanced logging on Kubernetes
Monitoring series:
Monitoring Apache Spark with Prometheus
Monitoring multiple federated clusters with Prometheus - the secure way
Application monitoring with Prometheus and Pipeline
Building a cloud cost management system on top of Prometheus
Monitoring Spark with Prometheus, reloaded
Collecting logs 🔗︎
Logs are usually collected for debugging and auditing purposes. However, since the emergence of microservices and containerization, it’s become increasingly time-consuming to manually check and analyze logs. This is one of the main reasons why structured logging is becoming an industry standard. Nearly every language has it’s own logging library to help developers create clean, well structured logs. Under ideal circumstances, you design logs in the project’s design phase, the same way you architect its other components. Because we’ll be focusing on Kubernetes and Fluentd, there are several logging libraries that can help us.
Logging libraries with Fluentd support Go - Fluent (official) Go - Logrus Python - Fluent (official) Java - Fluent (official)
Needless to say, we often don’t have the luxury of rewriting a legacy application to produce structured logs - this is when a little tooling comes in handy.
Parsing logs 🔗︎
Sometimes we can’t change the logging framework of our application, and we need to use a standard output with clear text messages. These parsers can be custom plugins like the MySQL slow-query log or a simple Regexp like the apache access log. Note that fluentd and fluent-bit can parse raw inputs, as well. To get the hang of it, you can start with some of the official options.
Example Apache parse config
expression /^(?<host>[^ ]*) [^ ]* (?<user>[^ ]*) \[(?<time>[^\]]*)\] "(?<method>\S+)(?: +(?<path>[^ ]*) +\S*)?" (?<code>[^ ]*) (?<size>[^ ]*)(?: "(?<referer>[^\"]*)" "(?<agent>[^\"]*)")?$/
time_format %d/%b/%Y:%H:%M:%S %z
The problem, now, is how to identify the different log messages; applying regexp to each message would cause enormous overhead. Instead of that, we’ll modify the metadata to route different types of messages to different filters.
In the Fluent ecosystem, log messages are routed by their
Taglabel. Tags are dot separated hierarchical metadata labels.
Filtering messages based on app labels 🔗︎
Kubernetes helps us filter messages based on app labels; because we’re running Pods on our cluster, we’re able to add metadata to containers. One of the most common
labels is app or application. As fluent-bit enriches the log messages with the Kubernetes metadata we can use that to identify our log. Changes to the routing tags of fluentd messages can be handled with a great plugin called rewrite_tag_filter.
Make sure you name your tags carefully to make efficient log flows. Naming is done in accordance with specific needs, however, an acceptable generic template we can use is: $app_name.$cluster_name.$other_information.
Global variable is a useful Helm feature you can read about here
Here’s an example of a relabel config that uses the app label and cluster global variable:
<match kubernetes.**>
  @type rewrite_tag_filter
  <rule>
    key $['kubernetes']['labels']['app']
    pattern ^(.+)$
    tag $1.{{ .Values.global.cluster }}
  </rule>
</match>
Example raw tag
var.log.containers.monitor-apache-5b5b9dd84c-g2gx8_default_prometheus-apache-3d1c87b16947cdd686f5964ca668041eefe4f8c0b88bc21a77a52a6b7abd1b0f.log
Example rewritten tag
apache.test.kubernetes
Good, now we have a nice, clean tag, and we can apply our parsing configuration.
<filter apache.*>
  @type parser
  format /^(?<host>[^ ]*) [^ ]* (?<user>[^ ]*) \[(?<time>[^\]]*)\] "(?<method>\S+)(?: +(?<path>[^ ]*) +\S*)?" (?<code>[^ ]*) (?<size>[^ ]*)$/
  time_format %d/%b/%Y:%H:%M:%S %z
  key_name log
</filter>
Store logs 🔗︎
After we’ve parsed logs we can ingest them into an analyzer like ElasticSearch. There are several benefits to storing logs in this way; you can create dashboards (with Kibana) for huge amounts of data. With simple queries you can check the logs from any pod or even from multiple clusters. If you don’t want to analyse your logs you can simply use file or S3 output.
Elasticsearch is a distributed, RESTful search and analytics engine.
We used a custom Helm chart from Lalamove when we installed Elasticsearch.
[~]$ git clone https://github.com/lalamove/helm-elasticsearch
[~]$ helm install helm-elasticsearchNote, to use Elasticsearch for real-life workloads, default resource limits must be significantly increased: at least a 1 GB heap size with a 2 GB memory limit.
In a default configuration there are three Master, two Data and two Client pods. You can fine tune these settings as needed. For testing purposes one Master, one Client and two data nodes is sufficient.
[~]$ kubectl get po                                                                                                                                                                                        *[master]
NAME                                  READY     STATUS    RESTARTS   AGE
elasticsearch-client-654d4894-6nlvq   1/1       Running   0          2m
elasticsearch-client-654d4894-wwk46   1/1       Running   0          2m
elasticsearch-data-0                  1/1       Running   0          4m
elasticsearch-data-1                  1/1       Running   0          4m
elasticsearch-master-0                1/1       Running   0          6m
elasticsearch-master-1                1/1       Running   0          7m
elasticsearch-master-2                1/1       Running   0          6m
After a successful deployment you can check the cluster status on the REST API.
[~]$ curl http://elasticsearch:9200/_cluster/health

{
  "cluster_name": "quarrelsome-elk",
  "status": "green",
  "timed_out": false,
  "number_of_nodes": 7,
  "number_of_data_nodes": 2,
  "active_primary_shards": 0,
  "active_shards": 0,
  "relocating_shards": 0,
  "initializing_shards": 0,
  "unassigned_shards": 0,
  "delayed_unassigned_shards": 0,
  "number_of_pending_tasks": 0,
  "number_of_in_flight_fetch": 0,
  "task_max_waiting_in_queue_millis": 0,
  "active_shards_percent_as_number": 100
}
If we configured our fluentd output to elasticsearch, we can check incoming indices as well.
[~]$ curl  http://elasticsearch:9200/_cat/indices?v

health status index               uuid                   pri rep docs.count docs.deleted store.size pri.store.size
green  open   logstash-2018.04.21 QgGbsv3AQMSwVb2hsOzW-Q   5   1       3873            0      4.1mb          2.1mb
green  open   logstash-2018.04.22 CLc8clbnQcW5hBDxrsXNNA   5   1     129811         2827    102.3mb         56.2mb
green  open   .kibana             Y3y0eh7qQ5iBQ92oRk03rw   1   1          2            0     12.4kb          6.2kb
Aggregating different log types into the same index can cause problems, so we recommend that you use index/logtype naming.
Here is an example configuration of fluentd with Elasticsearch output with log type prefixes.
<match **>
  @id elasticsearch
  @type elasticsearch
  @log_level info
  include_tag_key true
  host elasticsearch
  port 9200
  logstash_prefix ${tag}
  <buffer>
    @type file
    path /var/log/fluentd-buffers/elasticsearch.all.buffer
    flush_mode interval
    flush_interval 5s
    flush_thread_count 3
    retry_max_interval 60
    retry_forever
    retry_type exponential_backoff
    chunk_limit_size 20
    queue_limit_length 5
    overflow_action block
  </buffer>
</match>
Unfortunately, we don’t have the space to introduce you to every feature of Elasticsearch, but there are plenty of useful How-tos on its official page.
Kibana 🔗︎
There is a great Open Source tool from Elastic, named Kibana, that allows you to visualize your data. With it, you can spot anomalies and trends in a user friendly way.
Setting up kibana from the stable Helm repository is easy.
[~]$ helm install stable/kibana --name kibana --set env.ELASTICSEARCH_URL=http://elasticsearch:9200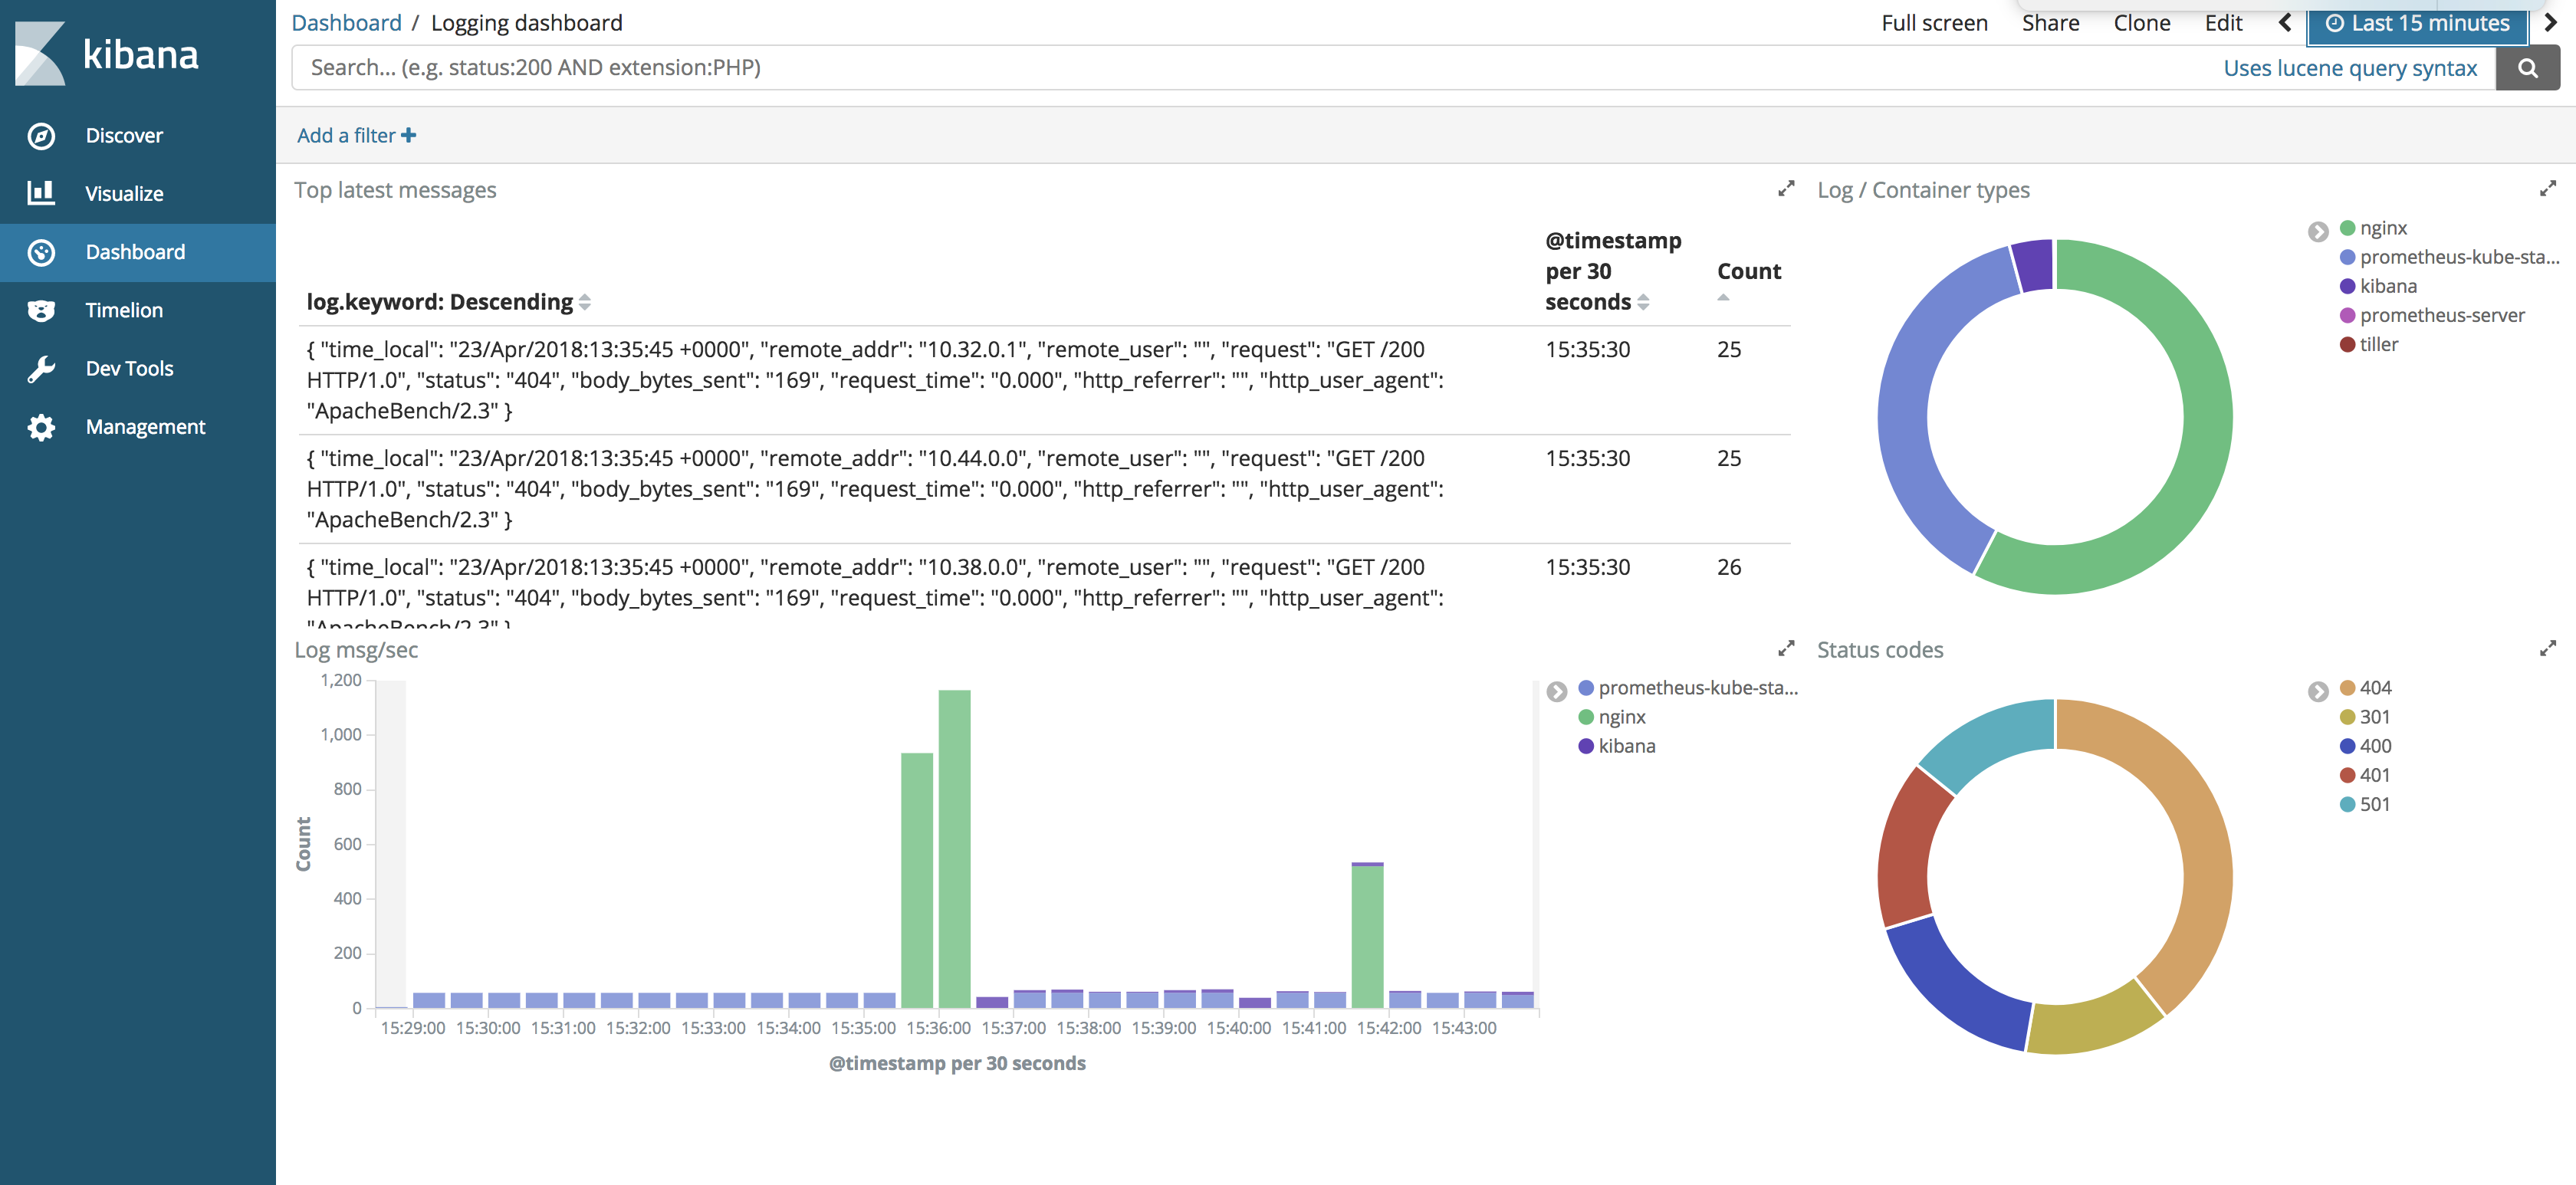
Monitoring legacy applications 🔗︎
Most of the applications we push to Kubernetes with Pipeline are legacy applications that are not monitoring friendly. These are mostly applications where you can’t create custom metric endpoints for a Prometheus exporter, but which have log messages that contain all the necessary information. To expose this information to Prometheus, you can use the prometheus input plug-in to fluentd (which we also use to monitor our logging deployments), then custom metrics can be set-up via a filter plugin.
Here is a simple example filter that counts response code by method type
<filter message>
  @type prometheus
  <metric>
    name response_code_count
    type counter
    desc The total number of requests labeled by status code and method
    key code
    <labels>
      method ${method}
      code ${code}
    </labels>
  </metric>
</filter>
Example metrics output
# TYPE response_code_count counter
# HELP response_code_count The total number of requests labeled by status code and method
response_code_count{code="200",method="GET"} 6
response_code_count{code="201",method="DELETE"} 1
That’s it. Afterward, you can use this data the same way you might use exporter output. You can even create dashboards and alerts like we did in our Prometheus related posts.
Conclusion 🔗︎
The emerging Kubernetes ecosystem has made it much easier to handle monitoring and logging in a standardized way. In this post we’ve tried to demonstrate the power of these tools without modifying a single bit of your application. We hope you enjoyed it, and we’ll continue our efforts to provide out of box solutions for your Kubernetes deployment.
Charts and configurations are available in our helm chart repository
http://kubernetes-charts.banzaicloud.com/
We also use our own container images with plugins pre-installed
Flunt-bit - upstream master branch build Fluentd - stable build with plugins


