If you’ve been reading our blog you already know that we’re passionate about observability. We are convinced that the key to operating a reliable system is to know what happens where, and the correlated ability to rapidly dissect issues as they emerge. In previous posts we’ve gone over the base components of our suggested stack, which includes Prometheus, Thanos, Fluentd, Fluentbit, and many others. We’ve created several tools and operators to ease the management of these components, like the Istio operator, Logging operator, Thanos operator as well as using some other very popular operators, like the Prometheus one.
You can read more about these components in the following blog posts:
In general, the reasoning behind these operators is simple, they ease the configuration overhead and help to maintain a desired state. However, the higher the number of components there are, the harder it is to manage and operate them in harmony (especially in observability, when multiple components and operators need to work together). It feels natural to us that the next step should be to create a tool that manages these complexities.
So what are these complexities, exactly?
Different kinds of deployments 🔗︎
The first problem is that different tools support different kinds of deployments. Today there are several types of tools deploying to production environments like Helm, Kustomize, Tanka, YAML files and so on. Moreover, these deployments are automated from a CI/CD environment which, again, can cover lots of different approaches.
In general we can distinguish three generic types of deployments:
- Manual deployment
- GitOps, CI/CD, or other automated tools
- Kubernetes reconcile loops (like operators use)
We have discussed these in this blog post about the Design choices for a declarative installer.
Configuring different tools for cooperation 🔗︎
The integration of multiple tools is another problem. Often, we’ll start with a variety of excellent tools working perfectly in their own area of application. The next step, then, is to use and manage these tools from a central location and, when investigating issues, to arrange things so that all the necessary information is at hand (and in one place). There are a few services that could conceivably help us accomplish that, but they’re usually custom-built products that preclude the use of open source solutions that are already operating smoothly.
Visibility over the operating stack 🔗︎
Our last challenge is to ensure the health of every tool we’ve configured. And because the observability stack is a complex system in of itself, we’ll need to monitor and manage it as well.
To overcome these problems companies typically choose one of two solutions. The first is to pay for a service to handle it for them. There are awesome solutions out there but as volumes grow, their associated expenses grow as well. The second approach is to use a custom solution, built on top of open source components. This approach usually requires a whole team that builds and operates these tools. We’d like to introduce a third way.
One Eye 🔗︎
One Eye wasn’t a product we ever planned to build, but evolved as the result of operating several, huge Kubernetes clusters for customers from across the globe. Additionally, we had to solve all previously existing problems without offering an even more complex solution. In the following example we’ll demonstrate how One Eye solves the problems we’ve talked about, without stepping on the toes of operation teams.
Let’s begin with some hands-on experience.
Installing One Eye 🔗︎
The simplest way to install One Eye is to register for an evaluation version and run the following one-liner.
As you might know, Cisco has recently acquired Banzai Cloud. Currently we are in a transitional period and are moving our infrastructure. Contact us so we can discuss your needs and requirements, and organize a live demo.
Evaluation downloads are temporarily suspended. Contact us to discuss your needs and requirements, and organize a live demo.
We’ll assume for the purposes of this exercise that the Kubernetes context is configured in your shell
Install a logging system 🔗︎
The first command will install the Logging Operator, the Logging Extension and a Prometheus Operator.
We’ve built several extensions for Kubernetes event and host tailers
one-eye logging install --prometheus
After a couple of minutes, check and see whether the components are installed.
$ get po
NAME                                                             READY   STATUS    RESTARTS   AGE
alertmanager-one-eye-prometheus-operato-alertmanager-0           2/2     Running   0          3m3s
one-eye-logging-extensions-f8599dd6f-kmd2x                       1/1     Running   0          107s
one-eye-logging-operator-f7c679745-7dmk5                         1/1     Running   0          114s
one-eye-prometheus-operato-operator-5d5c4fcfdc-t6lvl             2/2     Running   0          3m15s
one-eye-prometheus-operator-grafana-76c45c5559-whhlf             2/2     Running   0          3m15s
one-eye-prometheus-operator-kube-state-metrics-f45595f4c-w5w2z   1/1     Running   0          3m15s
one-eye-prometheus-operator-prometheus-node-exporter-qplrd       1/1     Running   0          3m15s
prometheus-one-eye-prometheus-operato-prometheus-0               4/4     Running   1          2m53s
You have the three operators ready for action: the Logging Operator, Prometheus Operator and the Logging Extension.
The installation process is essentially replicatable, you only need to append the
--updateflag to the command
Let’s configure the base of our logging system. First, run the following command and follow the on-screen instructions.
$ one-eye logging configure
? Configure persistent volume for buffering logs? No
# Copyright © 2020 Banzai Cloud
#
apiVersion: logging.banzaicloud.io/v1beta1
kind: Logging
metadata:
  name: one-eye
spec:
  enableRecreateWorkloadOnImmutableFieldChange: true
  controlNamespace: default
  fluentbit:
    metrics:
...

? Edit the configuration in an editor? No
? Apply the configuration? Yes
observer> resource created name: ...
? Create a new Flow? Yes
The CLI will provide a template for our Logging resource with a basic configuration.
You can edit this template and decide whether to apply it on the cluster or not. After applying
the logging resource, you can continue to create an Output and a Flow.
You can either answer
Yesto the questionnaire or start creating a new output with the CLI
The following command will help bootstrap an S3 output. Note that this is the first of several outputs that are on the way, including the very popular Elasticsearch.
$ one-eye logging configure output
? What type of output do you need? s3
? Select the namespace for your output default
? Use the following name for your output s3
? S3 Bucket banzai-one-eye
? Region of the bucket eu-west-1
? Configure authentication based on your current AWS credentials? Yes
? Save AKIXXXXXXXXXXXXXXXX to a Kubernetes secret and link it with the output Yes
# Copyright © 2020 Banzai Cloud
apiVersion: logging.banzaicloud.io/v1beta1
kind: Output
metadata:
  name: s3
  namespace: default
spec:
  # Reference docs for the output configuration:
  #   https://banzaicloud.com/docs/one-eye/logging-operator/configuration/plugins/outputs/s3
  s3:
    s3_bucket: banzai-one-eye
    s3_region: eu-west-1
    path: logs/${tag}/%Y/%m/%d/
    aws_key_id:
      valueFrom:
        secretKeyRef:
          name: s3-6bcf
          key: awsAccessKeyId
    aws_sec_key:
      valueFrom:
        secretKeyRef:
          name: s3-6bcf
          key: awsSecretAccessKey

? Edit the configuration in an editor? No
? Apply the configuration? Yes
observer> resource created name: s3...
As would be expected, the S3 output requires an Amazon credential to work. If you have your Amazon credential configured in your environment, the CLI will ask you if you want to use it to access the bucket. When you choose yes the CLI will automatically create a Kubernetes secret with your Amazon Key and Secret. After specifying bucket name and region, the generated template is ready for use (or customization), and will also include the Secret name and bucket information.
Now we have an output, so let’s configure a flow! Once the basic template provides us with an empty flow, you can customize its match section and add filters from the supported filter list.
$ one-eye logging configure flow
? Select the namespace for your flow default
Available Outputs: [s3]
? Select an output s3
? Give a name for your flow my-flow
# Copyright © 2020 Banzai Cloud
#
# This is a minimalistic default configuration for a simple logging flow,
# that collects all events from it's own namespace (Flow) or from all namespaces (ClusterFlow).
#
# For further configuration options please check out the reference docs:
#   https://banzaicloud.com/docs/one-eye/logging-operator/configuration/crds/#flows-clusterflows
#
# For more information on how the match directive works please check out:
#   https://banzaicloud.com/docs/one-eye/logging-operator/log-routing/
#
apiVersion: logging.banzaicloud.io/v1beta1
kind: Flow
metadata:
  name: my-flow
  namespace: default
spec:
  filters:
  # tag normalizer changes default kubernetes tags coming from fluentbit to the following format: namespace.pod.container
  # https://banzaicloud.com/docs/one-eye/logging-operator/configuration/plugins/filters/tagnormaliser/
  - tag_normaliser: {}

  match:
  # a select without restrictions will forward all events to the outputRefs
  - select: {}

  outputRefs:
    - s3

? Edit the configuration in an editor? No
? Apply the configuration? Yes
observer> resource created name: my-flow...
And that’s it! After applying the yaml, the logs should be flowing to the S3 bucket.
Visualize your logging flows 🔗︎
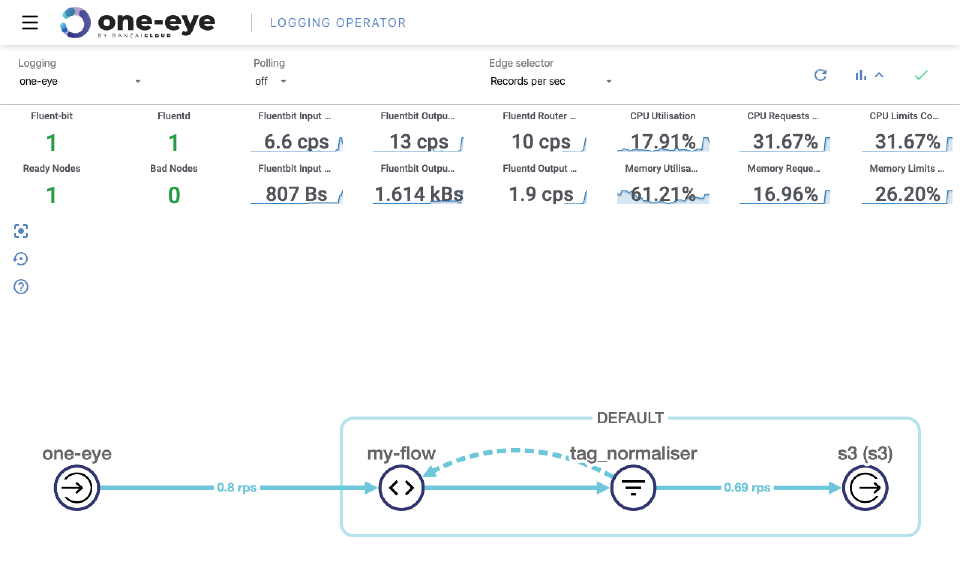
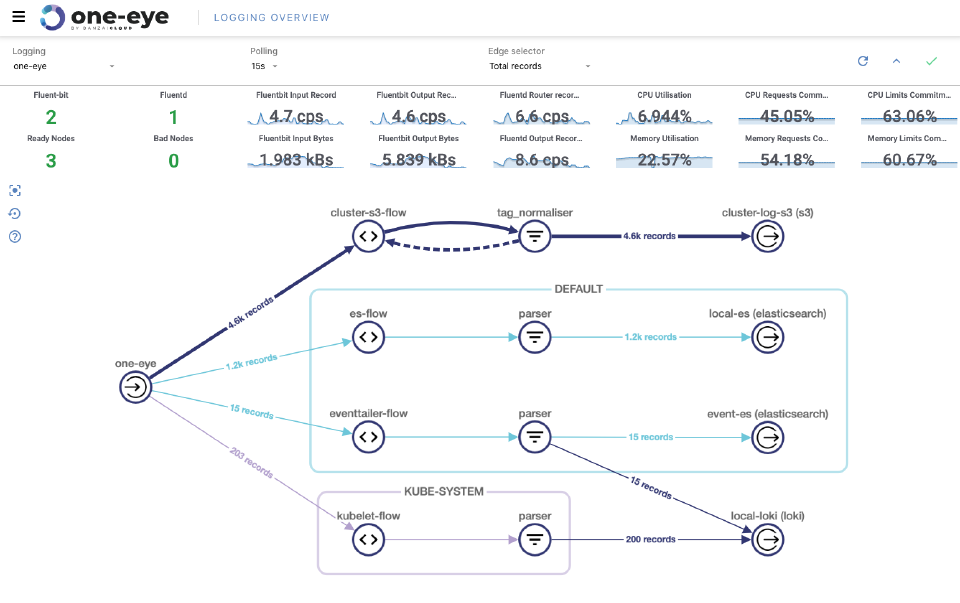
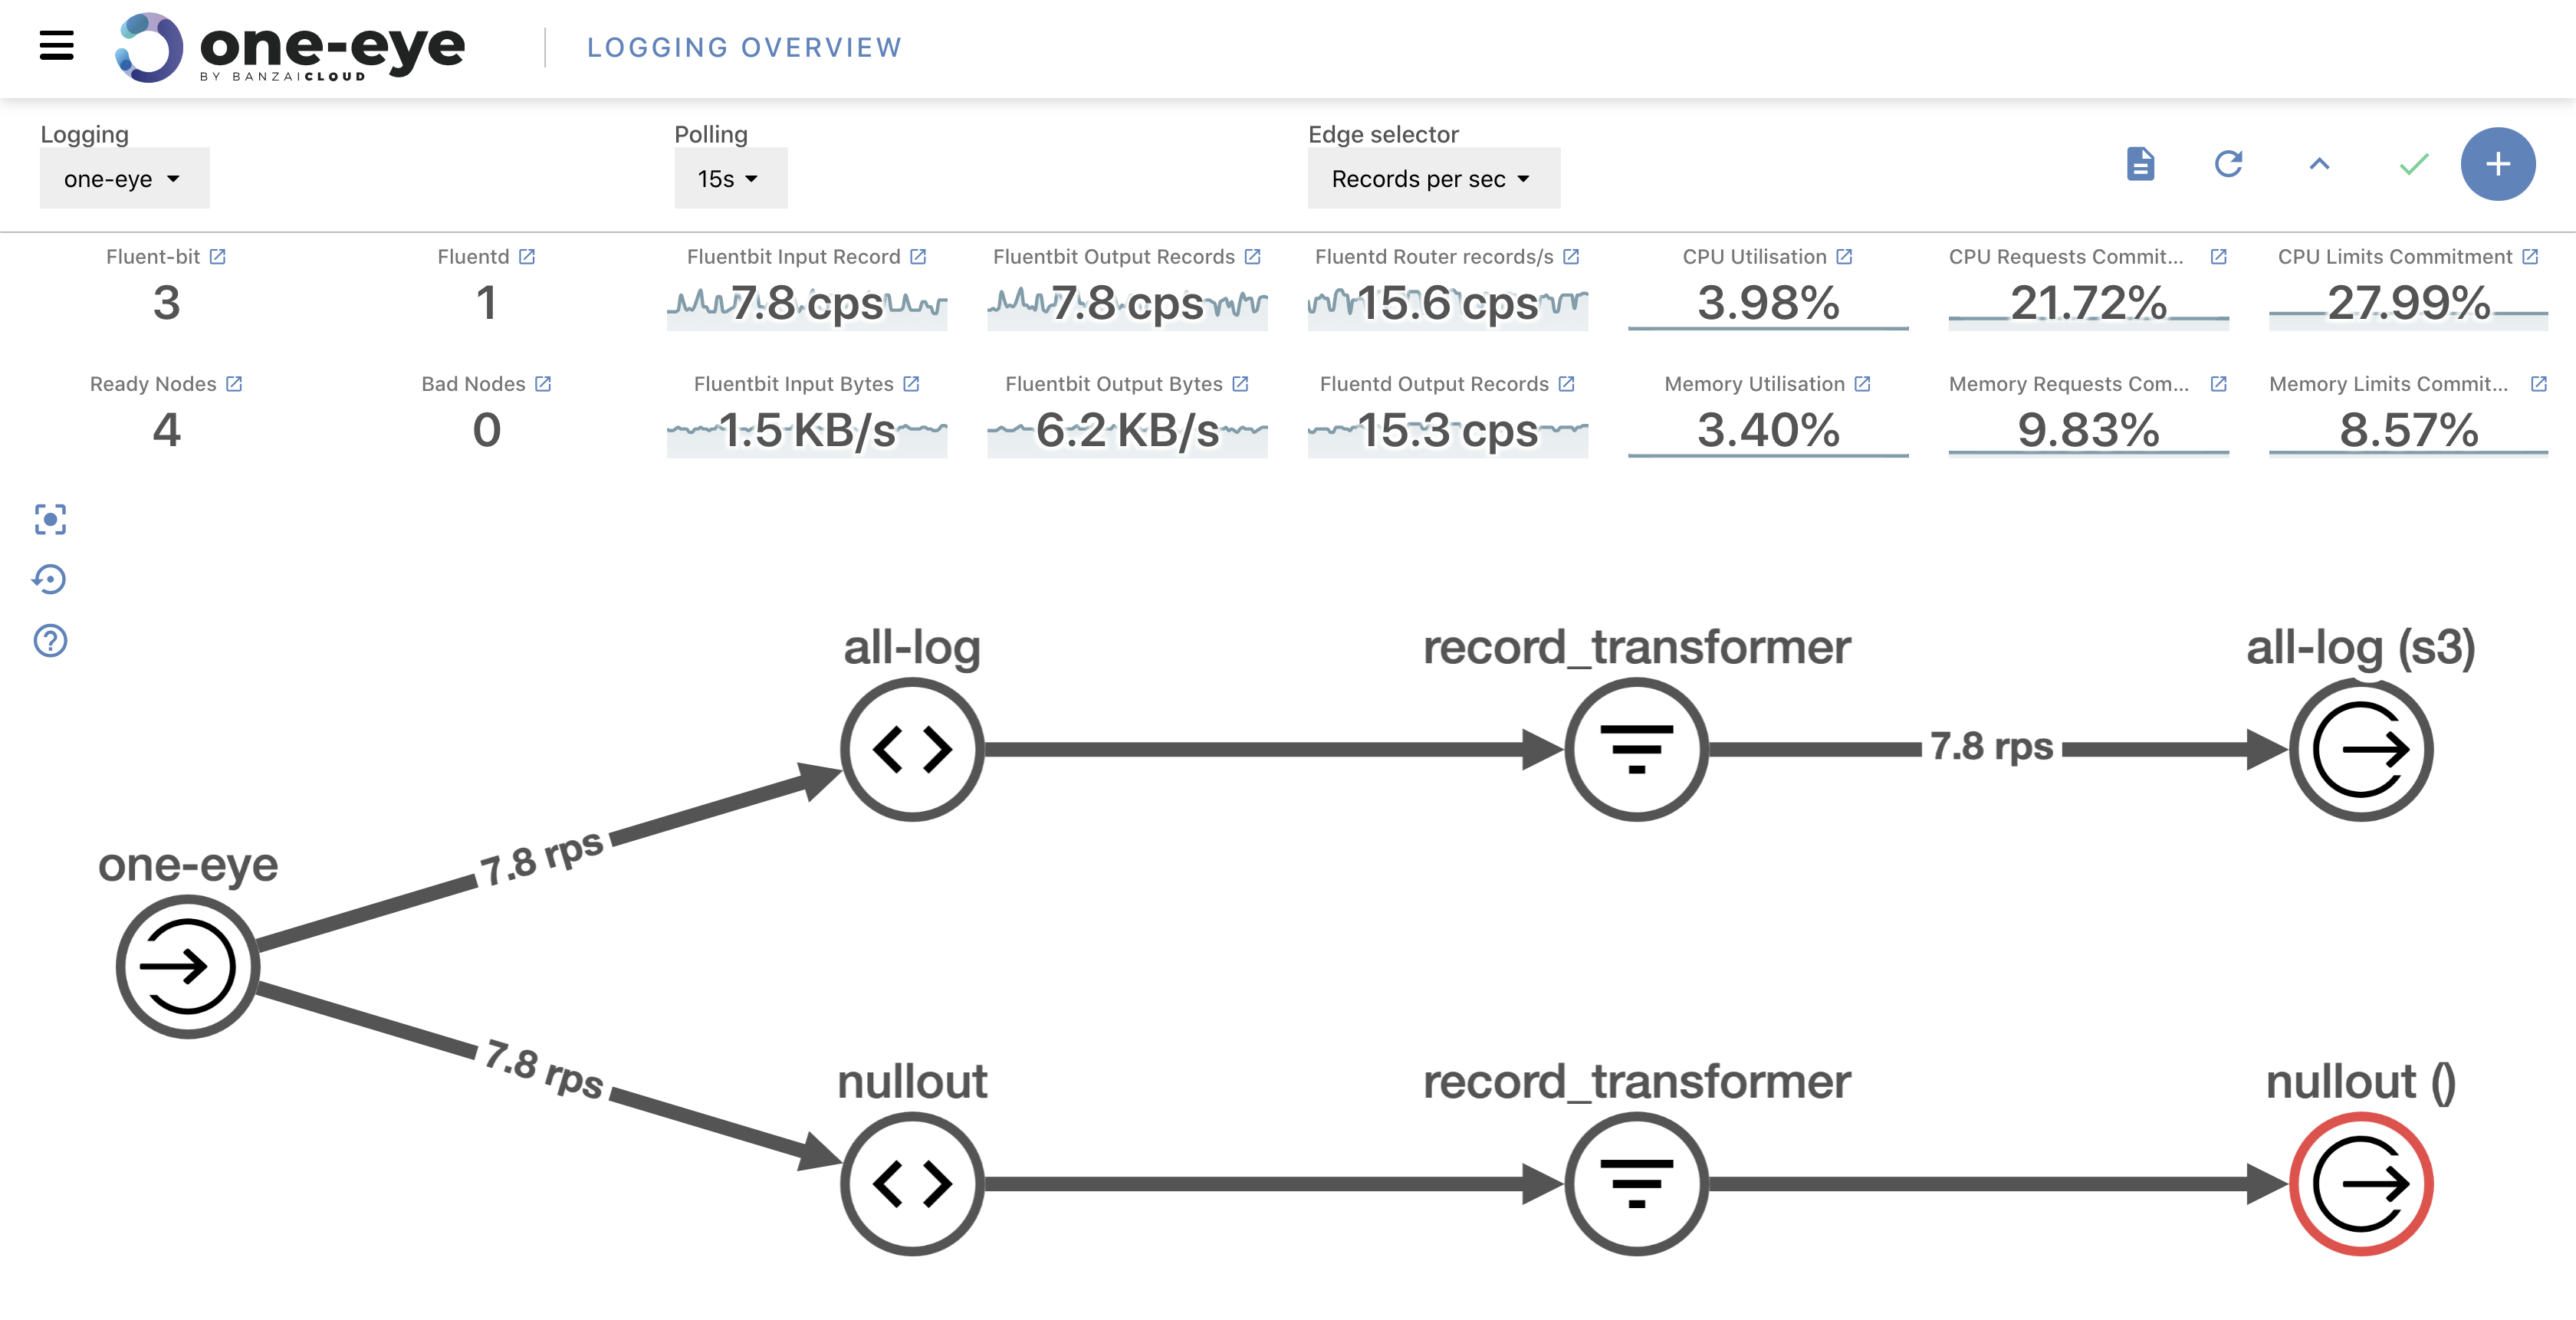
When you get familiar with the basics of log routing, it’s natural to want to create more and more flows and outputs for a range of purposes. After a while, you’ll end up handling tens of outputs with even more flows. But don’t worry, One Eye helps here as well. The easiest way to organize your stack is to visualize it.
Install the One Eye UI via the CLI.
$ one-eye ingress install --update
This commands installs an nginx ingress and the One Eye UI. This ingress is exposed to localhost by default, but you can connect to it via One Eye.
one-eye ingress connect
Using One Eye from a CICD pipeline 🔗︎
If you want to start experimenting with the One Eye CLI that’s fine, but for production you need repeatable deployments without user interaction. That sort of thing is usually handled by a CI/CD solution. For its declarative configuration, One Eye defines a configuration file called Observer.
one-eye reconcile --from-file observer.yaml
With this command you can define whatever observability stack you need.
Note: the next step is to handle directories that apply yamls for you, so you don’t have to rely any other tool
Using One Eye as an Operator 🔗︎
Last but not least, One Eye can be used as an operator as well. In operator mode it works just like any other operator, and watches the Observer resource to reconcile other components.
Logging Extensions 🔗︎
Because Logging Operator already had a fairly big code base and broad functionality, we decided to handle our other needs in another operator called Logging Extensions. The idea was to keep the scope of the logging operator as narrow as possible, while also providing ways to handle host logs and other Kubernetes-related functions.
(We don’t have time to dig deeper into this topic, but we’ll discuss it in the future.)
Among others, Logging Extensions handles:
- Host logs
- Kubernetes events
- Non-stdout logs
Drilling into problems 🔗︎
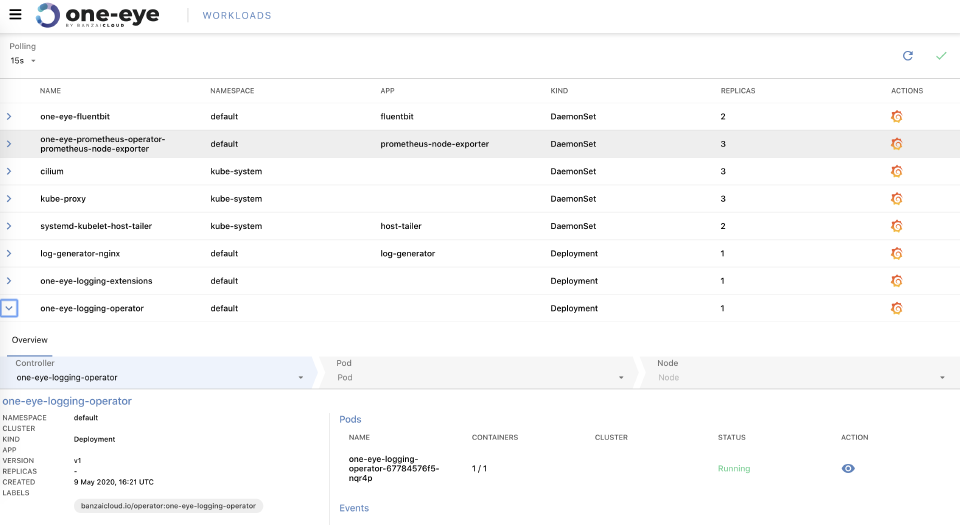
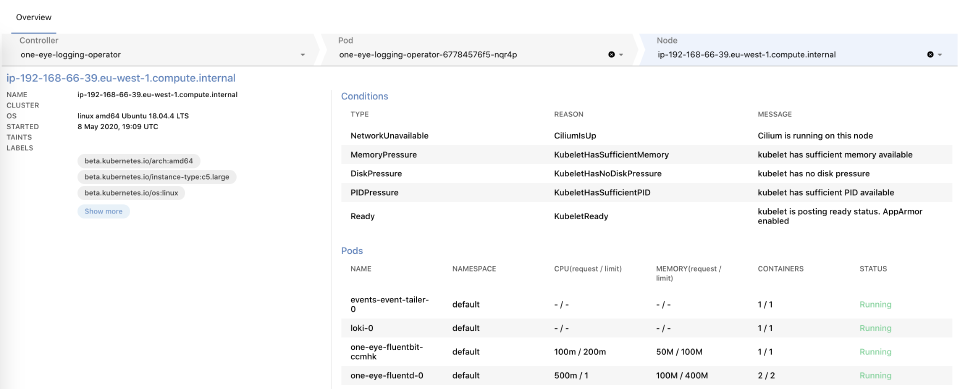
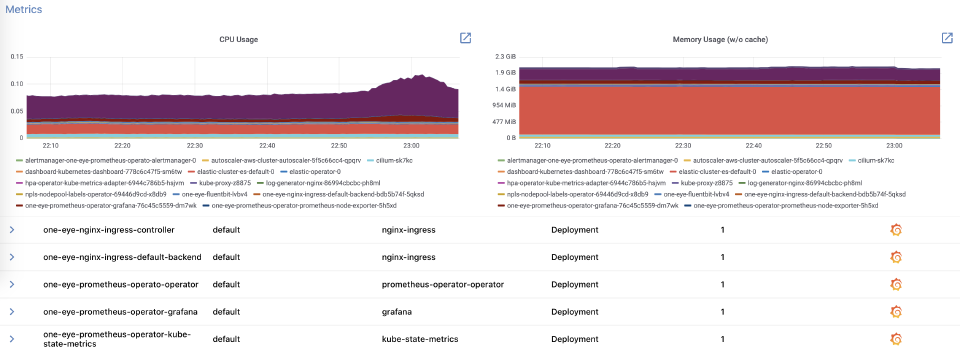
While this blog is already long enough, let’s touch briefly on a new feature that comes with this release, “drill down”. One Eye provides a “drill down” view of pods and nodes on the Kubernetes cluster. Essentially, you can trace an issue down from a top-level layer by navigating deeper into the stack, so check the status and other vitally important metrics of your Kubernetes resources.
Future plans for the next releases 🔗︎
The first GA version of One Eye covers plenty of use cases, but lots more are coming. For example:
- Interactive Flow and Output management
- Correlating logs and metrics into a single visualization
- Multi cluster configuration
Stay tuned for the next release and let us know how One Eye works for you.


