
Banzai Cloud One Eye (One Eye) brings observability for multi-cluster Kubernetes infrastructures to automate the collection, correlation, and storage of logs and metrics.
One Eye includes Prometheus, the Banzai Cloud Logging operator, Thanos, and many other components needed to run, maintain, and operate a logging infrastructure in the cloud. All components are automatically installed, configured, and managed in order to give your enterprise an observability layer for Kubernetes.
Banzai Cloud One Eye provides scalable, unified, and automated log and metric collection for your entire Kubernetes infrastructure, including cluster nodes, pods, applications, and services. It works on a variety of Kubernetes infrastructures, including on-premises solutions and cloud providers like AWS, Azure, Google Cloud, or Alibaba.
What’s more, Banzai Cloud One Eye natively supports multi-cluster and hybrid-cluster scenarios, and gives your teams a single location to query and analyze all the collected data, no matter if they need it for devops, maintenance, or compliance reasons.
Built on Prometheus, Thanos, Grafana, Loki, Fluentd, and Fluent Bit. Managed by the Banzai Cloud Logging operator and Banzai Cloud Thanos operator.
Feature highlights 🔗︎
- Manage your logging infrastructure through a web UI, CLI, or declaratively
- Visualize your logging infrastructure
- Drill-down through alerts, services, workloads, pod logs, and other sources
- Collect logs and metrics from pods and host files
- Collect Kubernetes events
- Enable encrypted communication between the components
- Multicluster metrics: collect your metrics to a single cluster from multiple peer clusters
Architecture 🔗︎
One Eye incorporates a number of carefully selected and well-known components, and manages their configuration to integrate them into a coherent system that allows you to setup an enterprise-grade logging infrastructure within minutes.
Manage your logging infrastructure 🔗︎
Choose the method to manage your logging infrastructure that best fits your projects maturity, from Day 0 to Day 2. One Eye allows you to manage your cloud logging infrastructure using:
- a command-line tool,
- a web interface, or
- declaratively as an operator.
Visualize your logging infrastructure 🔗︎
One Eye visualizes your logging infrastructure: your logging sources, flows, and outputs. In addition, you can access all the relevant metrics, logs, and other information with a few clicks.
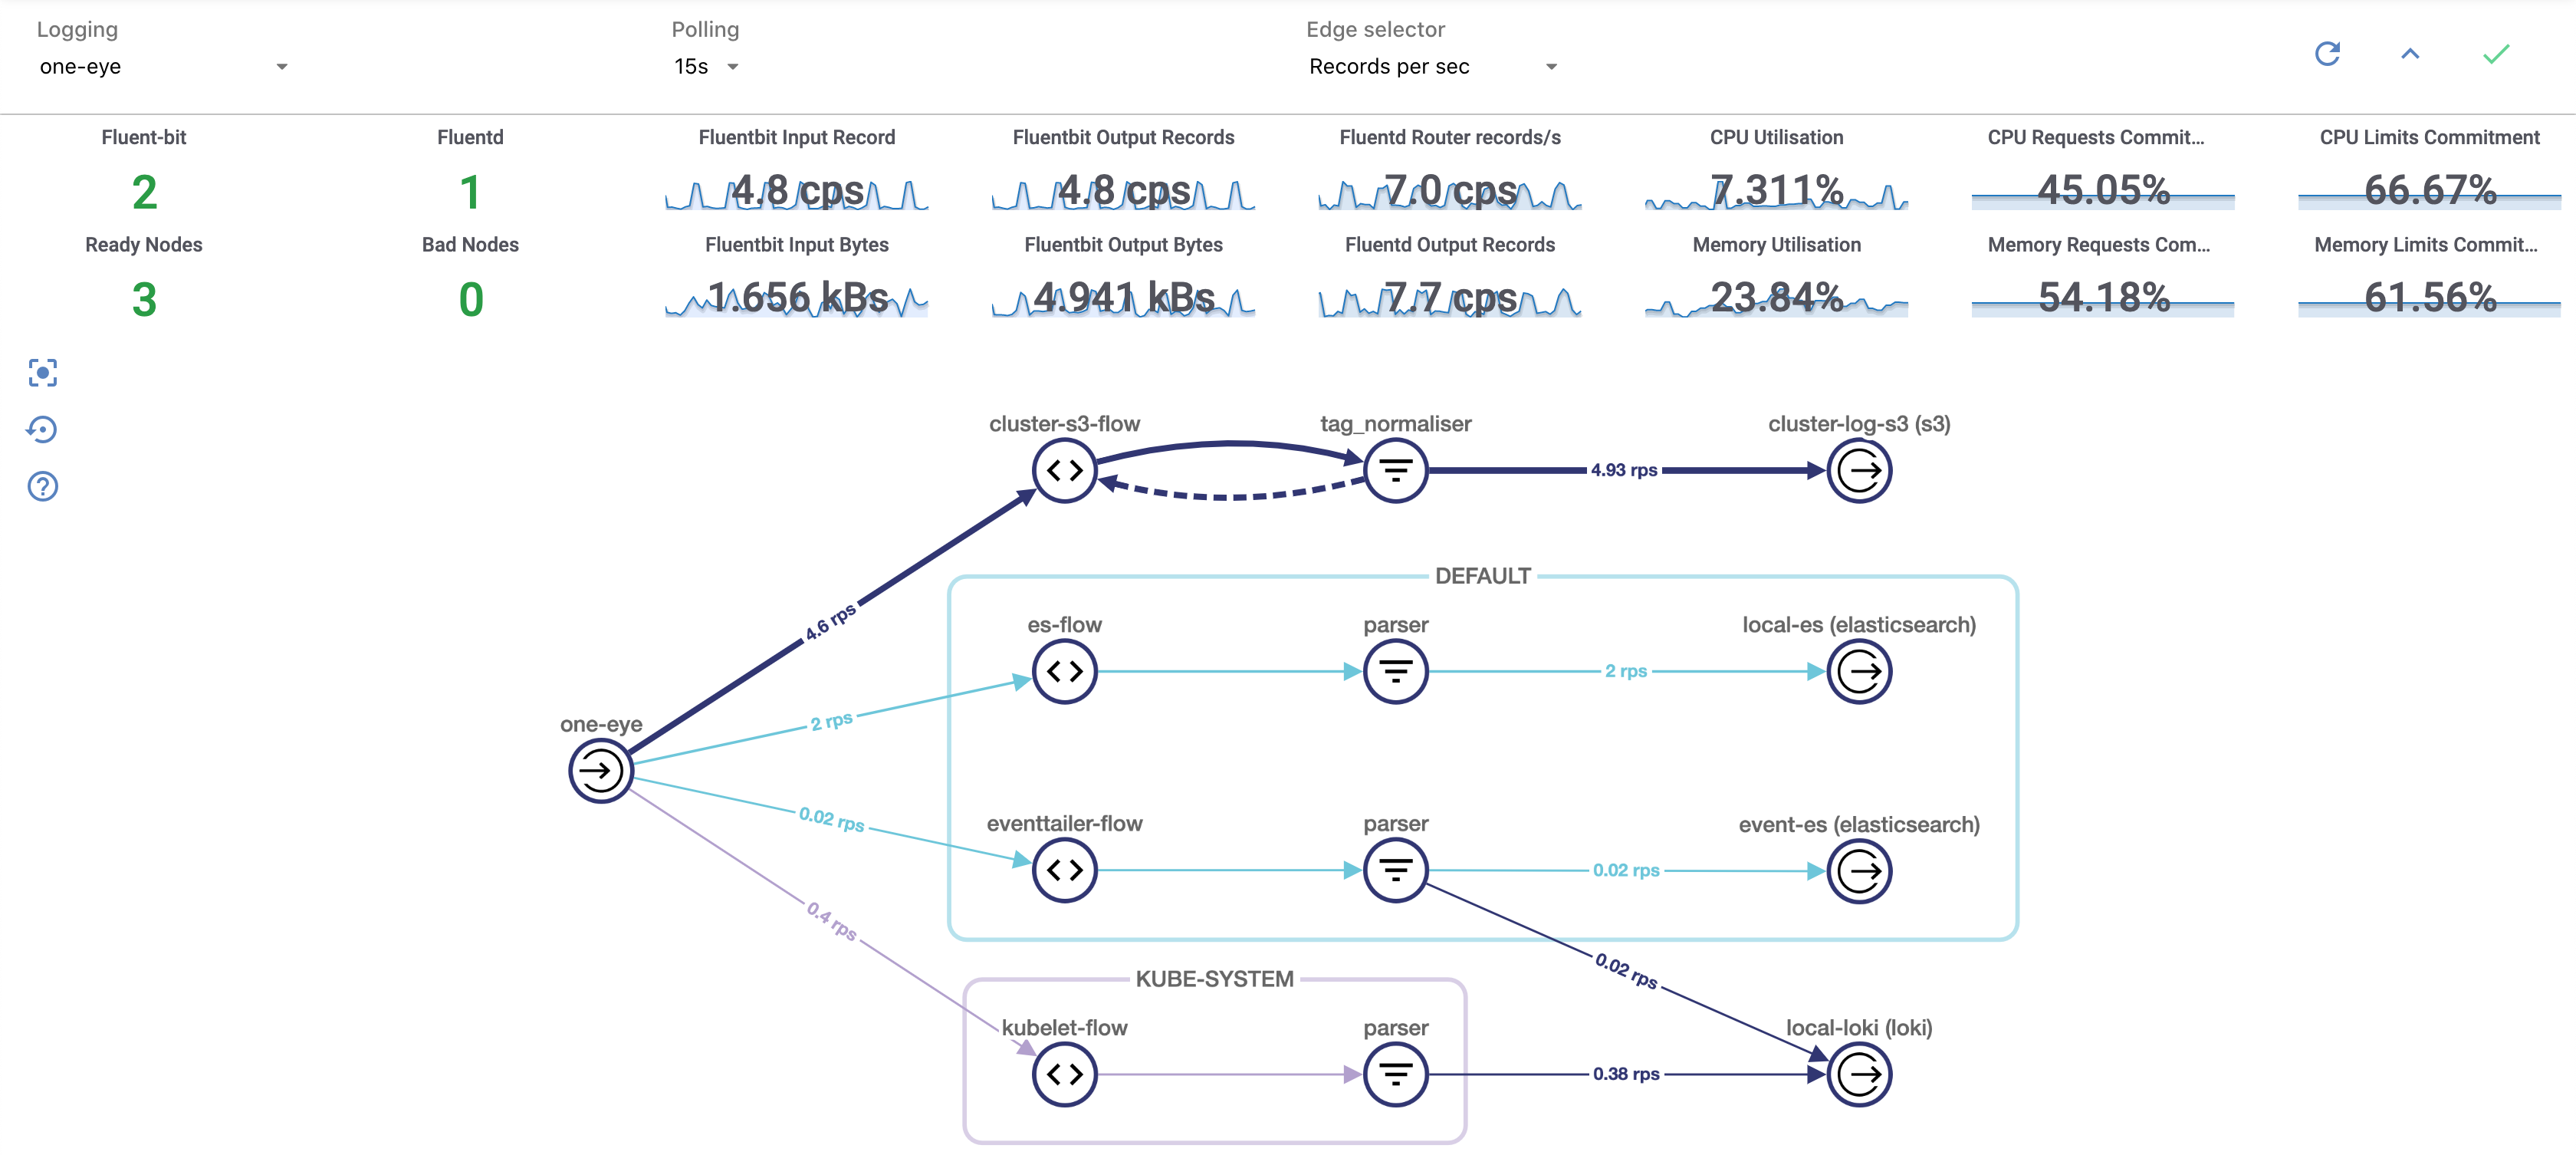
For details, see Configuration overview.
Drill-down to find problems fast 🔗︎
Using the One Eye web UI, you can drill-down from the service, workload, or alert level, and trace back an issue by navigating deeper in the stack, and see the status, events, and most important metrics of your Kubernetes controllers, pods, and nodes. For details, see Browsing logs, events, and other information.
Collect logs from a wide range of sources 🔗︎
One Eye allows you to collect a wide range of logs and metrics to give you the best possible overview of your infrastructure. In addition to application logs, it can collect Kubernetes events, host and pod logs, including the Fluentd pod logs, as well as logs from custom host files, like audit logs, systemd journals, and kubelet logs. For details, see Configure your logging infrastructure.
Enable encrypted communication 🔗︎
One Eye provides a simple way to enable SSL encryption between the components of your logging infrastructure, and automates its management using cert-manager: it creates the custom resources required for TLS certificates, and renews the configuration of Fluentd and Fluent Bit accordingly. For details, see TLS-encrypted log transfer.
Multicluster metrics 🔗︎
One Eye allows you to attach multiple peer clusters to a central observer cluster to make your metrics available centrally, and store in object storage in a cost and storage-efficient way. One Eye automates several steps of connecting and maintaining the peer clusters, making it possible to operate your monitoring infrastructure with a low overhead. For details on how One Eye collects metrics from multiple clusters, see Multicluster metrics.


