


Monitoring series:
Monitoring Apache Spark with Prometheus
Monitoring multiple federated clusters with Prometheus - the secure way
Application monitoring with Prometheus and Pipeline
Building a cloud cost management system on top of Prometheus
Monitoring Spark with Prometheus, reloaded
Hands on Thanos
Monitoring Vault on Kubernetes using Cloud Native technologies
At Banzai Cloud we are building a feature rich enterprise-grade application platform, built for containers on top of Kubernetes, called Pipeline. Pipeline provides all the tools our users need to operate large Kubernetes clusters efficiently, such as:
If you’ve read through the Monitoring series listed above, you already know all about Monitoring Apache Spark with Prometheus, and what led to the birth of our Externalized Spark Prometheus Sink, which is a separate library that lives outside of the Spark codebase. Our belief that there was demand to be able to push metrics from Spark to Prometheus proved correct, since, as soon as we released spark-metrics we began receiving feedback based on actual usage. We believe that taking bug reports seriously, taking criticism in the manner it was intended, and incorporating ideas from the community, make our products even better.
In this post we’ll discuss two new features we added based on user requests:
- pre-processing Spark metric names prior to pushing the metrics to
Prometheus - adding custom metadata to metrics through labels
Before we dvelve into the specifics of those features, let’s look at why we made these changes.
Spark metric names 🔗︎
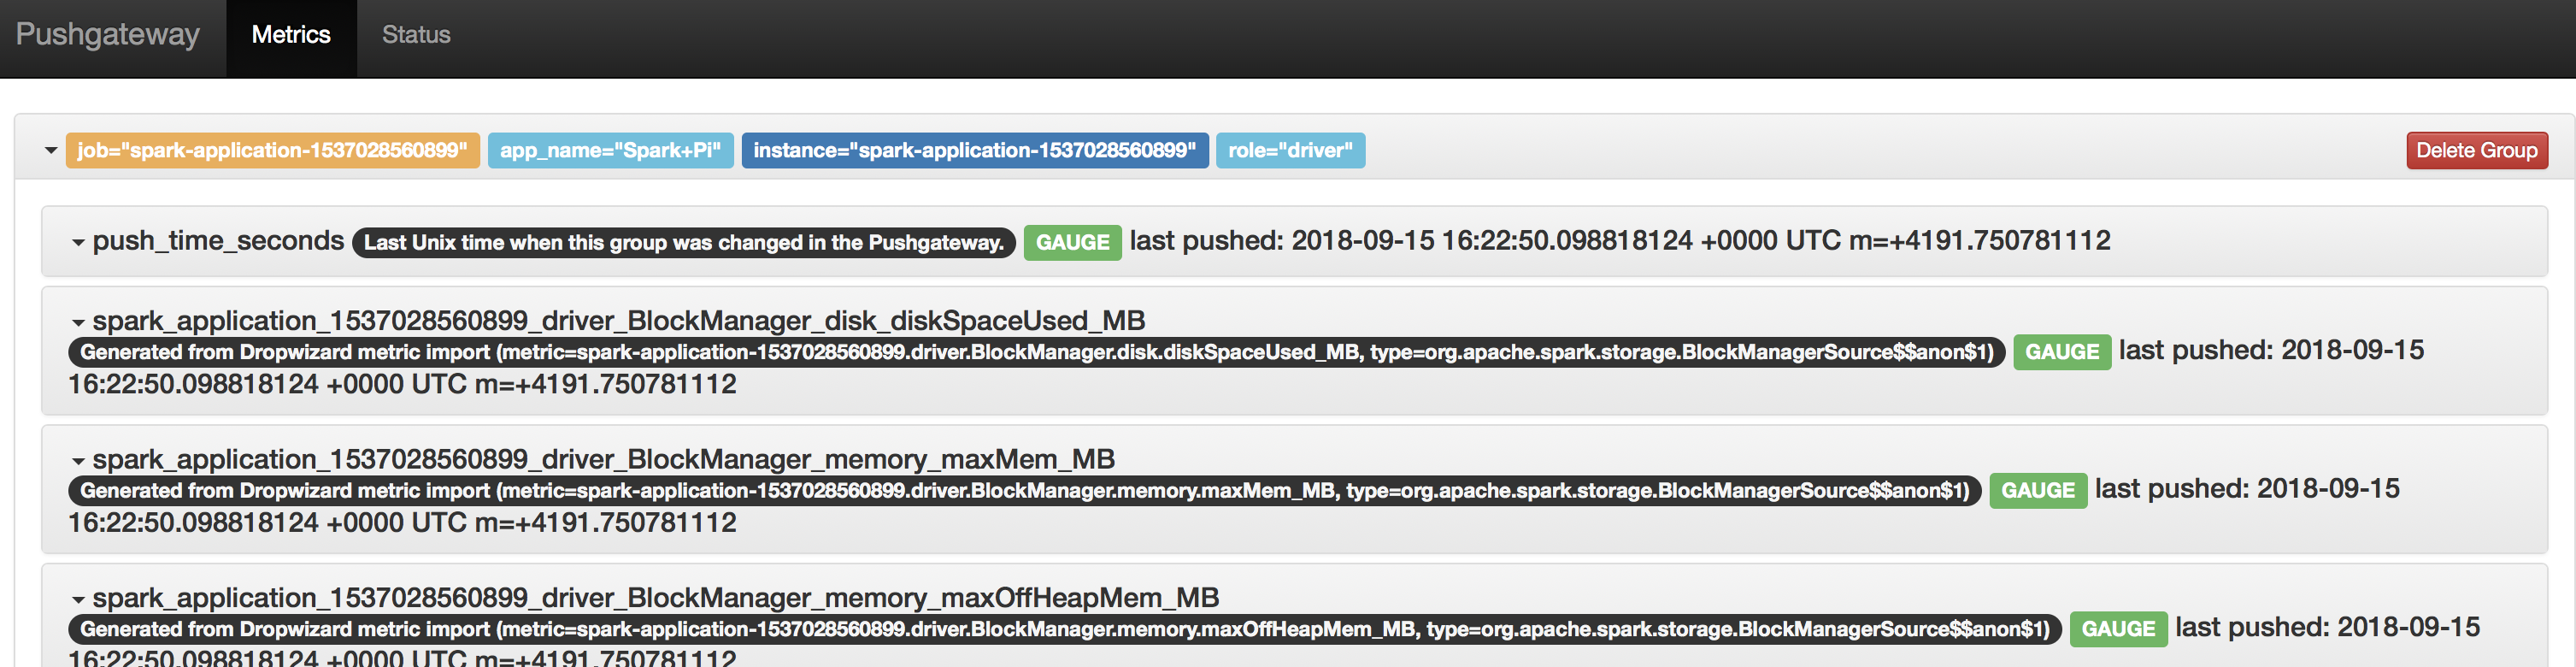
In accordance with accepted practice, in Prometheus the metric name specifies the general feature of a system that is measured. Spark publishes metrics with names that include the application id (spark.app.id) of the executed Spark application. The application id bears the start time of each application, thus it changes each time an application runs. Since these application ids are unique to their applications, run metric names are unique to the application being run. As you can see, this is not in line with accepted practice in regards to metric names in Prometheus.
Name metrics published by Spark are not in line with this, but rather identify a Spark application execution, and the name of the same metric changes with each execution of the same Spark application. This is due to the afformentioned fact that Spark includes the spark.app.id value of the running application in the names of its published metrics.
This makes it difficult to write queries to source aggregate metrics of a spark application from Prometheus for Grafana dashboards.
This issue can be overcome with Prometheus re-labeling. However, this might not be an option for everyone, so we need to be able to process metric names in the Spark Prometheus Sink before publishing to Prometheus.
Custom metric metadata 🔗︎
Labels set on metrics published by Spark are specific to the executed application and the attributes of a metric. In order to have more flexibility in querying Prometheus, we need the ability to add custom metadata to the metrics published to Prometheus via labels.
How to configure metric name pre-precosseing 🔗︎
Metric name pre-processing is based on regular expressions. A regular expression has to be set so that it is matched against each metric name. A replacement string has to be configured, as well, which replaces the matching groups defined in the regular expression if the regular exprerssion matches the metric name.
Let’s explore this through an example.
Metrics with no metric name pre-processing applied:
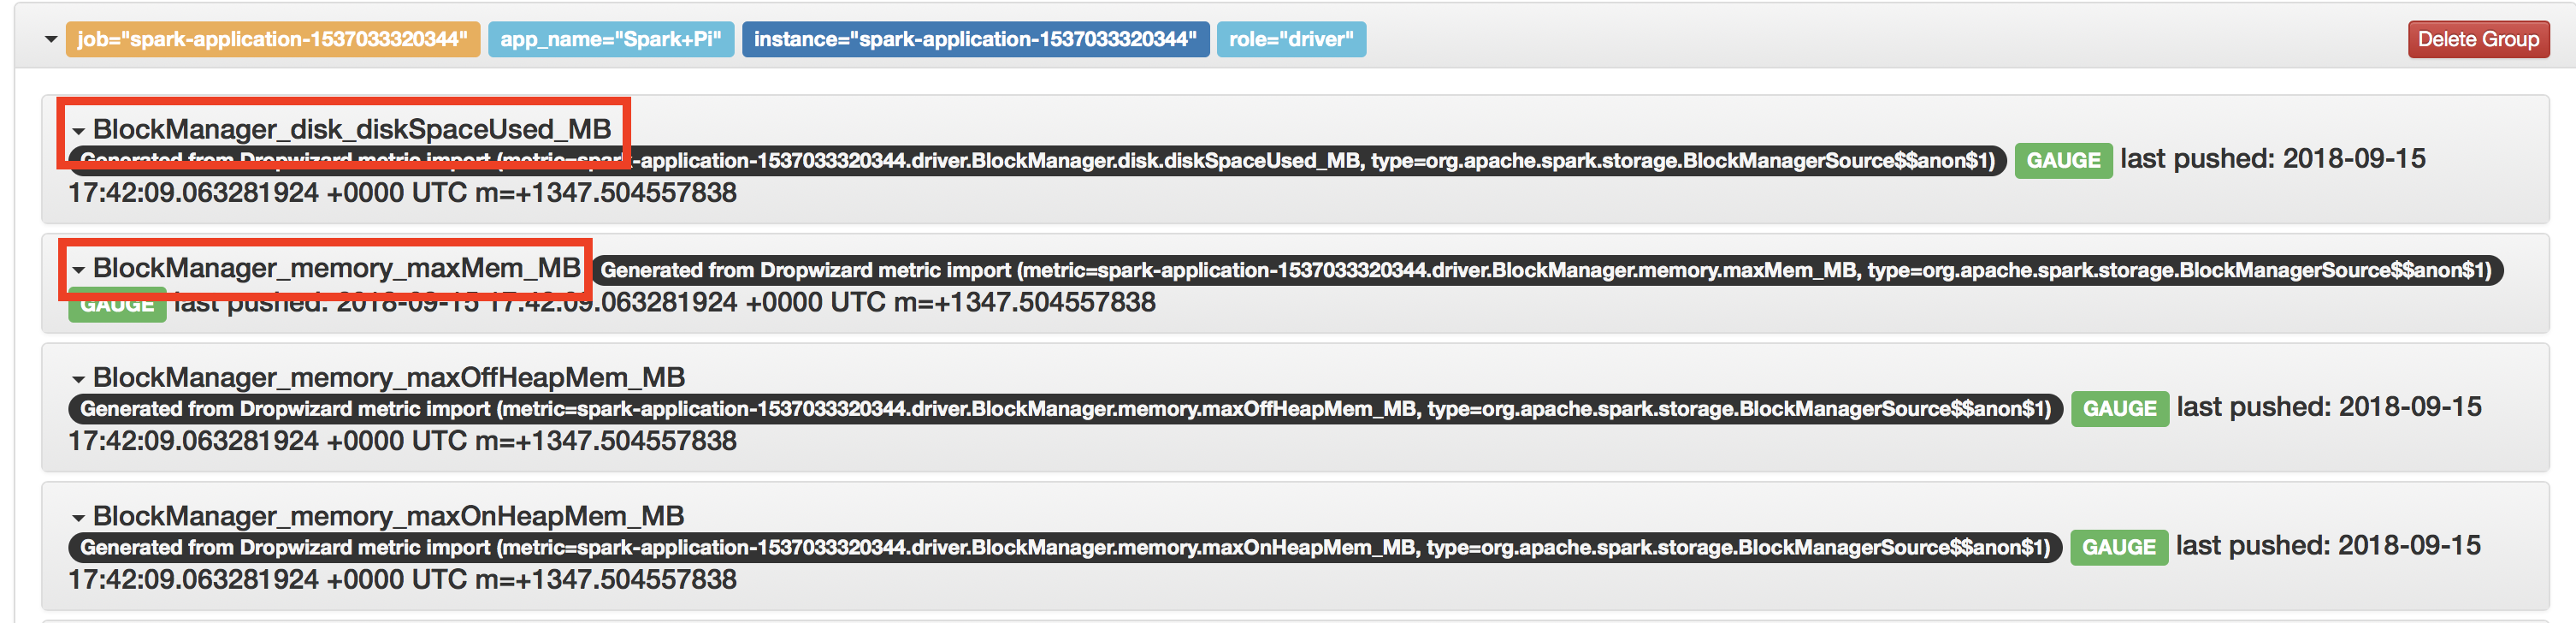
Now let’s configure a regex that extracts the part following driver from the metric name and run the same Spark application again:
metrics.propereties:
# Enable Prometheus for all instances by class name
*.sink.prometheus.class=com.banzaicloud.spark.metrics.sink.PrometheusSink
*.sink.prometheus.pushgateway-address=prometheus-pushgateway:9091
*.sink.prometheus.metrics-name-capture-regex=(.+driver_)(.+)
*.sink.prometheus.metrics-name-replacement=$2
The regular expression passed to *.sink.prometheus.metrics-name-capture-regex is matched against the name field of metrics published by Spark. In this example, the (.+driver_)(.+) regular expression has capturing groups that capture the parts of the name that end with, and follow, driver_.
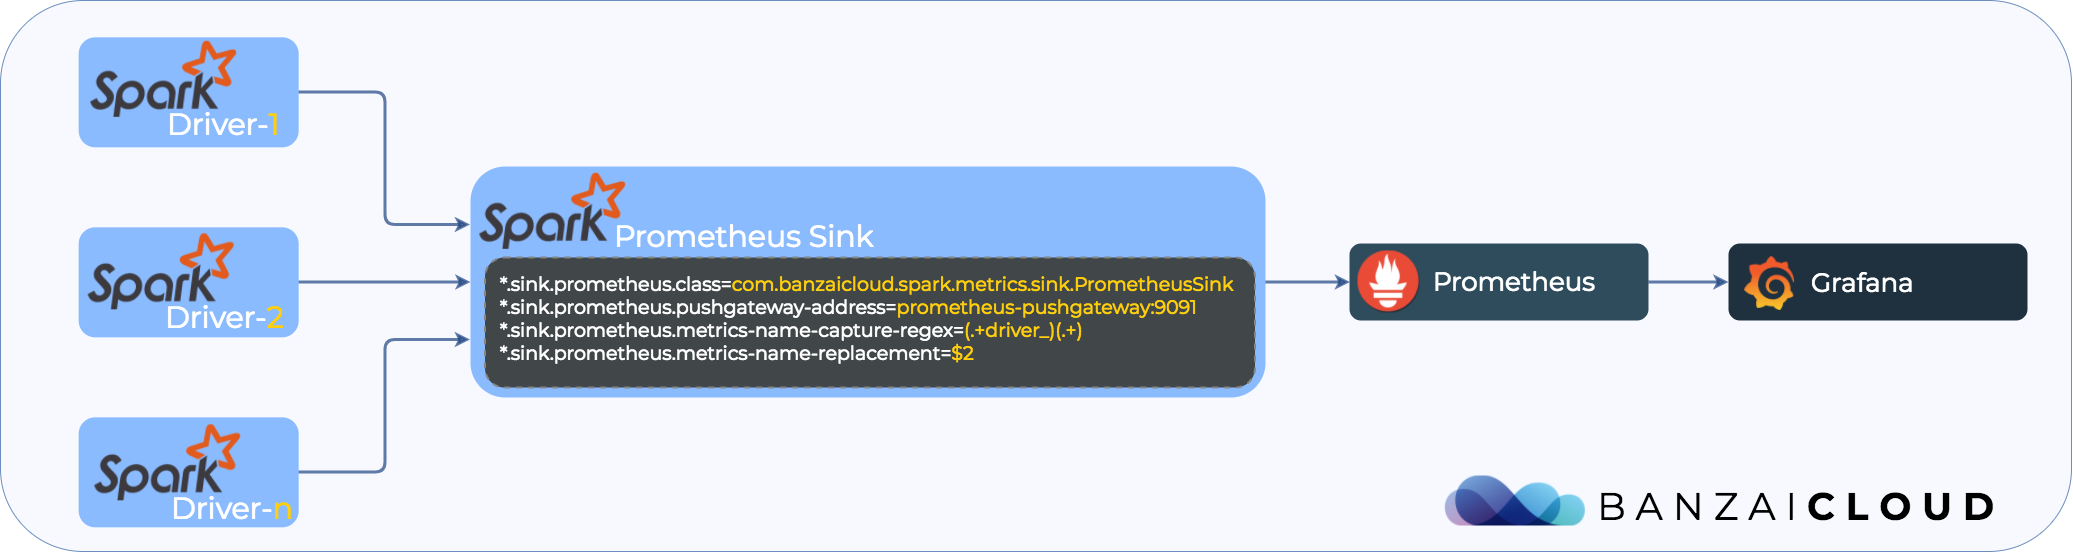
The setting specified in *.sink.prometheus.metrics-name-replacement controls how we replace the captured parts of the metric name. In this example, the whole name is replaced with the part of the name that follows driver_.
How to set custom metadata on metrics through labels 🔗︎
Metrics published by Spark can be enriched with metadata via labels that are configurable in the metrics configuration file. These must be specified as a comma seprated list of label=value pairs.
metrics.propereties:
# Enable Prometheus for all instances by class name
*.sink.prometheus.class=com.banzaicloud.spark.metrics.sink.PrometheusSink
*.sink.prometheus.pushgateway-address=prometheus-pushgateway:9091
...
*.sink.prometheus.labels=label1=value1,label2=value2
In this example, each metric sent to Prometheus will have to have additional labels: label1=value1 and label2=value2


