Monitoring series:
Monitoring Apache Spark with Prometheus
Monitoring multiple federated clusters with Prometheus - the secure way
Application monitoring with Prometheus and Pipeline
Building a cloud cost management system on top of Prometheus
Monitoring Spark with Prometheus, reloaded
Kafka on Kubernetes the easy way
At Banzai Cloud we provision and monitor large Kubernetes clusters deployed to multiple cloud/hybrid environments, using Prometheus. The clusters, applications or frameworks are all managed by our next generation PaaS, Pipeline. One of the most popular frameworks we deploy to Kubernetes at scale, and one that we love, is Apache Kafka. We have centralized the monitoring of multiple large Kafka clusters with federated Prometheus on Kubernetes. This post is about getting into the nitty-gritty of your available options, and exploring some examples of monitoring solutions.
Note that we have removed Zookeeper from Kafka and we use Etcd instead. For further details please read this post.
It’s quite common for Java applications to monitor the JVM itself, since applications do not have a built-in monitoring component. The simplest way to collect information is through JMX, where metrics about the state of the JVM, CPU, Memory, and GC are already available. Based on these metrics, we can optimize settings for memory usage, threads, or even by using exposed setters through MBeans.
Using existing tools 🔗︎
Apache Kafka deployments on Kubernetes expose JMX interfaces to interact with. The snippet from our deployment descriptor, which installs the Kafka Helm chart with JMX enabled, looks like this:
{
  "name": "banzaicloud-stable/kafka",
  "release_name":"demo2",
  "values": {
    "jmx": {
      "enabled": true
    }
  }
}
Now, once this is enabled, one suboptimal alternative is to go the Pod and use JConsole or VisualVM to do some debugging and monitoring. For example, the JMX port can be proxied and connect to localhost:
kubectl port-forward kafka-0 5555
jconsole 127.0.0.1:5555
This opens up some options for monitoring, but at the same time raises some questions (for example, about security). Also, you’ll have to run a new JVM to collect the available information through JMX and secure the channel somehow.
Prometheus and the JVM 🔗︎
The folks at Prometheus have a nice solution to all of the above. They’ve written a collector that can configurably scrape and expose the mBeans of a JMX target. It runs as a Java Agent, exposing an HTTP server and serving metrics of the local JVM. It can also be run as an independent HTTP server and scrape remote JMX targets, but this comes with various disadvantages, such as it being harder to configure and it being unable to expose process metrics (e.g., memory and CPU usage). Running the exporter as a Java Agent is thus strongly encouraged.
We have forked this exporter, enhanced it a bit with a Dockerfile, which adds support for the options we’ve listed.
- Connect to an exposed JMX port of the JVM (not recommended)
- Java agent version (recommended)
If you use the agent version, you’ll have to modify three configuration options:
- the Jar file location
- the
portfor the http(s) interface, where the metrics will be available for scraping, already in Prometheus friendly format - additional configuration options
An example looks like this:
-javaagent:/opt/jmx-exporter/jmx_prometheus_javaagent-0.3.1-SNAPSHOT.jar=9020:/etc/jmx-exporter/config.yaml
Advanced Kafka monitoring scenarios with Pipeline 🔗︎
If Kafka is being deployed with Pipeline, all the additional configuration parameters are available in our GitHub repository.
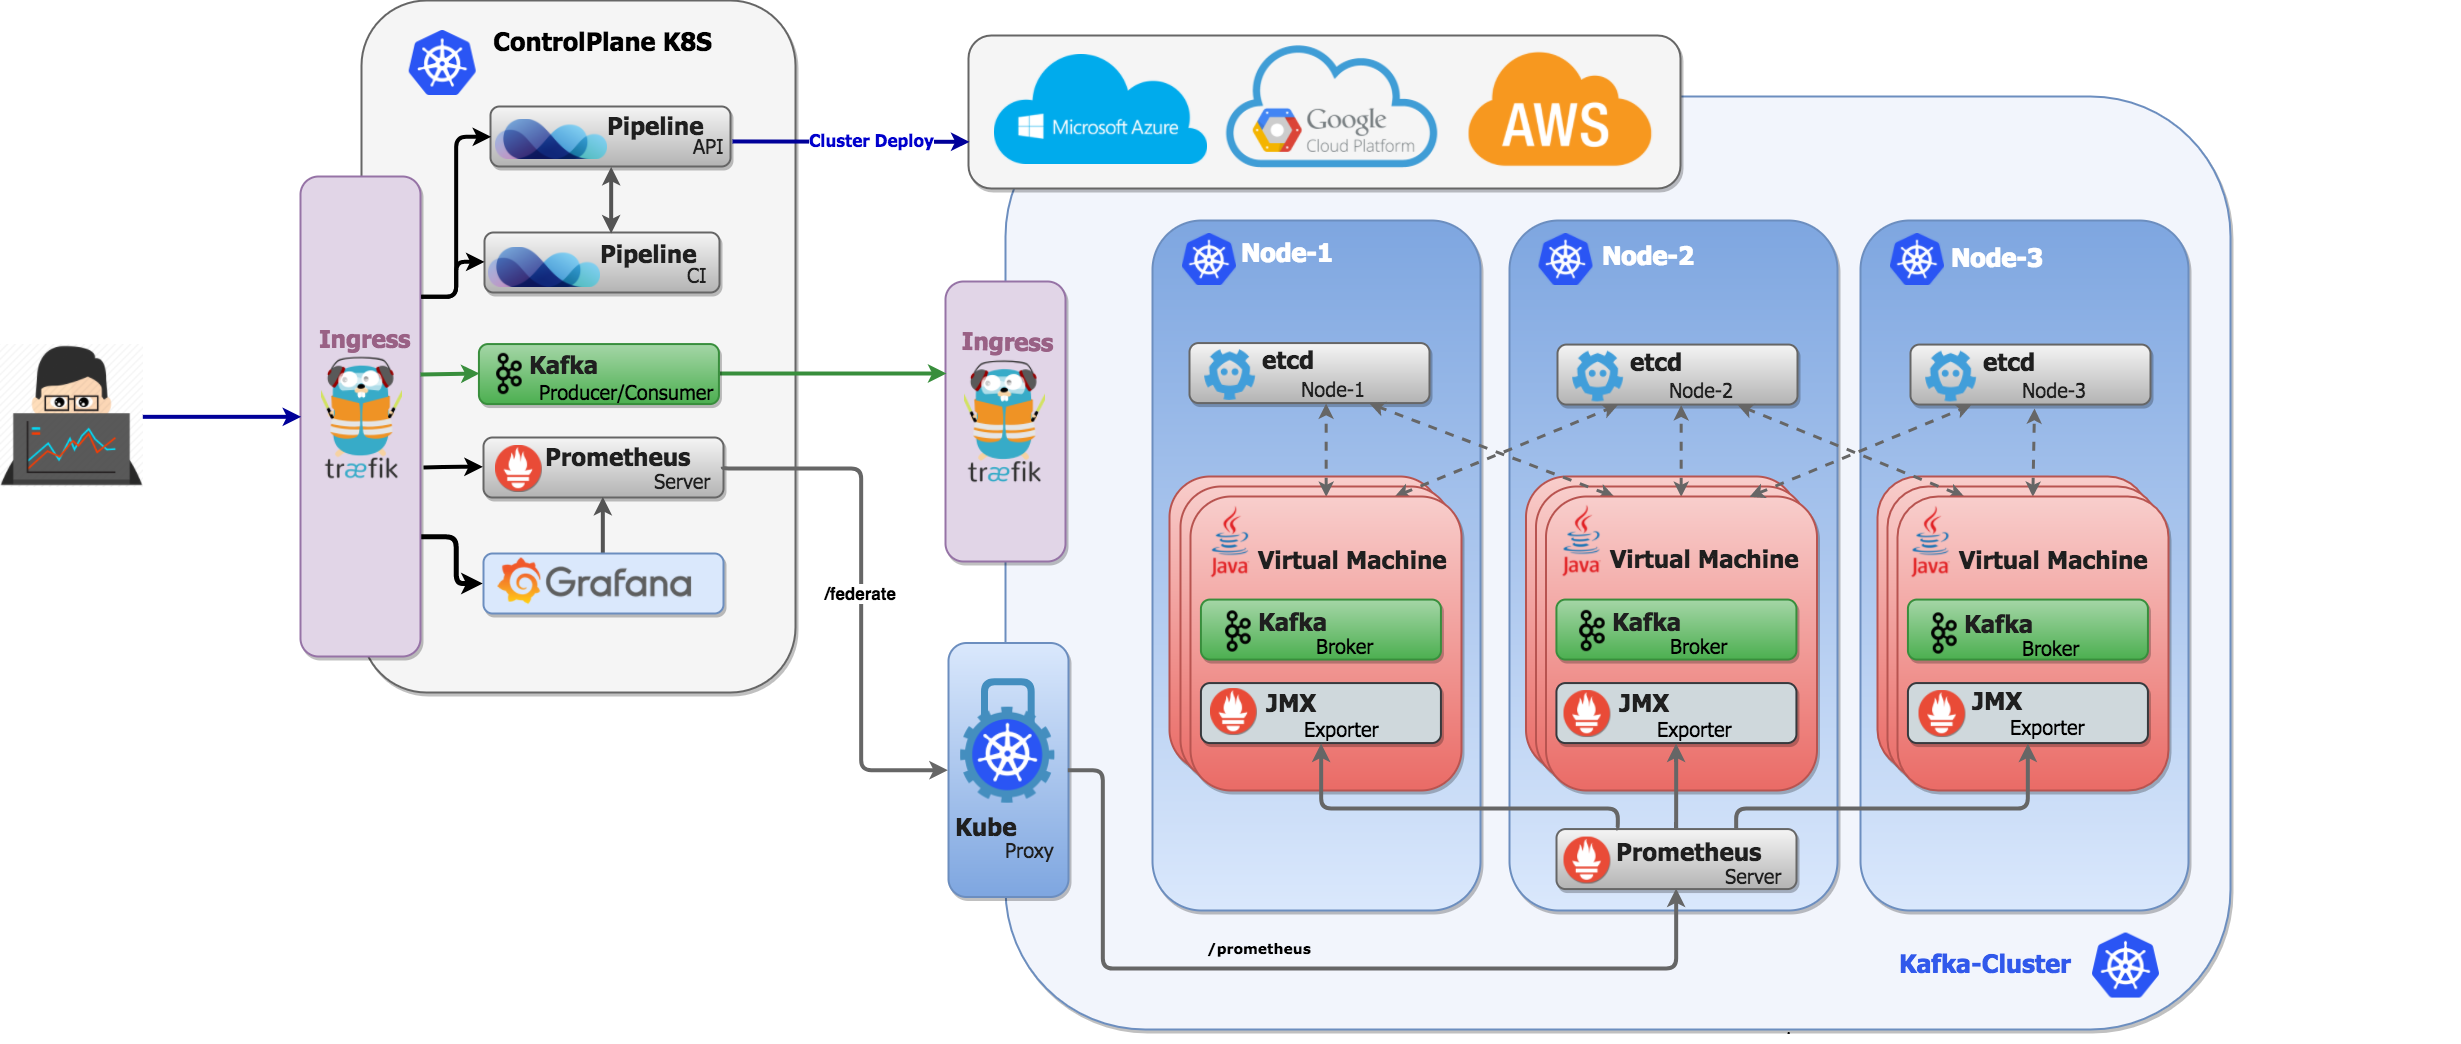
As you can see, our Kafka Helm chart is set up to use an init container, which copies the previously mentioned JAR file to a specified mount, which is used in read-only mode by the Kafka container. In the Banzai Cloud Kafka Helm chart, we use a stateful-set annotated with the below values, so there will be a Pod port whenever the jmx-exporter is scraped via a http(s) interface by the Prometheus server.
The overview of the deployment looks like this
annotations:
  prometheus.io/scrape: "true"
  prometheus.io/probe: kafka
  prometheus.io/port: "9020"
In the end, all of the above Pods will have a KAFKA_OPTS environment variable -javaagent:/opt/jmx-exporter/jmx_prometheus_javaagent-0.3.1-SNAPSHOT.jar=9020:/etc/jmx-exporter/config.yaml
The configuration of the JMX exporter is pushed into a Kubernetes configmap, so we can dynamically change it, if needed, and changes are automatically reflected at the next scrape.
Please note that our configuration is a bit more complex than usual, because, as is the case with us, running a PaaS necessitates several advanced features. We do configs of BlackLists or WhiteLists for objects and we can generate arbitrary metric names for those objects, as well. See the example below:
lowercaseOutputName: true
   rules:
   - pattern : kafka.cluster<type=(.+), name=(.+), topic=(.+), partition=(.+)><>Value
     name: kafka_cluster_$1_$2
     labels:
       topic: "$3"
       partition: "$4"
Beside the configurations given above we have several Grafana dashboards that provide us with a detailed overview of the JVM, and of Kafka itself.
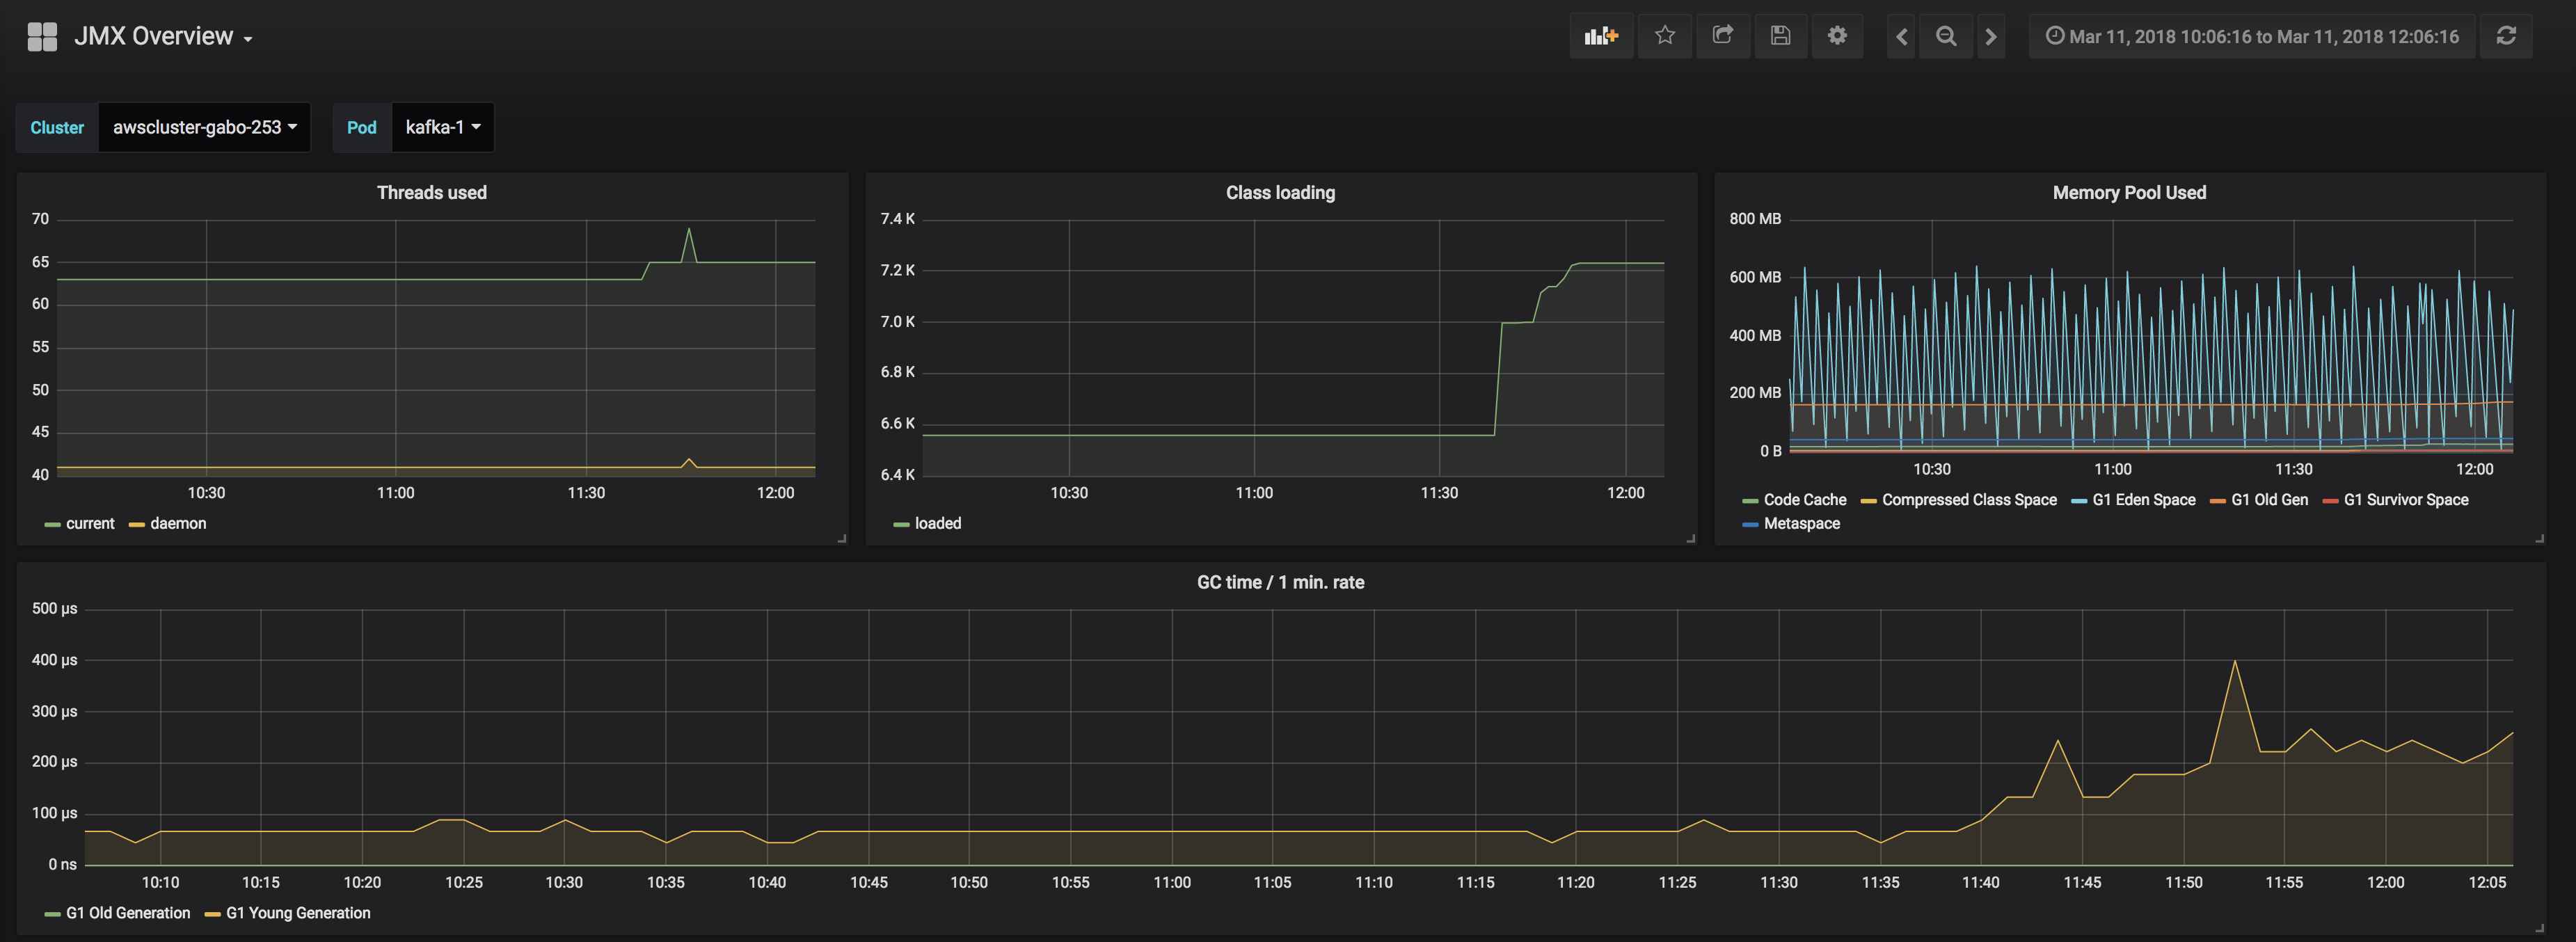
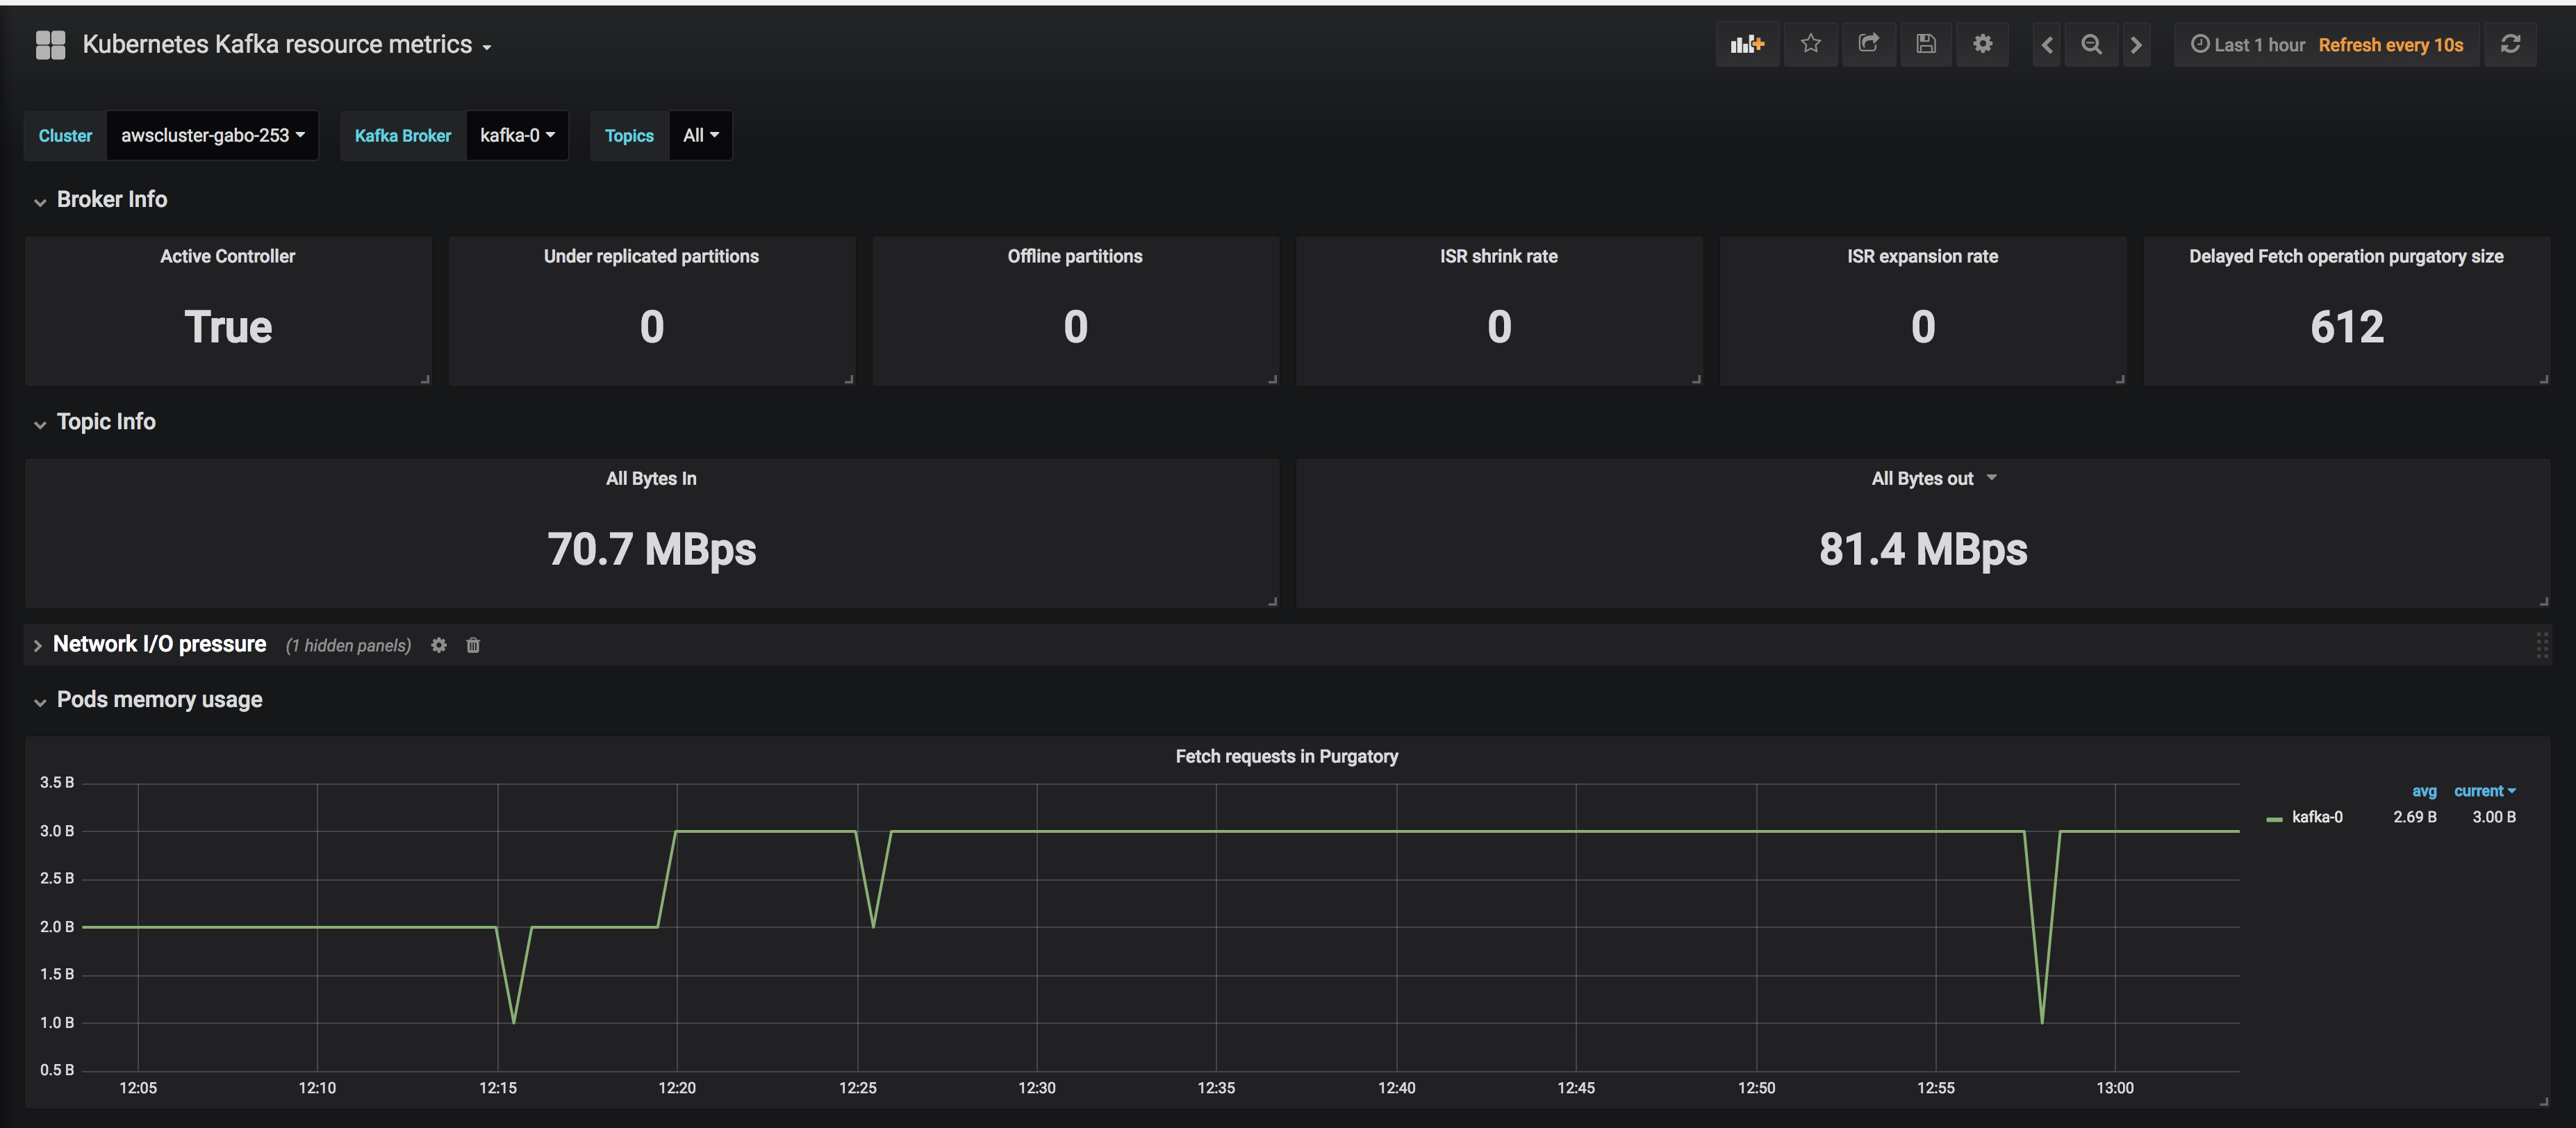
In the next post in this series, we’ll discuss how to set up alerts in the event of a problem, and how to interact with the Kafka cluster.


