Monitoring series:
Monitoring Apache Spark with Prometheus
Monitoring multiple federated clusters with Prometheus - the secure way
Application monitoring with Prometheus and Pipeline
Building a cloud cost management system on top of Prometheus
Monitoring Spark with Prometheus, reloaded
At Banzai Cloud we provision and monitor large Kubernetes clusters deployed to multiple cloud/hybrid environments. These clusters and applications or frameworks are all managed by our next generation PaaS, Pipeline. In the last post in this series we discusses how we use Prometheus in a federated architecture to collect data from multiple clusters in a secure way. As we continue to add providers and applications to Pipeline, we face a variety of challenges to the standardized way we handle monitoring data.
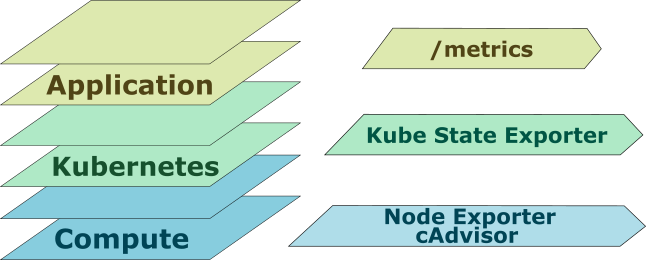
Layers of monitoring 🔗︎
Very often, in order to find the root cause of a problem, it’s not enough to monitor only the application itself. Errors from lower levels can escalate and filter into the application and cause undesired behavior. That’s why it’s important to monitor every layer of your deployment.
Node layer 🔗︎
From the bottom up, this is the first layer we monitor. There are a few trivial mistakes to be avoided, as such:
- No more space left on the device
- Out Of Memory
- Can’t reach the destination
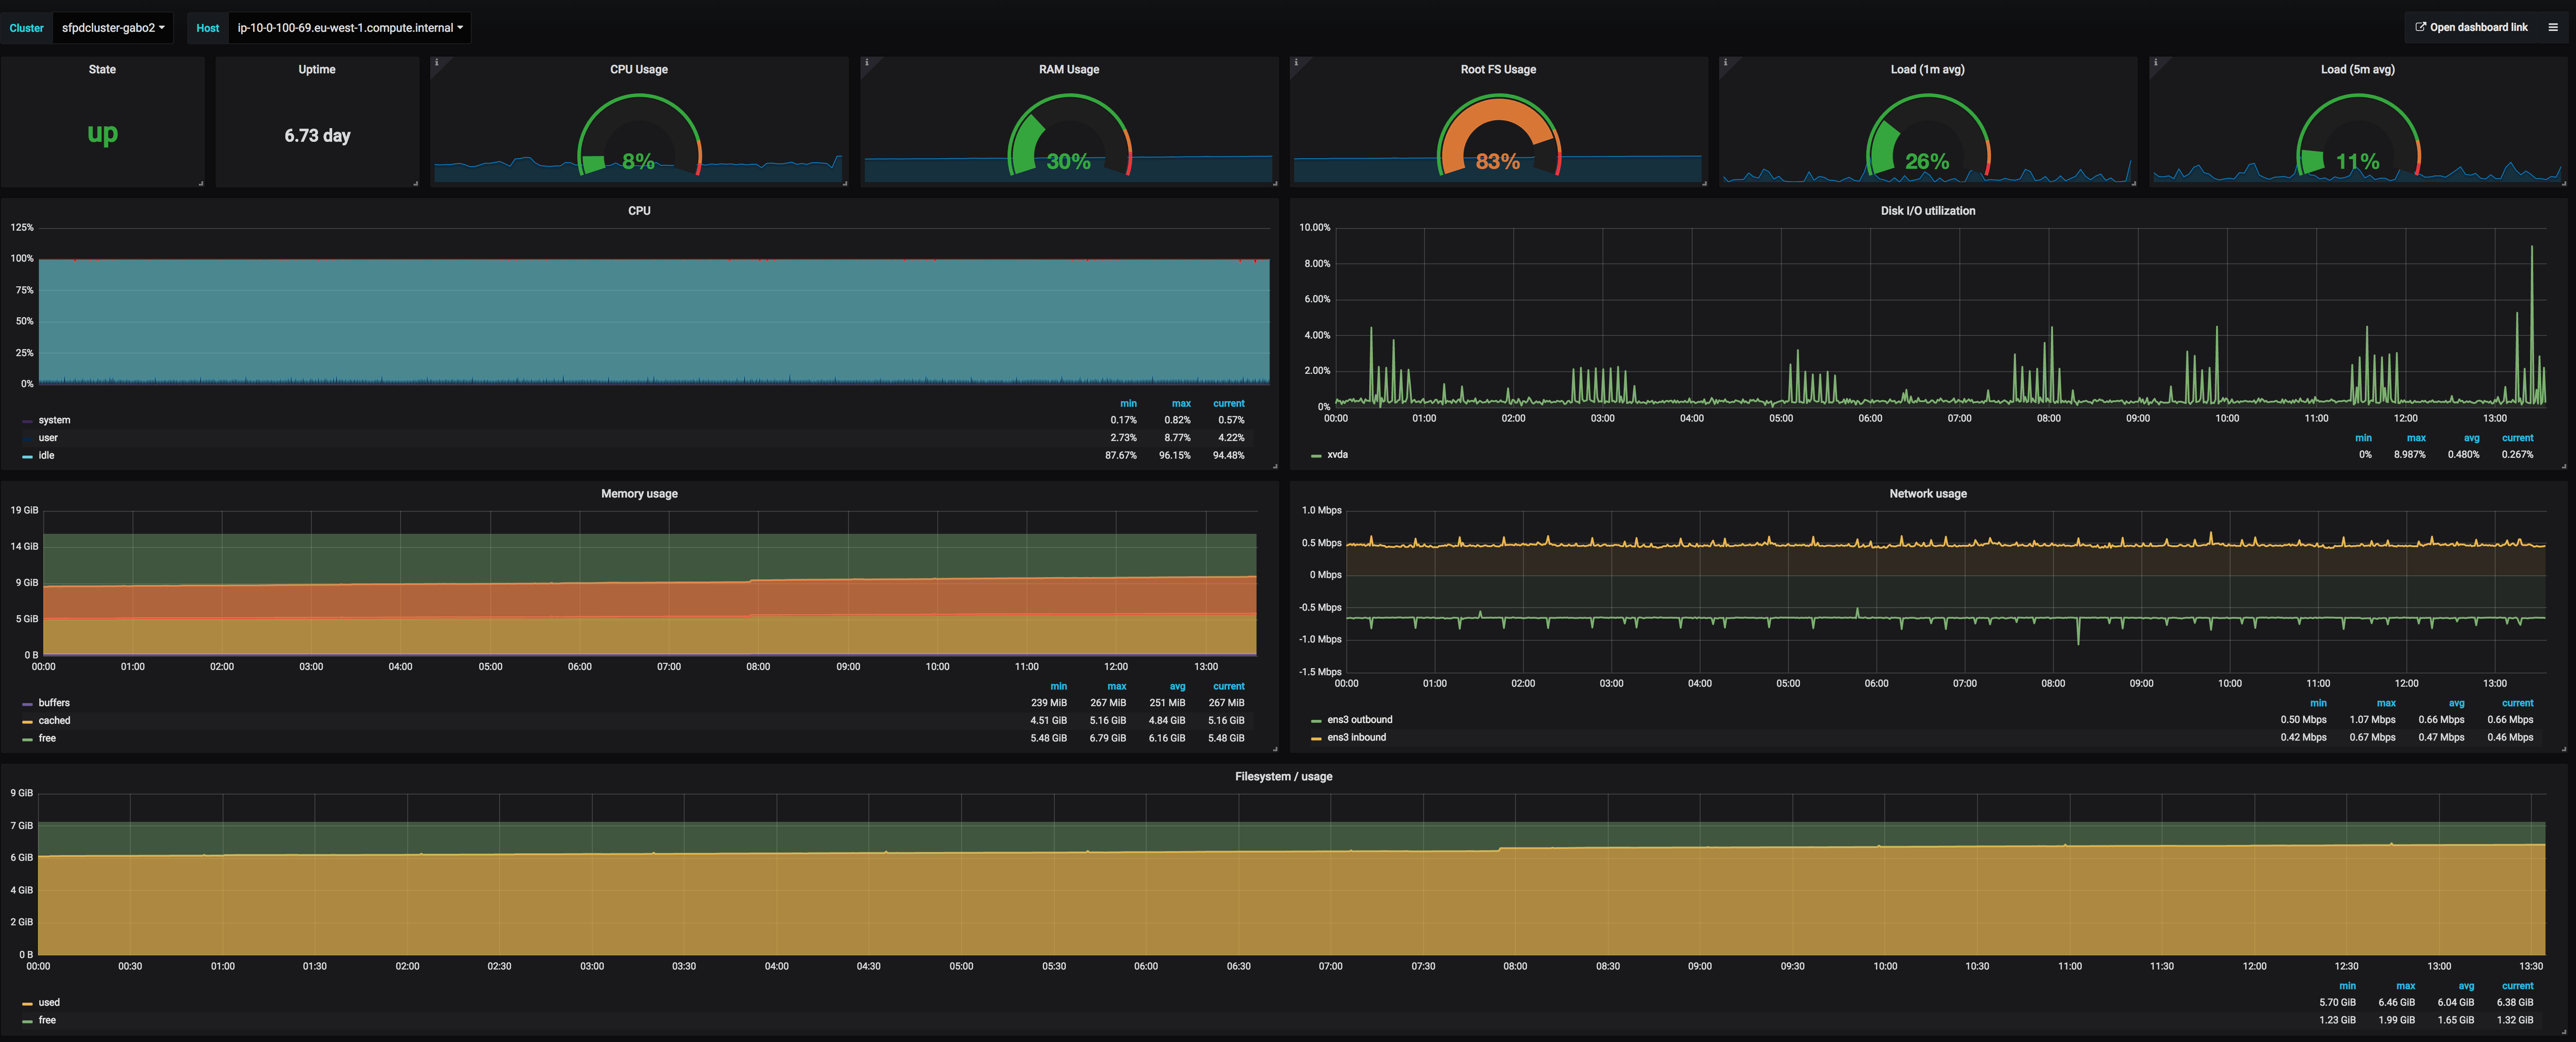
You should have, at least, CPU, Memory, Disk and Network metrics and their associated alerts. These metrics can save many hours of unnecessary debugging. Fortunately these metrics are the easiest to collect via the Prometheus node exporter or Kubernetes cAdvisor.
Platform / Kubernetes layer 🔗︎
Because Kubernetes manages the whole cluster we should have a clear view of what’s happening inside. As in the previous paragraph, this problem is subject to applications of best practices. The kube-state-exporter provides a good overview of the cluster’s state. Many useful metrics - running pods, state of the pods, scheduling queue etc. - come from here.
Application layer - welcome to relabels 🔗︎
The application layer is where the anarchy begins. First, it depends on the individual developer and how they name their metrics. Following whatever naming convention strikes your fancy is okay if you only want to monitor your own applications, but it becomes troublesome when you try to monitor applications from different sources and correlate between metrics - which is exactly what we’re doing with Pipeline.
An excellent example of this is the JVM-based Apache Spark metrics. These kinds of applications usually lack advanced monitoring capabilities, are not forward thinking in regards to montioring, and do not posess a unified interface for metric names. Unfortunately, it’s extremely challenging to accomplish anything in projects of such a large size and with so many contributors.
To make things even more complicated, Prometheus monitoring is based on a pull model, which is not suitable for batch job monitoring. To fill this gap, Prometheus can be extended with a pushgateway, which accepts metrics over HTTP and provides scraping endpoints for the Prometheus server.
Deep dive example - monitoring Apache Spark and Apache Zeppelin
Okay, we have a plan let’s see what happens. We set up a Spark job and push metrics to the pushgateway using Banzai Cloud’s open source contribution).

# HELP spark_79ef988408c14743af0bccd2d404e791_1_executor_filesystem_file_read_bytes Generated from Dropwizard metric import (metric=spark-79ef988408c14743af0bccd2d404e791.1.executor.filesystem.file.read_bytes, type=org.apache.spark.executor.ExecutorSource$$anon$1)
# TYPE spark_79ef988408c14743af0bccd2d404e791_1_executor_filesystem_file_read_bytes gauge
spark_79ef988408c14743af0bccd2d404e791_1_executor_filesystem_file_read_bytes{instance="10.40.0.3",job="spark-79ef988408c14743af0bccd2d404e791",number="1",role="executor"} 0 1519224695487
Great, we now have the metrics we need, but each row has a unique component that does not fit into the Prometheus concept, which requires same metric names with different labels. Moreover, an Apache Zeppelin launched Spark job looks a little bit different.
Here’s an example of raw Zeppelin metrics from Spark workers
zri_2cxx5tw2h__2d6zutx3z_1_CodeGenerator_generatedMethodSize
The structure of Spark/Zeppelin metrics
<spark_app_name>_<interpreter_group_id>__<notebook_id>_<executor_number>_<metric_name>
- spark_app_name is a configurable variable that identifies your application
- interpreter_group_id (one interpreter/notebook or per notebook)
- notebook_id this is our extended information about the Zeppelin notebook
- executor_number this is the unique number of the executor
- metric_name this is the metric identifier
The goal, here, is to wind up with general metric names with customizable labels (the Prometheus way!).
CodeGenerator_generatedMethodSize{spark_app_name="zri",interpreter_group_id="2cxx5tw2h",notebook_id="2d6zutx3z",number="1"}
Small tutorial of Prometheus relabels
Relabel is a very powerful function embedded in Prometheus. You can completely rewrite labels (yes a metric name is a label as well) after scraping it. For detailed information visit the Prometheus documentation at prometheus.io.
How does Prometheus label replacement work?
This is an example metric_relabel section from a Prometheus configuration.
source_labels: [role,__name__]
regex: '[driver|executor]+;(.*)'
replacement: '$1'
target_label: __oldname__
Source_labels
In this section you can specify the labels you’d like to apply to a regexp expression. These labels will be joined by the “;” separator.
source_labels: [role,__name__]
The value handled by regexp will look like this
driver;zri_2cxx5tw2h__2d6zutx3z_1_CodeGenerator_generatedMethodSize_count
Regexp
Applied regexp expression: this example allows driver or executor roles and group match for a whole name.
'[driver|executor]+;(.*)'
Replacement
Regexp template to replace value: for example, the first group match:
'$1'
Target_label
The target label creates/overwrites with value:
__oldname__
Use relabel to transform metrics 🔗︎
First, we need to arrange things so as to catch application metrics and only application metrics. Luckily, Spark metrics come with role labels. Based on their value we can push those metrics into a single temporary label called __oldname__.
- source_labels: [role,__name__]
  regex: '[driver|executor]+;(.*)'
  replacement: '$1'
  target_label: __oldname__
After that step, we can distinguish between different types of metrics with some more relabel configuring. In the following example, we’ll add the spark_app_name label based on our temporary __oldname__ label.
- source_labels: [__oldname__]
  regex: '(?P<spark_app_name>\w[^_]+)_(?P<interpreter_group_id>\w[^_]+)__(?P<notebook_id>\w[^_]+)_(?P<role>[driver|0-9]+)((\w[^_]+)_(\w[^_]+)__(\w[^_]+))?_(?P<metric_name>.*)'
  replacement: '${spark_app_name}'
  target_label: spark_app_name
Cleanup and finish: we change the metric’s original name __name__ to the parsed one we get from regexp and drop the temporary __oldname__ label.
- source_labels: [__oldname__]
  regex: '(?P<app_name>\w+)_(?P<role>[driver|0-9]+)((\w[^_]+)_(\w[^_]+)__(\w[^_]+))?_(?P<metric_name>.*)'
  replacement: '${metric_name}'
  target_label: __name__

- source_labels: [__oldname__]
  replacement: ''
  target_label: __oldname__
Inspired by https://www.robustperception.io/extracting-labels-from-legacy-metric-names/
Results on a Grafana dashboard 🔗︎
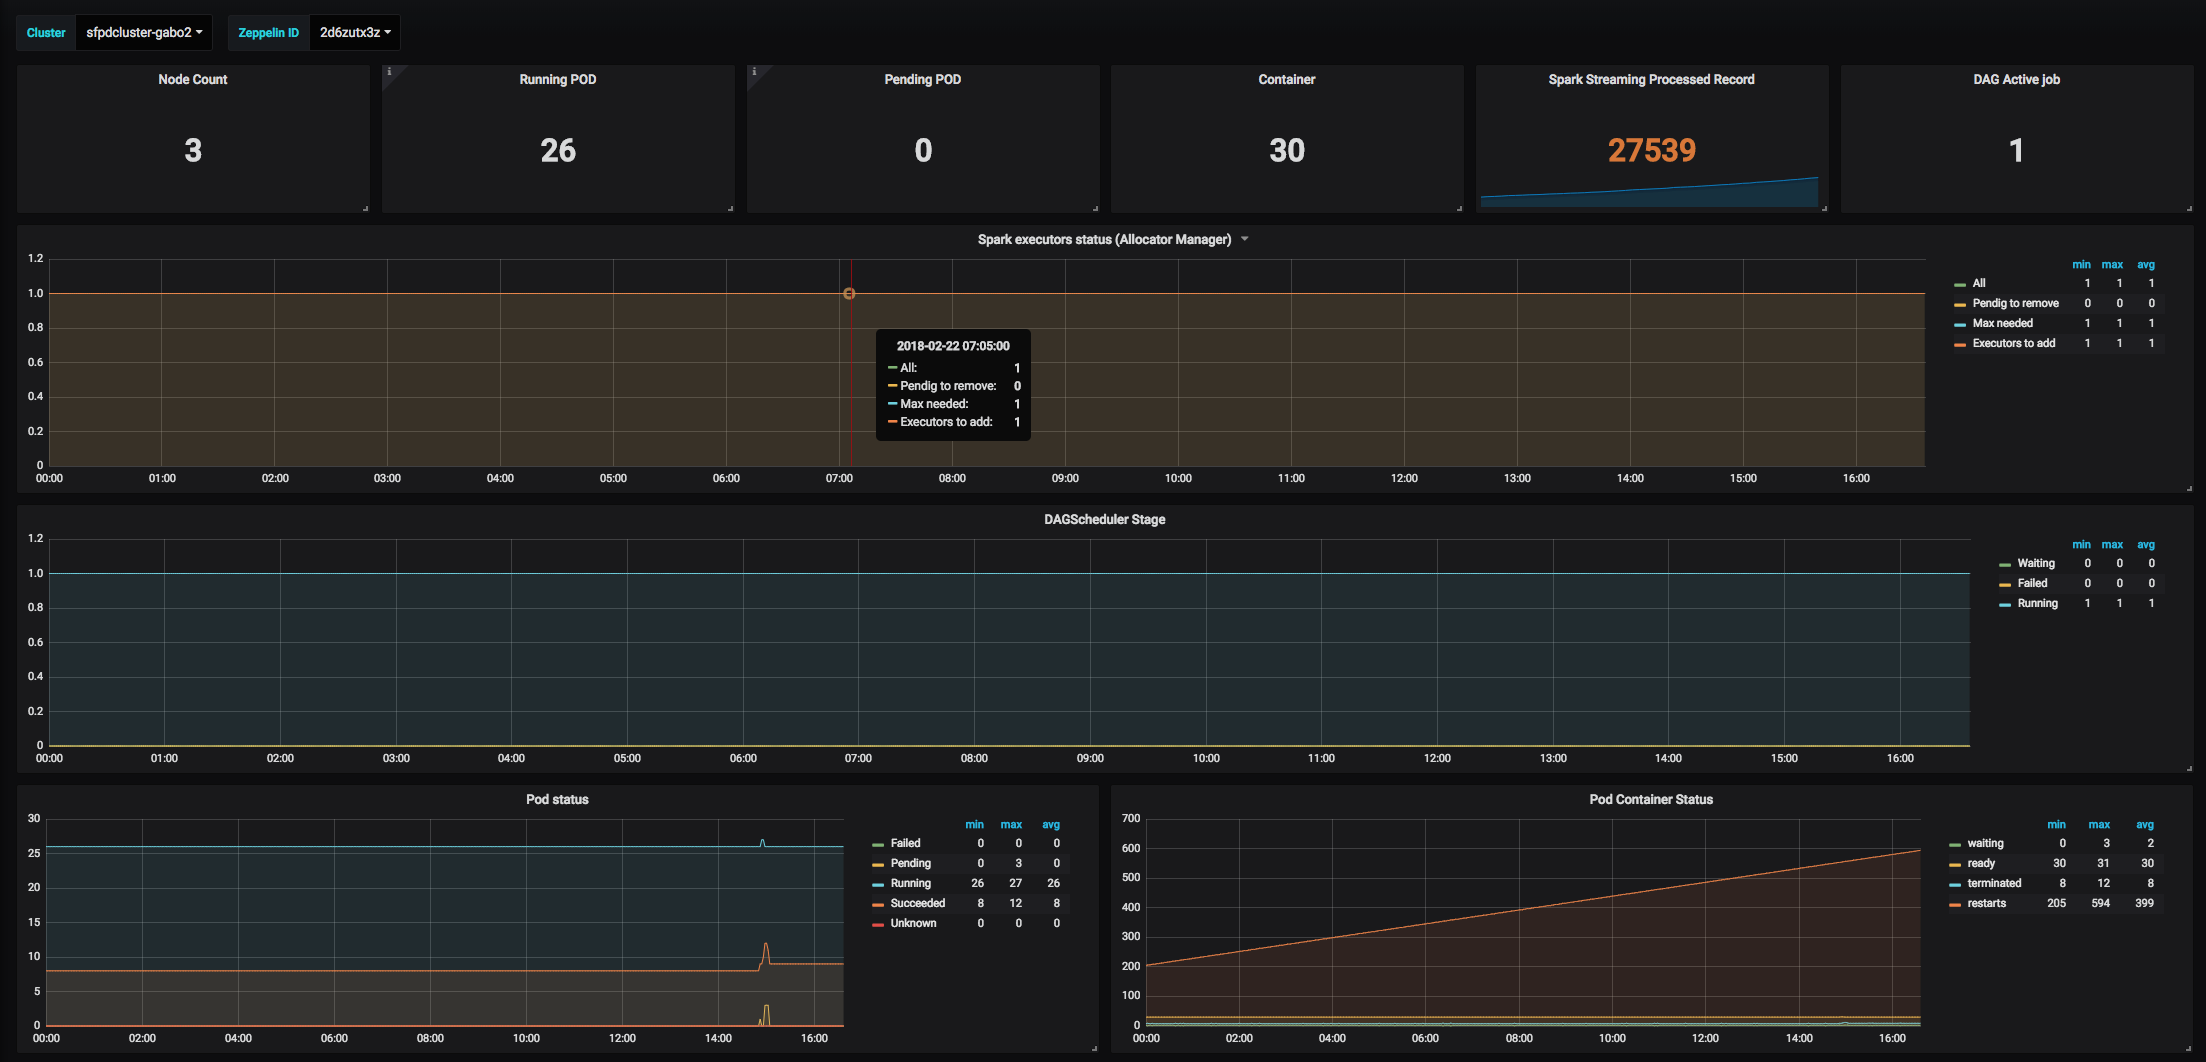
To visualize the metrics we’ve configured, try our favorite dashboarding tool, Grafana.
More & More metrics 🔗︎
After some fine tuning, we managed to unify a lot of different Apache Spark metrics. You can check out our final open source configuration in the Banzai Cloud GitHub repository
Zeppelin notebook example
# HELP zri_2cxx5tw2h__2d6zutx3z_1_CodeGenerator_generatedMethodSize Generated from Dropwizard metric import (metric=zri-2cxx5tw2h--2d6zutx3z.1.CodeGenerator.generatedMethodSize, type=com.codahale.metrics.Histogram)
# TYPE zri_2cxx5tw2h__2d6zutx3z_1_CodeGenerator_generatedMethodSize summary
zri_2cxx5tw2h__2d6zutx3z_1_CodeGenerator_generatedMethodSize{instance="10.40.0.2",job="zri-2cxx5tw2h--2d6zutx3z",number="1",role="executor",quantile="0.5"} 0 1519301799656
zri_2cxx5tw2h__2d6zutx3z_1_CodeGenerator_generatedMethodSize{instance="10.40.0.2",job="zri-2cxx5tw2h--2d6zutx3z",number="1",role="executor",quantile="0.75"} 0 1519301799656
Spark submit example
# HELP spark_79ef988408c14743af0bccd2d404e791_1_CodeGenerator_generatedMethodSize Generated from Dropwizard metric import (metric=spark-79ef988408c14743af0bccd2d404e791.1.CodeGenerator.generatedMethodSize, type=com.codahale.metrics.Histogram)
# TYPE spark_79ef988408c14743af0bccd2d404e791_1_CodeGenerator_generatedMethodSize summary
spark_79ef988408c14743af0bccd2d404e791_1_CodeGenerator_generatedMethodSize{instance="10.40.0.3",job="spark-79ef988408c14743af0bccd2d404e791",number="1",role="executor",quantile="0.5"} 10 1519224695487
spark_79ef988408c14743af0bccd2d404e791_1_CodeGenerator_generatedMethodSize{instance="10.40.0.3",job="spark-79ef988408c14743af0bccd2d404e791",number="1",role="executor",quantile="0.75"} 79 1519224695487
Zeppelin streaming example
# HELP zri_2cxx5tw2h__2d6zutx3z_driver_zri_2cxx5tw2h__2d6zutx3z_StreamingMetrics_streaming_lastCompletedBatch_processingDelay Generated from Dropwizard metric import (metric=zri-2cxx5tw2h--2d6zutx3z.driver.zri-2cxx5tw2h--2d6zutx3z.StreamingMetrics.streaming.lastCompletedBatch_processingDelay, type=org.apache.spark.streaming.StreamingSource$$anon$1)
# TYPE zri_2cxx5tw2h__2d6zutx3z_driver_zri_2cxx5tw2h__2d6zutx3z_StreamingMetrics_streaming_lastCompletedBatch_processingDelay gauge
zri_2cxx5tw2h__2d6zutx3z_driver_zri_2cxx5tw2h__2d6zutx3z_StreamingMetrics_streaming_lastCompletedBatch_processingDelay{instance="10.46.0.5",job="zri-2cxx5tw2h--2d6zutx3z",role="driver"} 6 1519301807816
Takeaway tips and tricks 🔗︎
- Here’s our full configuration example on Banzai Cloud.
- Creating regexp can be difficult, but you can save lots of time by using an online checker.
- And here’s some ideas to help with your own Grafana dashboards:


