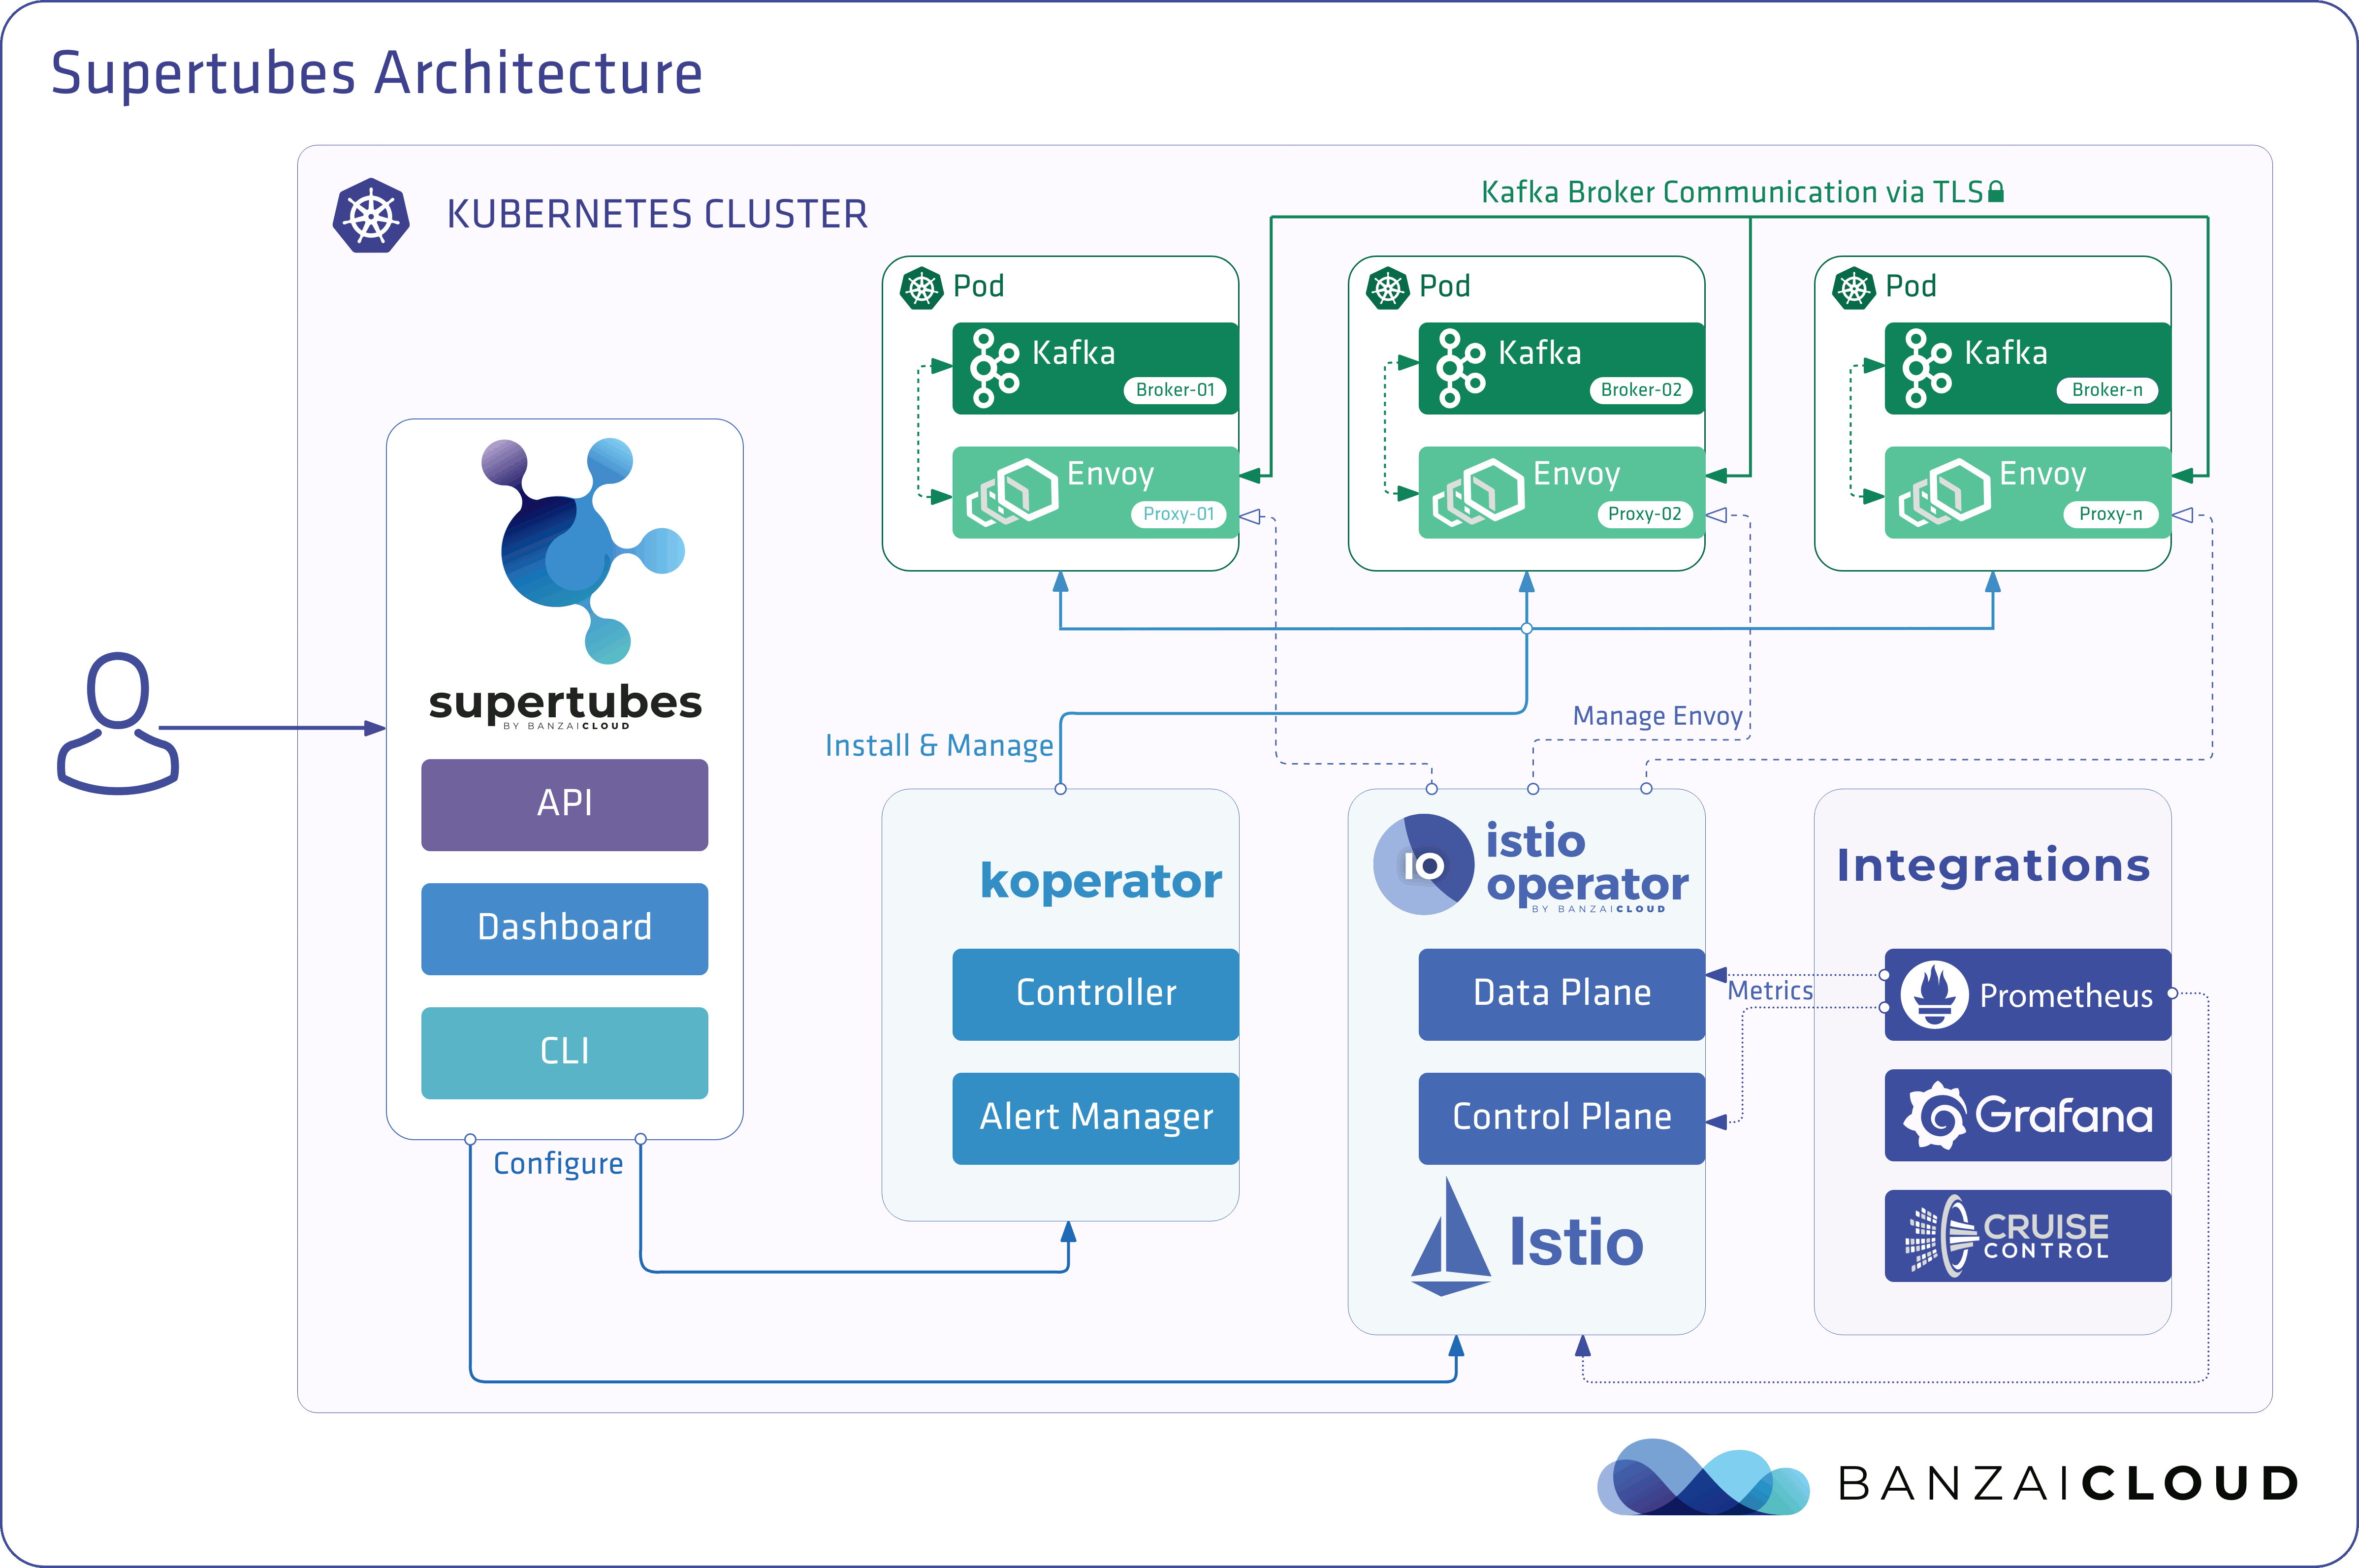
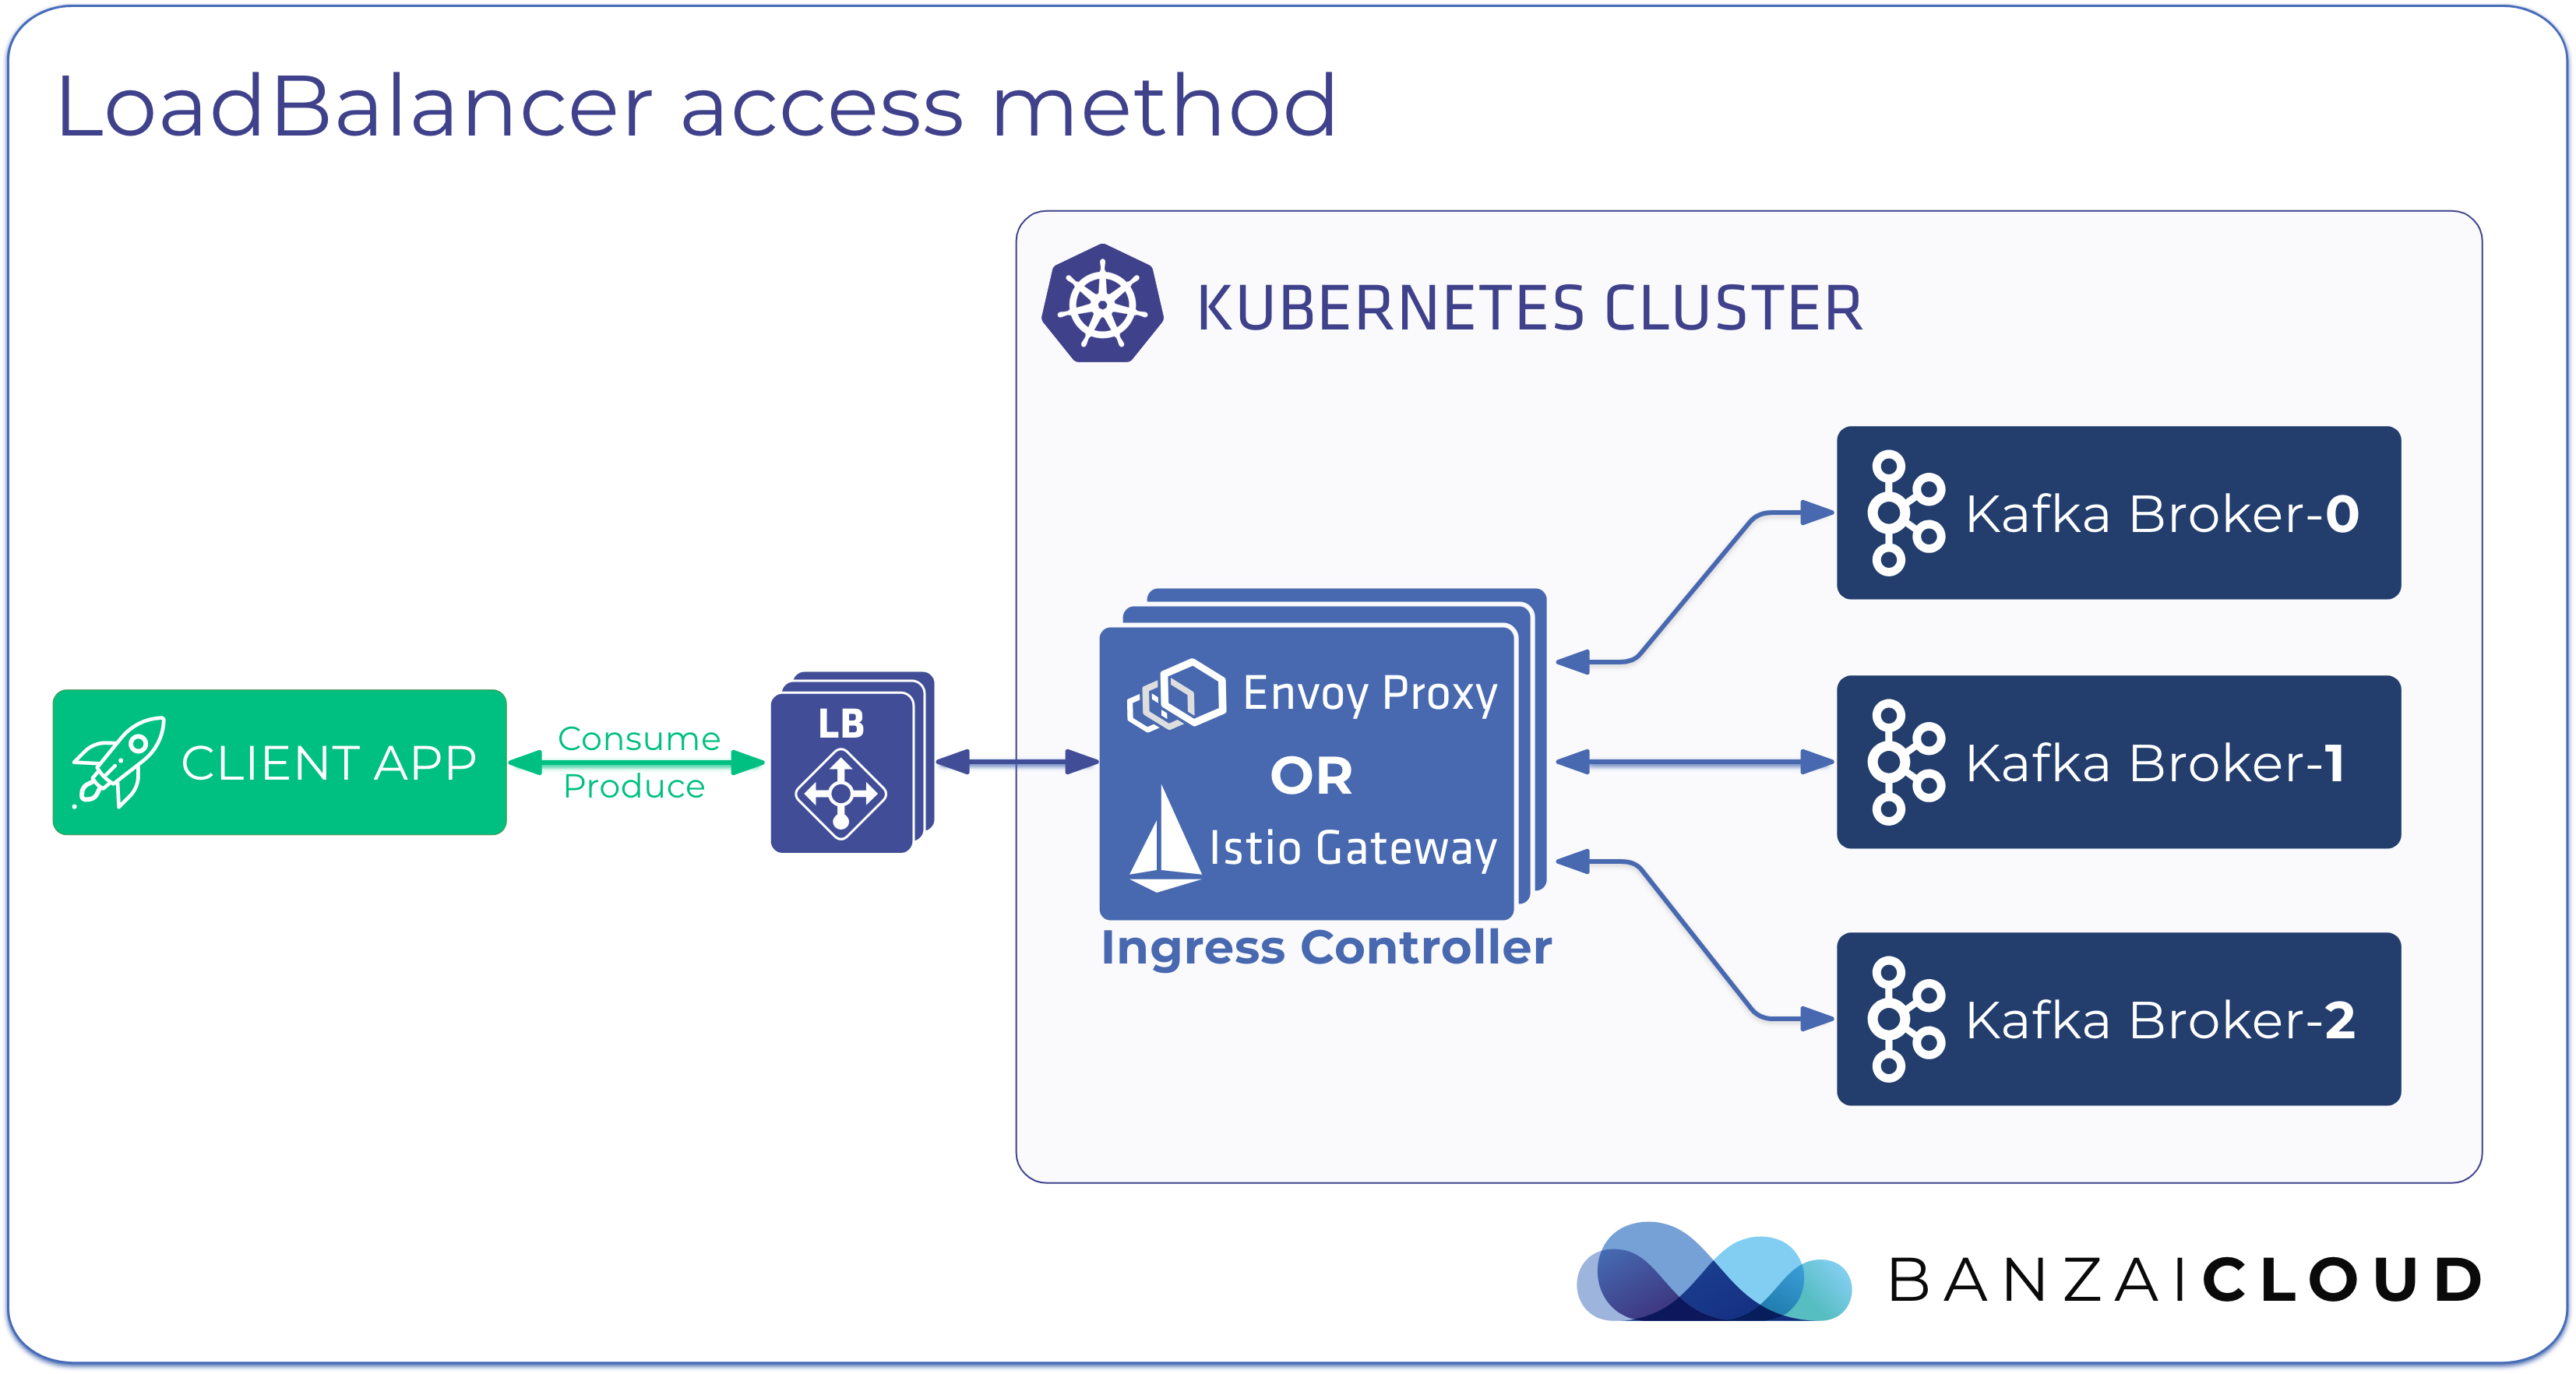
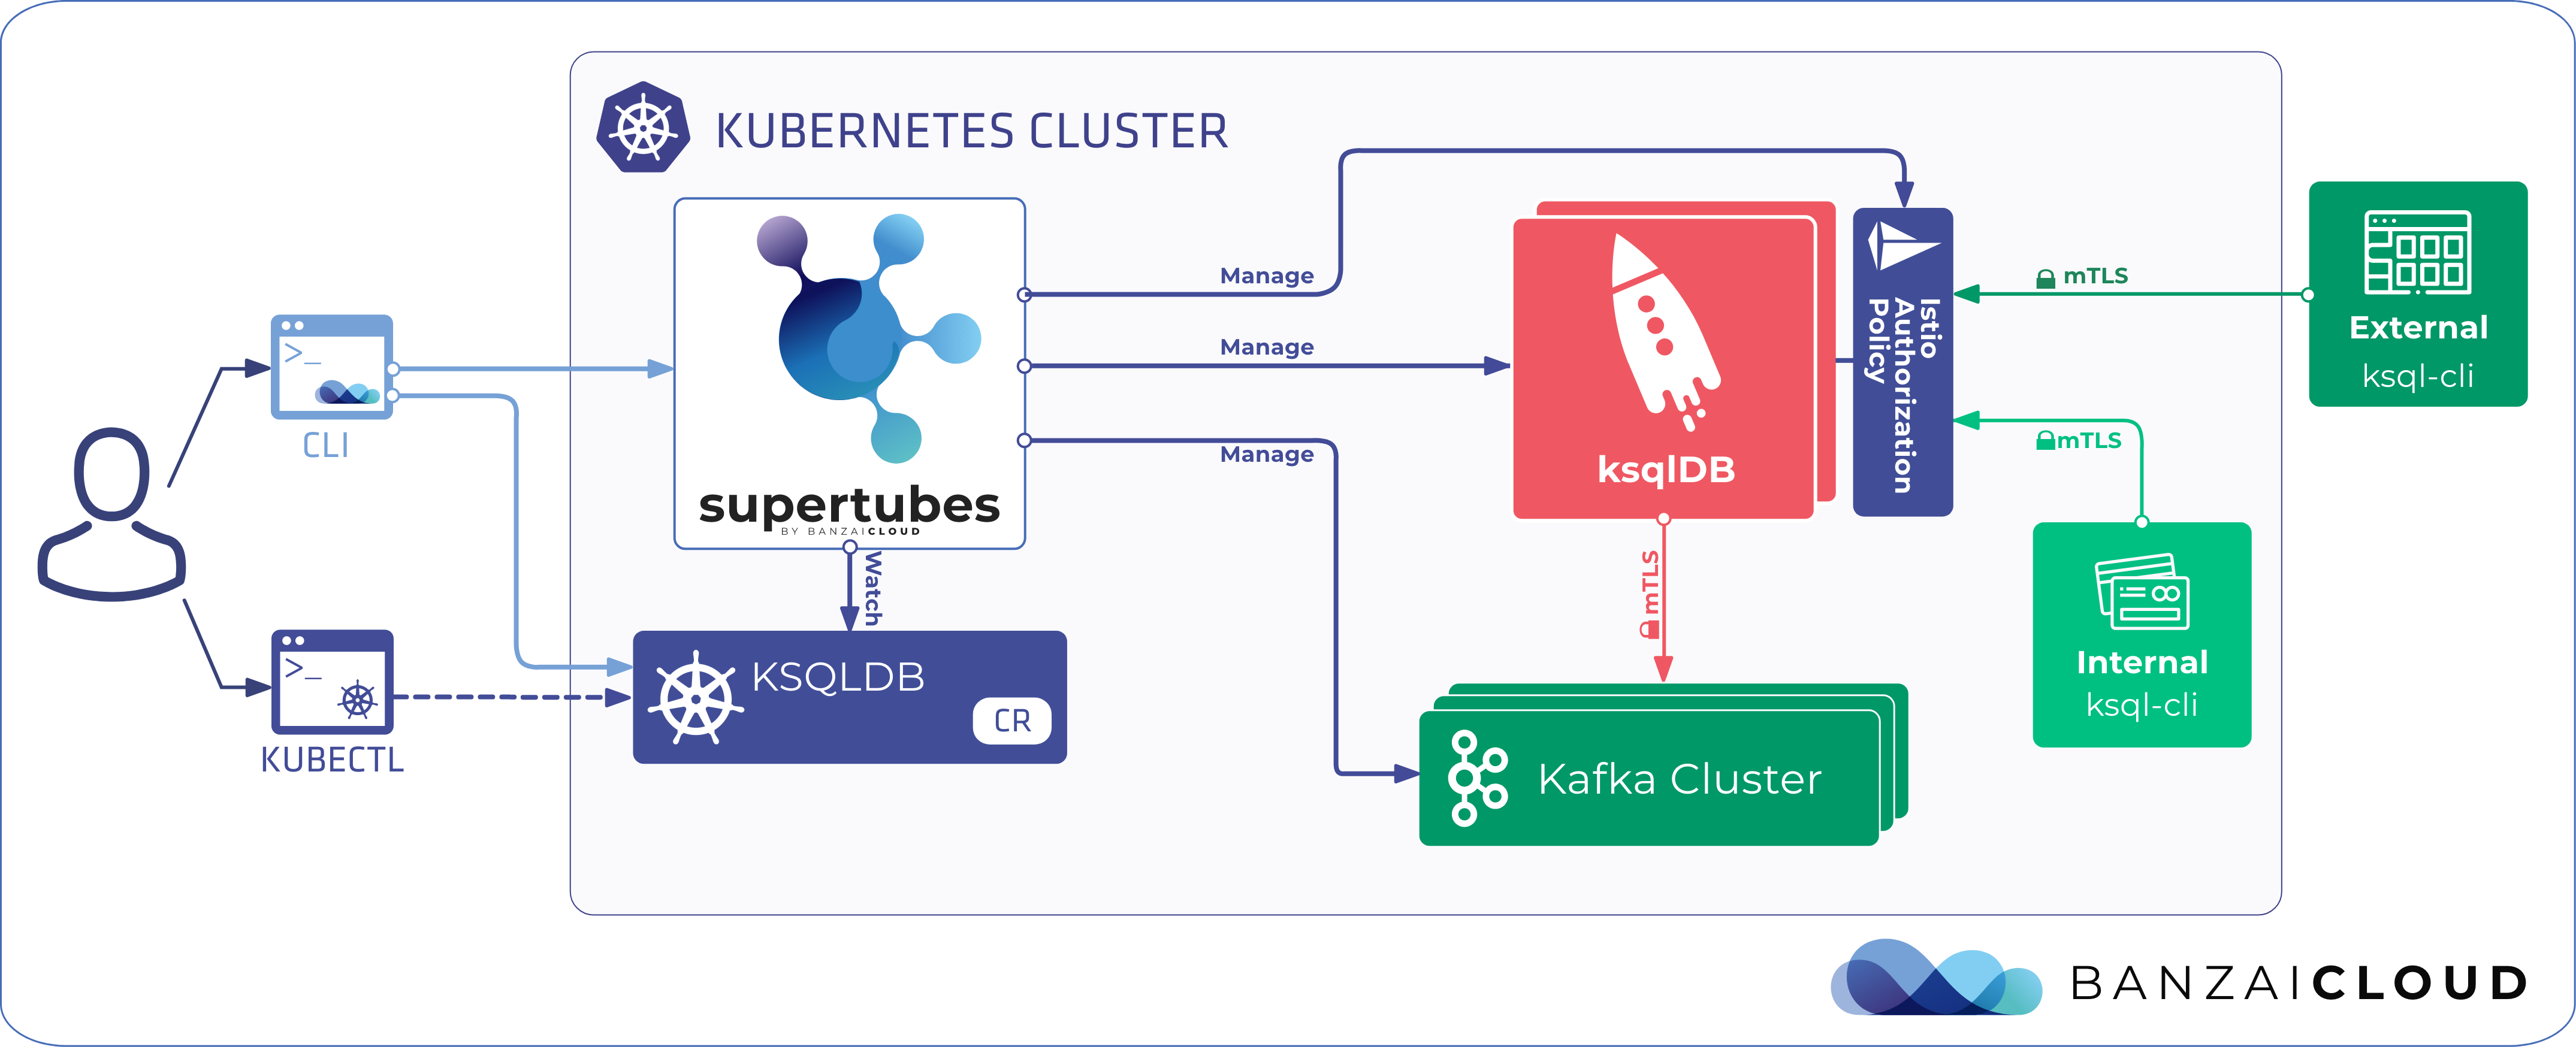
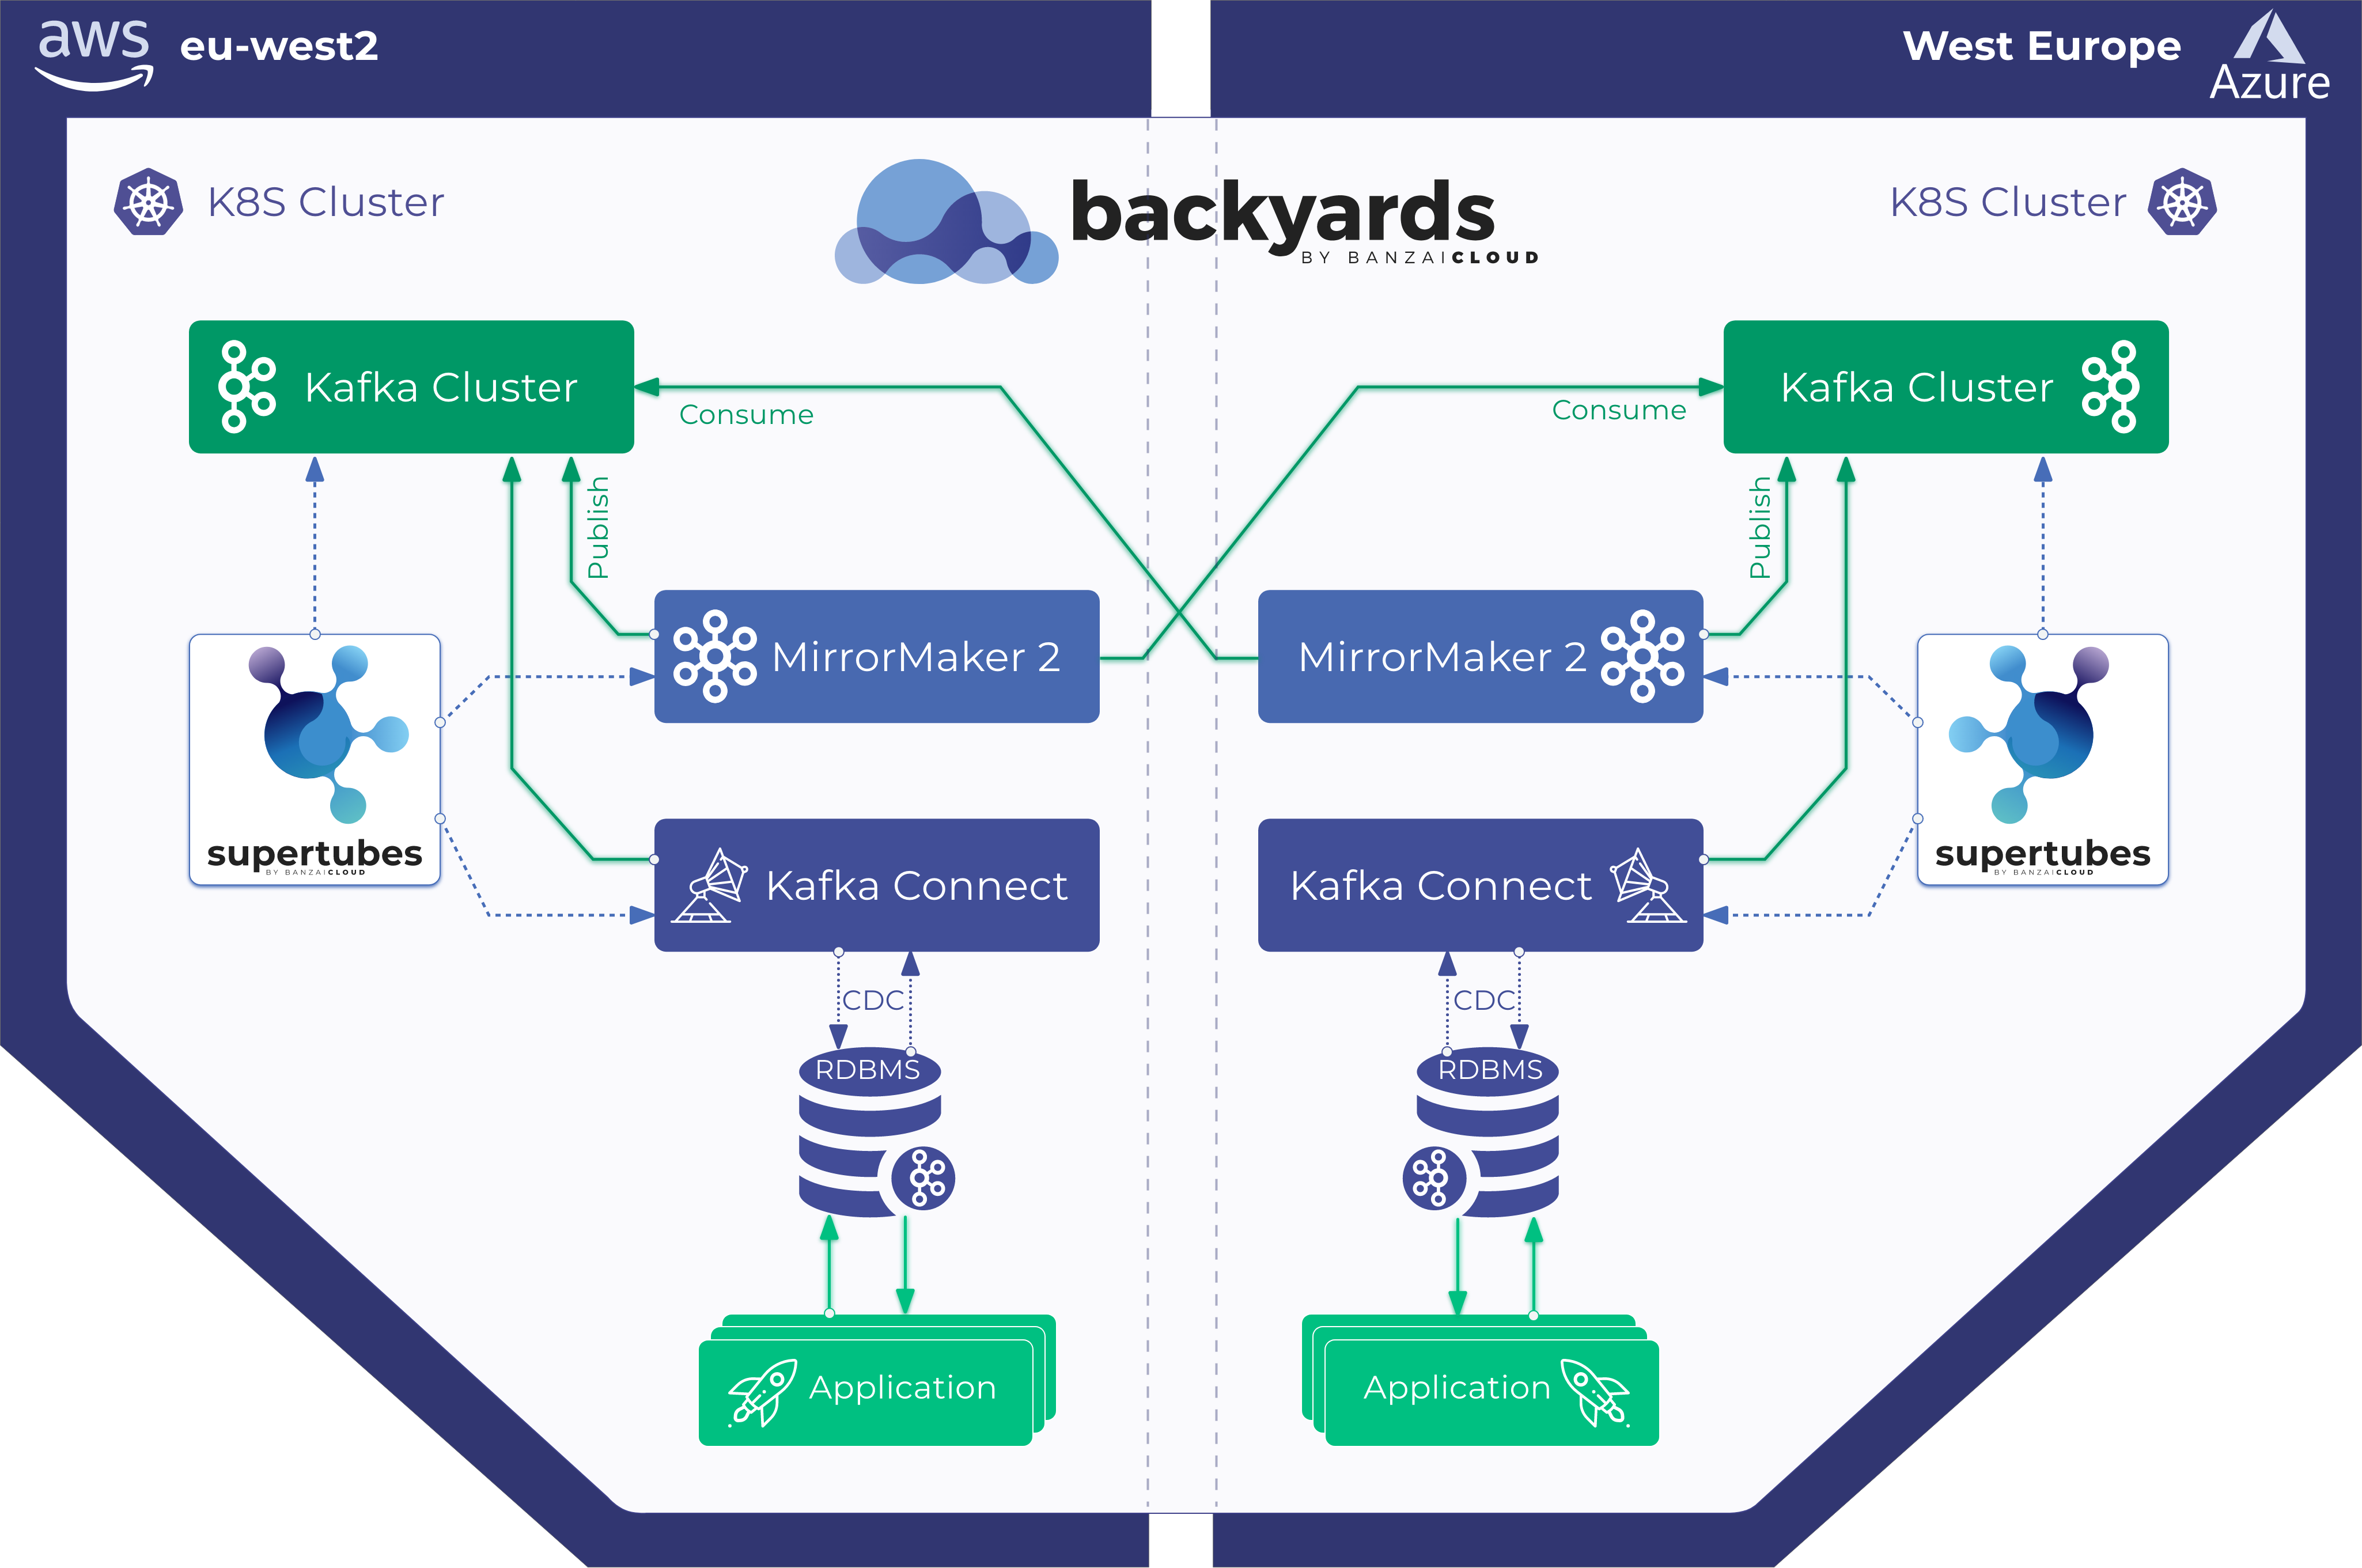
Apache Kafka is a distributed streaming platform used to build reliable, scalable and high-throughput real-time streaming systems. Its capabilities, while impressive, can be further improved through the addition of Kubernetes. Accordingly, we’ve built an open-source Koperator and Supertubes to run and seamlessly operate Apache Kafka on Kubernetes through its various features, like fine-grain broker configuration, metrics based scaling with rebalancing, rack awareness, and graceful rolling upgrades - just to name a few.
Check out Supertubes in action on your own clusters:
Register for an evaluation version and run a simple install command!
As you might know, Cisco has recently acquired Banzai Cloud. Currently we are in a transitional period and are moving our infrastructure. Contact us so we can discuss your needs and requirements, and organize a live demo.
Evaluation downloads are temporarily suspended. Contact us to discuss your needs and requirements, and organize a live demo.
supertubes install -a --no-demo-cluster --kubeconfig <path-to-k8s-cluster-kubeconfig-file>or read the documentation for details.
Take a look at some of the Kafka features that we’ve automated and simplified through Supertubes and the Koperator , which we’ve already blogged about:
- Oh no! Yet another Kafka operator for Kubernetes
- Monitor and operate Kafka based on Prometheus metrics
- Kafka rack awareness on Kubernetes
- Running Apache Kafka over Istio - benchmark
- User authenticated and access controlled clusters with the Koperator
- Kafka rolling upgrade and dynamic configuration on Kubernetes
- Envoy protocol filter for Kafka, meshed
- Right-sizing Kafka clusters on Kubernetes
- Kafka disaster recovery on Kubernetes with CSI
- Kafka disaster recovery on Kubernetes using MirrorMaker2
- The benefits of integrating Apache Kafka with Istio
- Kafka ACLs on Kubernetes over Istio mTLS
- Declarative deployment of Apache Kafka on Kubernetes
- Bringing Kafka ACLs to Kubernetes the declarative way
- Kafka Schema Registry on Kubernetes the declarative way
- Announcing Supertubes 1.0, with Kafka Connect and dashboard
If someone wants to run a Kafka cluster on Kubernetes, they’ll eventually be faced with the question of how best to size the underlying infrastructure and fine-tune Kafka’s configs to meet their throughput requirements. The maximum throughput of a single broker is a function of the throughput of the infrastructural elements it runs on, such as memory, CPU, disk speed, network capacity, etc. Ideally, the configuration of a broker should be fine-tuned in such a way that all the elements of an infrastructure are used at peak performance. In reality, such a setup is difficult, and it’s more likely that users will fine-tune their broker configurations to max out one or two infrastructural elements (e.g. disk, memory or CPU). Generally speaking, a broker delivers its maximum throughput when it is configured such that it flats out the slowest infrastructure element. Therefore, it’s possible for us to get a rough idea of the maximum load a single broker can manage. In theory, we should be able to estimate the number of brokers we’d need to manage a given load. In practice, since there are so many configuration options at all layers, it’s hard, if not impossible, to estimate the delivered throughput of a given setup. Consequently, it’s very difficult to plan a setup around a given throughput.
The approach we usually take with our Supertubes customers is to start with a setup (infrastructure + configuration), then to benchmark that setup, modify the broker configuration, and repeat the whole flow until the slowest infrastructure element is maxed out. That way we get a clearer picture of how many brokers a cluster needs to manage a specific load (the required number of brokers depends on other factors as well, such as a minimum message replica count for resiliency, a partition leaders count, and more). Also, we get a better understanding of which infrastructural element should be scaled vertically.
In this post, we’ll describe the steps we take to flat out the slowest components of our initial setups and to measure the throughput of a Kafka cluster. This high resiliency setup requires a minimum of three brokers (with a min.insync.replicas=3 configuration setting), distributed across three different availability zones. For setting up, scaling, and monitoring Kubernetes infrastructure, we use our own container management platform for hybrid clouds, Pipeline, which supports on-prem (bare metal, VMware) and several clouds (AWS, Azure, Google) as well as any combination of the above.
Infrastructure and Kafka cluster setup considerations 🔗︎
For the examples below we chose AWS as our cloud provider, and EKS as our Kubernetes distribution. The setup can also be achieved with PKE, Banzai Cloud’s CNCF certified Kubernetes distribution.
Disk 🔗︎
Amazon provides different EBS volume types. Both gp2 and io1 are SSD based drives, however, gp2 delivers high throughput in bursts based on accumulated I/O credits, thus we opted for io1, which provides sustained high performance.
Instance types 🔗︎
Kafka’s performance depends heavily on an operating system’s page cache, thus we need instance types that have enough memory for the brokers (JVM) and for the page cache as well. The c5.2xlarge instance type might seem like a good place to start, since it has 16GB memory and is EBS optimized. Where it fails, however, is that it can deliver maximum performance for 30 minutes at least once every 24 hours. If you have a workload that requires sustained maximum performance for longer than 30 minutes, you’ll need to select a different instance type. We did, and chose c5.4xlarge, which can deliver a maximum throughput of 593.75 MB/s. The maximum throughput of an io1 EBS volume is higher than that of a c5.4xlarge VM instance, thus probably the slowest infrastructure element is the I/O throughput of that instance type (which our load test measurements should confirm as well).
Network 🔗︎
Network bandwidth should be large enough when compared to the VM instance and disk throughput, otherwise the network becomes the bottleneck. In our case, the c5.4xlarge has a network bandwidth up to 10 Gbps which is well over the I/O throughput of the VM instance.
Broker deployment 🔗︎
Brokers should be deployed (scheduled by Kubernetes) to dedicated nodes to avoid multiple processes competing for the CPU, memory, network and disk bandwidth of the node.
Java version 🔗︎
Java 11 is the natural choice, as it is docker aware, meaning the JVM will correctly detect the CPUs and memory available to the container where the broker process runs. The JVM knowing its CPU limits is important, since the JVM internally and transparently sets the number of GC threads, and JIT compiler threads. We used the banzaicloud/kafka:2.13-2.4.0 Kafka image, which includes Kafka version 2.4.0 (Scala 2.13) on Java 11.
If you’d like to read more about Java/JVM on Kubernetes, check out some of our older posts:
Broker memory settings 🔗︎
There are two key aspects of broker memory settings: the memory settings for the JVM and the Kubernetes pod. The memory limit set for the pod must be greater than the max heap size in order for the JVM to have room for the Java metaspace, which sits in native memory, and for the operating system’s page cache, which Kafka makes heavy use of. In our test, we ran Kafka brokers with -Xmx4G -Xms2G heap settings and a 10Gi memory limit for the pod. Note that the memory settings for the JVM can be automatically derived from the pod’s memory limit setting by using -XX:MaxRAMPercentage and -XX:MinRAMPercentage.
Broker CPU settings 🔗︎
Generally speaking, performance can be improved by increasing parallelism through increasing the number of threads used by Kafka. The more CPU available to Kafka, the better. In our test we started with a 6 CPU limit for the pod and gradually increased that number to 15 over the course of our benchmarking iterations. Also, we set num.network.threads=12 in broker configuration, in order to have more threads receive requests and send response from/to the network. In the beginning, we found that follower brokers were unable to fetch replicas fast enough, so we raised num.replica.fetchers to 4, to increase the rate at which follower brokers replicated messages from leaders.
Load generating tool 🔗︎
We have to ensure that the load generating tool we select doesn’t flat out before the Kafka cluster we’re benchmarking reaches peak performance. This requires us to benchmark our load generating tool, as well to select instance types that have enough CPUs and memory. That way the tool can generate more load than our test Kafka cluster can ingest. After multiple iterations, we selected 3 x c5.4xlarge instance types, each running an instance of the load generating tool.
Benchmarking 🔗︎
Benchmarking is an iterative process that consists of:
- setting up infrastructure (an EKS cluster, Kafka cluster, load generating tool, as well as Prometheus and Grafana)
- generating a load over a period to filter out spikes in the collected performance indicators
- tuning the infrastructure and broker configuration based on observed performance indicators
- repeating the whole process until we’ve reached the desired Kafka cluster throughput, which is consistently replicable with only slight variations in its measured throughput.
In the following section we describe the steps we performed to benchmark our test cluster:
Tools 🔗︎
Here are the tools we used to rapidly spin up our initial setup, generate a load and measure throughput.
- Banzai Cloud Pipeline to provision an Amazon EKS cluster that has both Prometheus, for collecting Kafka and infrastructure metrics, and Grafana, for visualizing these metrics. We use Pipeline’s integrated services which provide out of the box federated monitoring, centralized log collection, security scans, disaster recovery, enterprise grade security, and lots more
- Kafka cluster load testing tool Sangrenel
- Grafana dashboards for visualizing Kafka and infrastructure metrics: Kubernetes Kafka, Node exporter
- supertubes CLI for setting up a production ready Apache Kafka cluster on Kubernetes in the easiest way possible. Zookeeper,
Koperator
, Envoy, and lots of other components are installed and properly configured to operate a production-ready Apache Kafka cluster on Kubernetes
- To install supertubes CLI following instrauctions described here.

EKS cluster 🔗︎
Provision an EKS cluster with dedicated c5.4xlarge worker nodes in different AZs for Kafka cluster broker pods, as well as dedicated nodes for load generating tool and monitoring infrastructure.
banzai cluster create -f https://raw.githubusercontent.com/banzaicloud/koperator/master/docs/benchmarks/infrastructure/cluster_eks_202001.json
Once the EKS cluster is up and running, enable its integrated Monitoring service, which deploys Prometheus and Grafana to the cluster.
Kafka system components 🔗︎
Set up Kafka’s system components (Zookeeper, Koperator ) on EKS, using the supertubes CLI.
supertubes install -a --no-democluster --kubeconfig <path-to-eks-cluster-kubeconfig-file>
Kafka cluster 🔗︎
The default storage class on EKS uses gp2 EBS volumes, so we need to create a separate storage class that uses an io1 EBS volume for our Kafka cluster:
kubectl create -f - <<EOF
apiVersion: storage.k8s.io/v1
kind: StorageClass
metadata:
  name: fast-ssd
provisioner: kubernetes.io/aws-ebs
parameters:
  type: io1
  iopsPerGB: "50"
  fsType: ext4
volumeBindingMode: WaitForFirstConsumer
EOF
Provision a three broker Kafka cluster with min.insync.replicas=3, and deploy the broker pods to nodes in three different availability zones:
supertubes cluster create -n kafka --kubeconfig <path-to-eks-cluster-kubeconfig-file> -f https://raw.githubusercontent.com/banzaicloud/koperator/master/docs/benchmarks/infrastructure/kafka_202001_3brokers.yaml --wait --timeout 600
Topics 🔗︎
We ran three instances of the load generator tool in parallel, each writing to a different topic. That means we needed three topics:
supertubes cluster topic create -n kafka --kubeconfig <path-to-eks-cluster-kubeconfig-file> -f -<<EOF
apiVersion: kafka.banzaicloud.io/v1alpha1
kind: KafkaTopic
metadata:
  name: perftest1
spec:
  name: perftest1
  partitions: 12
  replicationFactor: 3
  retention.ms: '28800000'
  cleanup.policy: delete
EOF

supertubes cluster topic create -n kafka --kubeconfig <path-to-eks-cluster-kubeconfig-file> -f -<<EOF
apiVersion: kafka.banzaicloud.io/v1alpha1
kind: KafkaTopic
metadata:
    name: perftest2
spec:
  name: perftest2
  partitions: 12
  replicationFactor: 3
  retention.ms: '28800000'
  cleanup.policy: delete
EOF

supertubes cluster topic create -n kafka --kubeconfig <path-to-eks-cluster-kubeconfig-file> -f -<<EOF
apiVersion: kafka.banzaicloud.io/v1alpha1
kind: KafkaTopic
metadata:
  name: perftest3
spec:
  name: perftest3
  partitions: 12
  replicationFactor: 3
  retention.ms: '28800000'
  cleanup.policy: delete
EOF
Each topic has a replication factor of 3 which is the minimum recommended replication factor for high availability production systems.
Load generator tool 🔗︎
We ran three instances of the load generator tool, each writing to a separate topic. We used node affinity for the load generator pods to ensure that these were scheduled to the nodes dedicated to them:
apiVersion: extensions/v1beta1
kind: Deployment
metadata:
  labels:
    app: loadtest
  name: perf-load1
  namespace: kafka
spec:
  progressDeadlineSeconds: 600
  replicas: 1
  revisionHistoryLimit: 10
  selector:
    matchLabels:
      app: loadtest
  strategy:
    rollingUpdate:
      maxSurge: 25%
      maxUnavailable: 25%
    type: RollingUpdate
  template:
    metadata:
      creationTimestamp: null
      labels:
        app: loadtest
    spec:
      affinity:
        nodeAffinity:
          requiredDuringSchedulingIgnoredDuringExecution:
            nodeSelectorTerms:
            - matchExpressions:
              - key: nodepool.banzaicloud.io/name
                operator: In
                values:
                - loadgen
      containers:
      - args:
        - -brokers=kafka-0:29092,kafka-1:29092,kafka-2:29092,kafka-3:29092
        - -topic=perftest1
        - -required-acks=all
        - -message-size=512
        - -workers=20
        image: banzaicloud/perfload:0.1.0-blog
        imagePullPolicy: Always
        name: sangrenel
        resources:
          limits:
            cpu: 2
            memory: 1Gi
          requests:
            cpu: 2
            memory: 1Gi
        terminationMessagePath: /dev/termination-log
        terminationMessagePolicy: File
      dnsPolicy: ClusterFirst
      restartPolicy: Always
      schedulerName: default-scheduler
      securityContext: {}
      terminationGracePeriodSeconds: 30
A few things to note:
-
The load generator tool (producer) generates 512 bytes length messages and publishes them to Kafka in batches of 500 messages.
-
The
-required-acks=allargument specifies waiting until the all-insync replicas of the message are committed and confirmed by Kafka brokers before considering a publishing successful. This means that in our benchmark we’re measuring not only the throughput of the leaders ingesting messages, but also of followers replicating messages. It is beyond the scope of this benchmark to run consumers to gauge the reading performance of recently committed messages that are still in the OS page cache vs those retrieved from the disk. -
The load generator runs
-workers=20in parallel, with each worker containing 5 producers that share the worker connection to the Kafka cluster. This resulted in 100 producers per load generator publishing messages to the Kafka cluster.
Observing cluster state 🔗︎
Throughout the load testing of the Kafka cluster we also monitored the health of the cluster to make sure there were no out-of-sync replicas and pod restarts, all while max throughput with only slight fluctuations was maintained:
- The load generator writes standard out stats on the number of messages it publishes and their success rate. This error rate should stay at
0.00% - Cruise Control deployed by Koperator provides a dashboard where we can track the state of the cluster as well. To visualize this dashboard run:
supertubes cluster cruisecontrol show -n kafka --kubeconfig <path-to-eks-cluster-kubeconfig-file>
- ISR shrink and expansion rate is
0
Measurement results 🔗︎
3 brokers, 512 bytes messages size 🔗︎
With partitions distributed evenly across the three brokers, we reached ~500 MB/s (~990K messages per second) ingested by the cluster:


The JVM’s memory consumption stayed below 2GB:


Disk throughput neared the maximum I/O throughput of the node on all three instances where the brokers were running:


From the memory usage of the nodes we can see that ~10-15 GB was used by the OS for caching and buffering:


3 brokers, 100 bytes messages size 🔗︎
We get a ~15-20% lower throughput when the messages are small, since the overhead of processing each message takes its toll. Also, we see an increase in CPU usage, which has almost doubled.


Since there are still unused cores available on the broker nodes, throughput can be increased by tweaking various Kafka configuration settings. This is no easy task, and thus it’s better to work with larger messages to achieve higher throughput.
4 brokers, 512 bytes message size 🔗︎
We can easily increase the throughput of the Kafka cluster by adding new brokers to the cluster, as long as the partitions are balanced (this ensures even distribution of the load across the brokers). With the addition of a broker, the throughput increased to ~580 MB/s (~1,1M messages per second) ingested by the cluster. This increase is less than what we expected, which can largely be attributed to partitions being unbalanced; not all brokers are at peak performance.


JVM memory consumption stayed below 2GB:


The disk usage of brokers also reflected that the partitions were not evenly balanced:


Takeaway 🔗︎
The iterative approach presented above can be extended to cover more complex scenarios that include hundreds of consumers, repartitioning, rolling upgrades, pod restarts, etc, providing us with an understanding of the limits of the Kafka cluster under various conditions - wherein there are bottlenecks and potential remedies to help manage them.
To quickly iterate through a cluster setup, configs, add/remove brokers and topics, monitoring, to react to alerts, and to properly operate Kafka on Kubernetes in general, we built Supertubes. Our goal is to help you focus on your core business - produce and consume Kafka messages, and let us do all the heavy lifting with Supertubes and our Koperator .
About Supertubes 🔗︎
Banzai Cloud Supertubes (Supertubes) is the automation tool for setting up and operating production-ready Apache Kafka clusters on Kubernetes, leveraging a Cloud-Native technology stack. Supertubes includes Zookeeper, the Koperator , Envoy, Istio and many other components that are installed, configured, and managed to operate a production-ready Kafka cluster on Kubernetes. Some of the key features are fine-grained broker configuration, scaling with rebalancing, graceful rolling upgrades, alert-based graceful scaling, monitoring, out-of-the-box mTLS with automatic certificate renewal, Kubernetes RBAC integration with Kafka ACLs, and multiple options for disaster recovery.


