

The MENU > OVERVIEW page on the Backyards web interface shows information about your mesh.

If your application hasn’t received any traffic yet, there will be no metrics in the system so you won’t see any visualization yet. To send some traffic to your services as a test, see Generate test load.
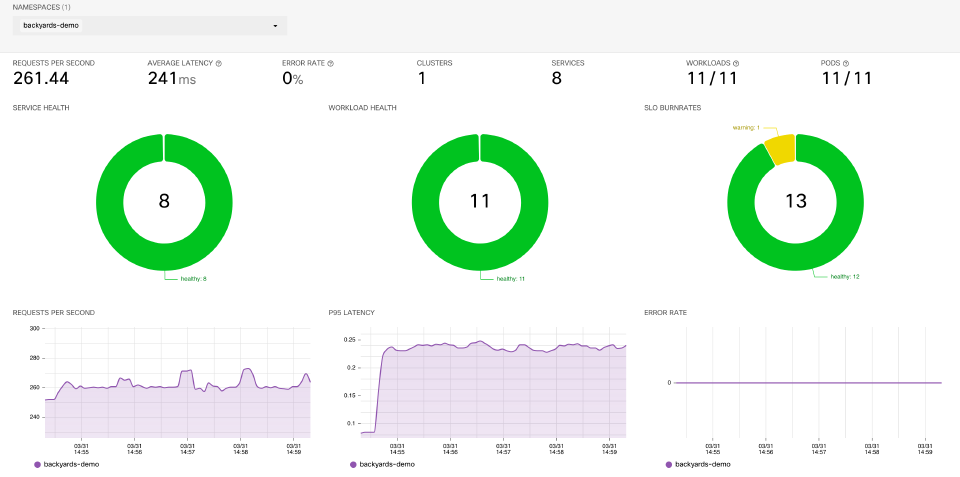
The page shows the following information and controls:
Statistics 🔗︎
- Requests per second
- Average latency (95th percentile)
- Error rate (for 5XX errors)
- Clusters (number of clusters in the mesh)
- Services (number of services in the mesh / total number of services)
- Workloads (number of workloads in the mesh / total number of workloads)
- Pods (number of pods in the mesh / total number of pods)
Dashboards 🔗︎
The OVERVIEW page shows charts about the health of the services and workloads, as well as the aggregated status of your service level objectives (SLOs). Click on the chart to get more information, for example, about the SLO burn rates that display warnings.
The OVERVIEW page also shows the following live Grafana dashboards:
- Requests per second
- Average latency (95th percentile)
- Error rate (for 5XX errors)


