
One of the core features of the Istio service mesh is the observability of network traffic. Because all service-to-service communication is going through Envoy proxies, and Istio’s control plane is able to gather logs and metrics from these proxies, the service mesh can give you deep insights about your network.
But Istio needs some additional components to unleash its full potential of observing the mesh. Prometheus collects these metrics from Envoy proxies or from Mixer and Grafana displays monitoring information on analytics dashboards.
Backyards builds an integrated, production-ready environment of these components with a single CLI command. Prometheus is set up to scrape Envoys and Mixer, and Grafana dashboards are automatically configured for services and workloads in the mesh.
Note: Backyards provides an end-to-end monitoring solution built on Service Level Objectives. To start using this feature, see Tracking Service Level Objectives (SLOs).
Try it out! 🔗︎
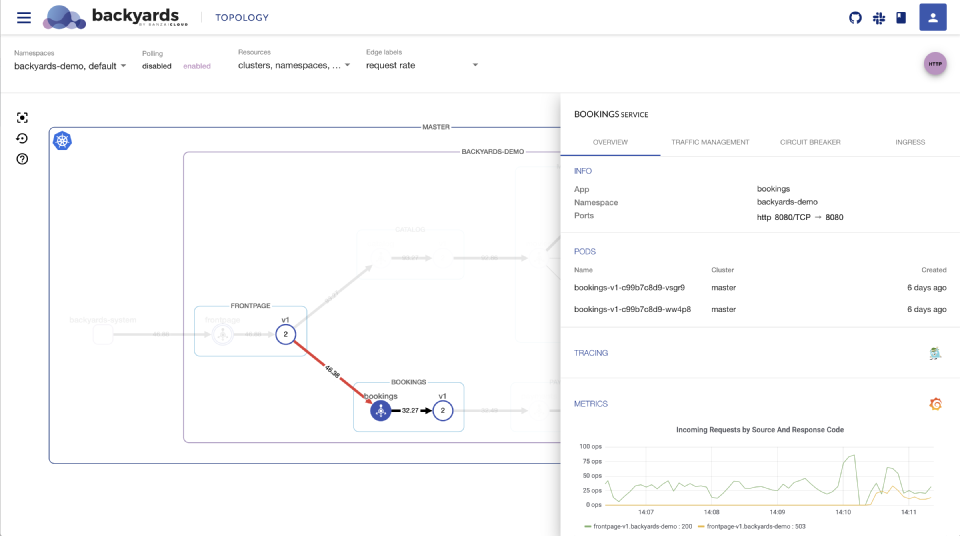
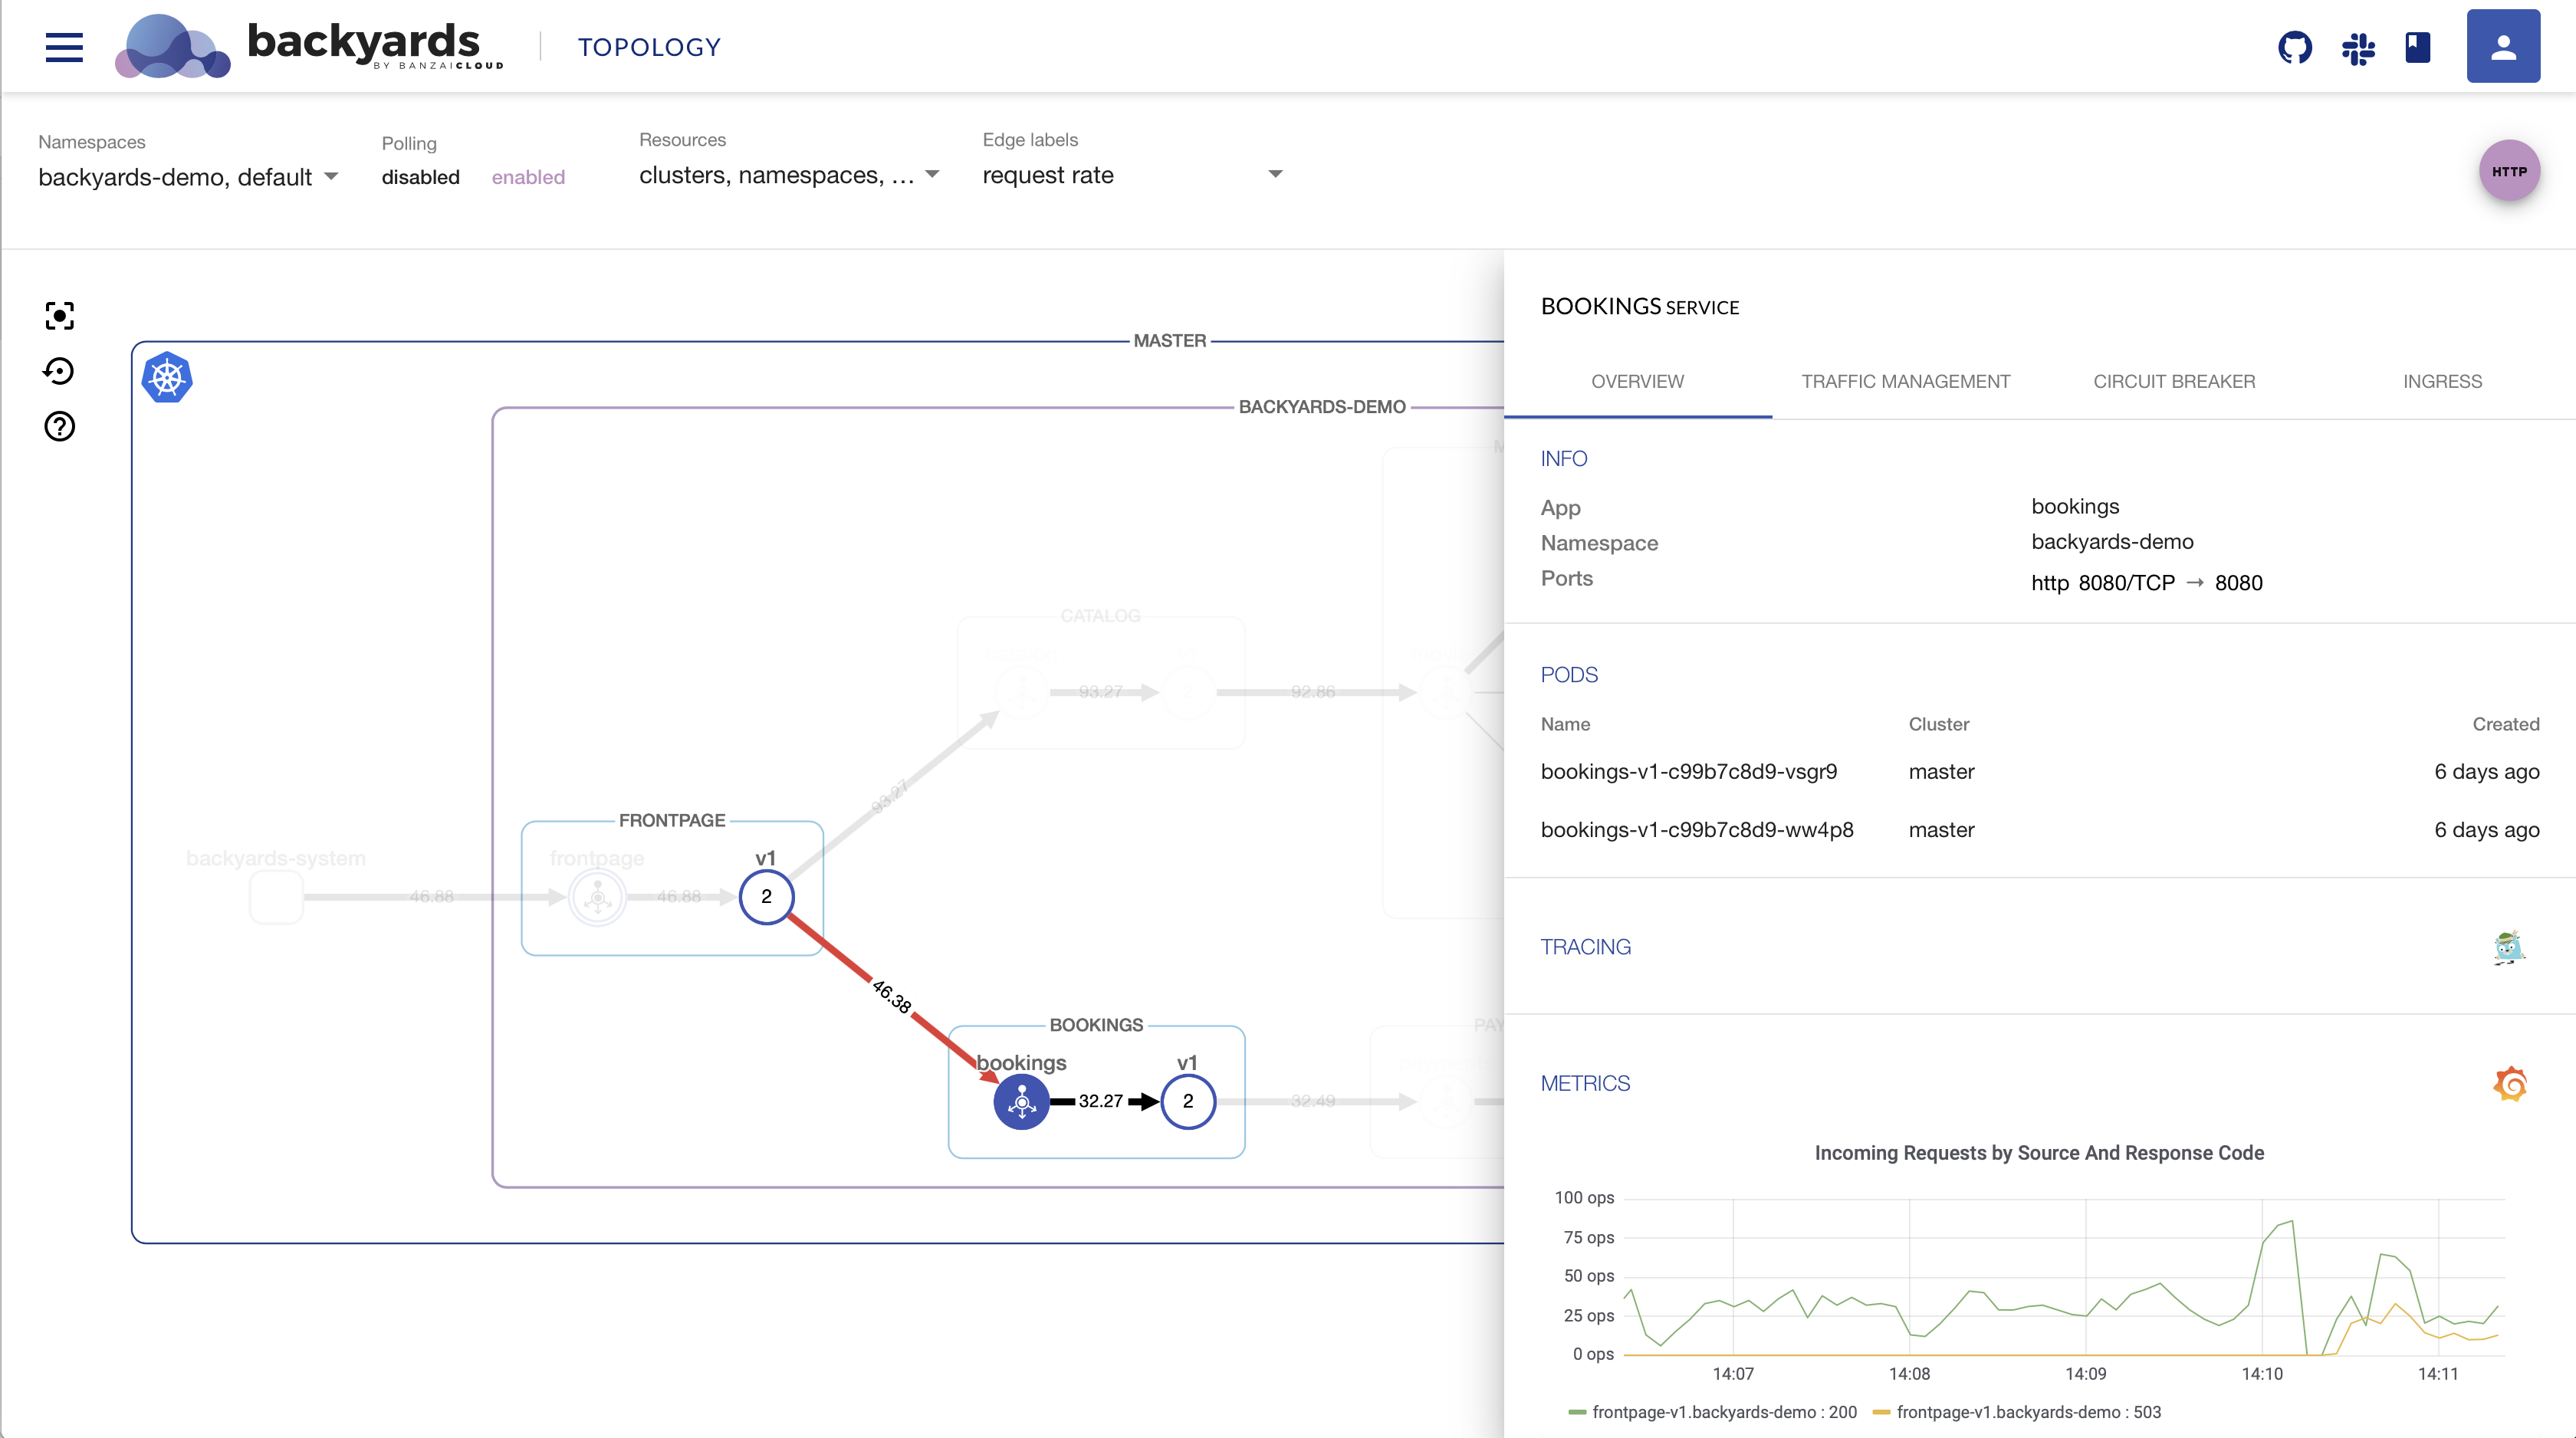
The topology and service list views on the Backyards UI serve as starting points to diagnose problems within the mesh. You’ll see if error rates are up for a specific service, RPS is down or latency increases.
Some Grafana dashboards are available directly in the service view, but for more in-depths analytics, you’ll probably need to dig deeper into Grafana dashboards, or directly into Prometheus metrics. To access a specific Grafana dashboard from Backyards, just click the Grafana link on the service or workload view.
To access the Backyards UI from your machine, use the
backyards dashboardcommand
Advanced use-cases 🔗︎
-
Grafana and Prometheus are installed in the
backyards-systemnamespace and are available on an internal ingress gateway. When usingbackyards dashboard, that internal ingress gateway is securely proxied from the cluster, so Backyards will be accessible from localhost. Grafana and Prometheus is also available on the ingress gateway, and they are proxied on separate URIs. Grafana is accessible directly on http://127.0.0.1:50500/grafana, while Prometheus is available on http://127.0.0.1:50500/prometheus. -
Federating Istio metrics from the Prometheus instance of Backyards. Currently it’s not possible to specify an external Prometheus instance to use when installing Backyards. If you have other metrics on another Prometheus instance, and want to have them in one place, we suggest to setup federation between the two Prometheus instances.


