
You can drill-down from the MENU > TOPOLOGY page by selecting a service or a workload in the Istio service mesh. You can trace back an issue from the top-level service mesh layer by navigating deeper in the stack, and see the status and most important metrics of your Kubernetes controllers, pods, and nodes.
For an example on how you can diagnose and solve a real-life using the drill-down view, see the Backyards drill-down blog post.
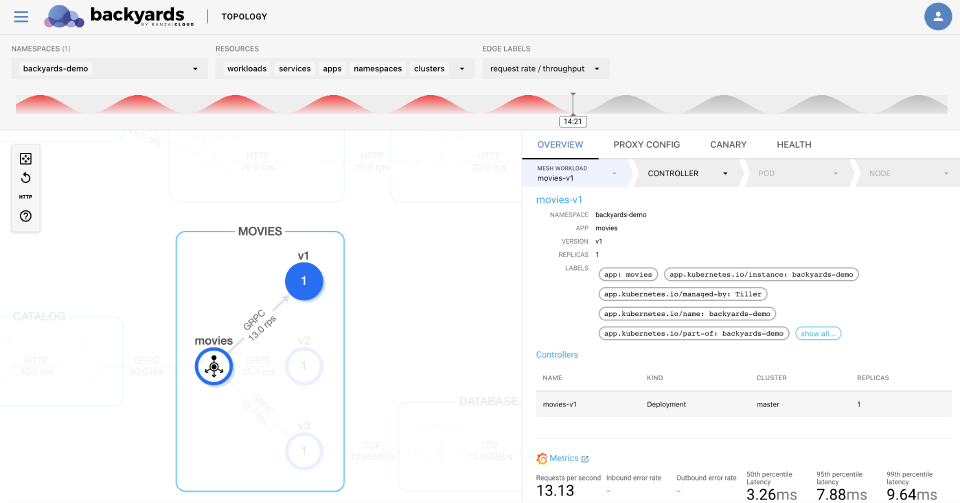
Topology view 🔗︎
The highest level of the Topology view is the service mesh layer. This level contains the most important network-level metrics, and an overview of the corresponding Kubernetes controllers.
Click on a workload (![]() ) or service (
) or service (![]() ) to display its details on the right.
) to display its details on the right.
From the details overview, you can drill down through the following levels to the underlying resources of the infrastructure:
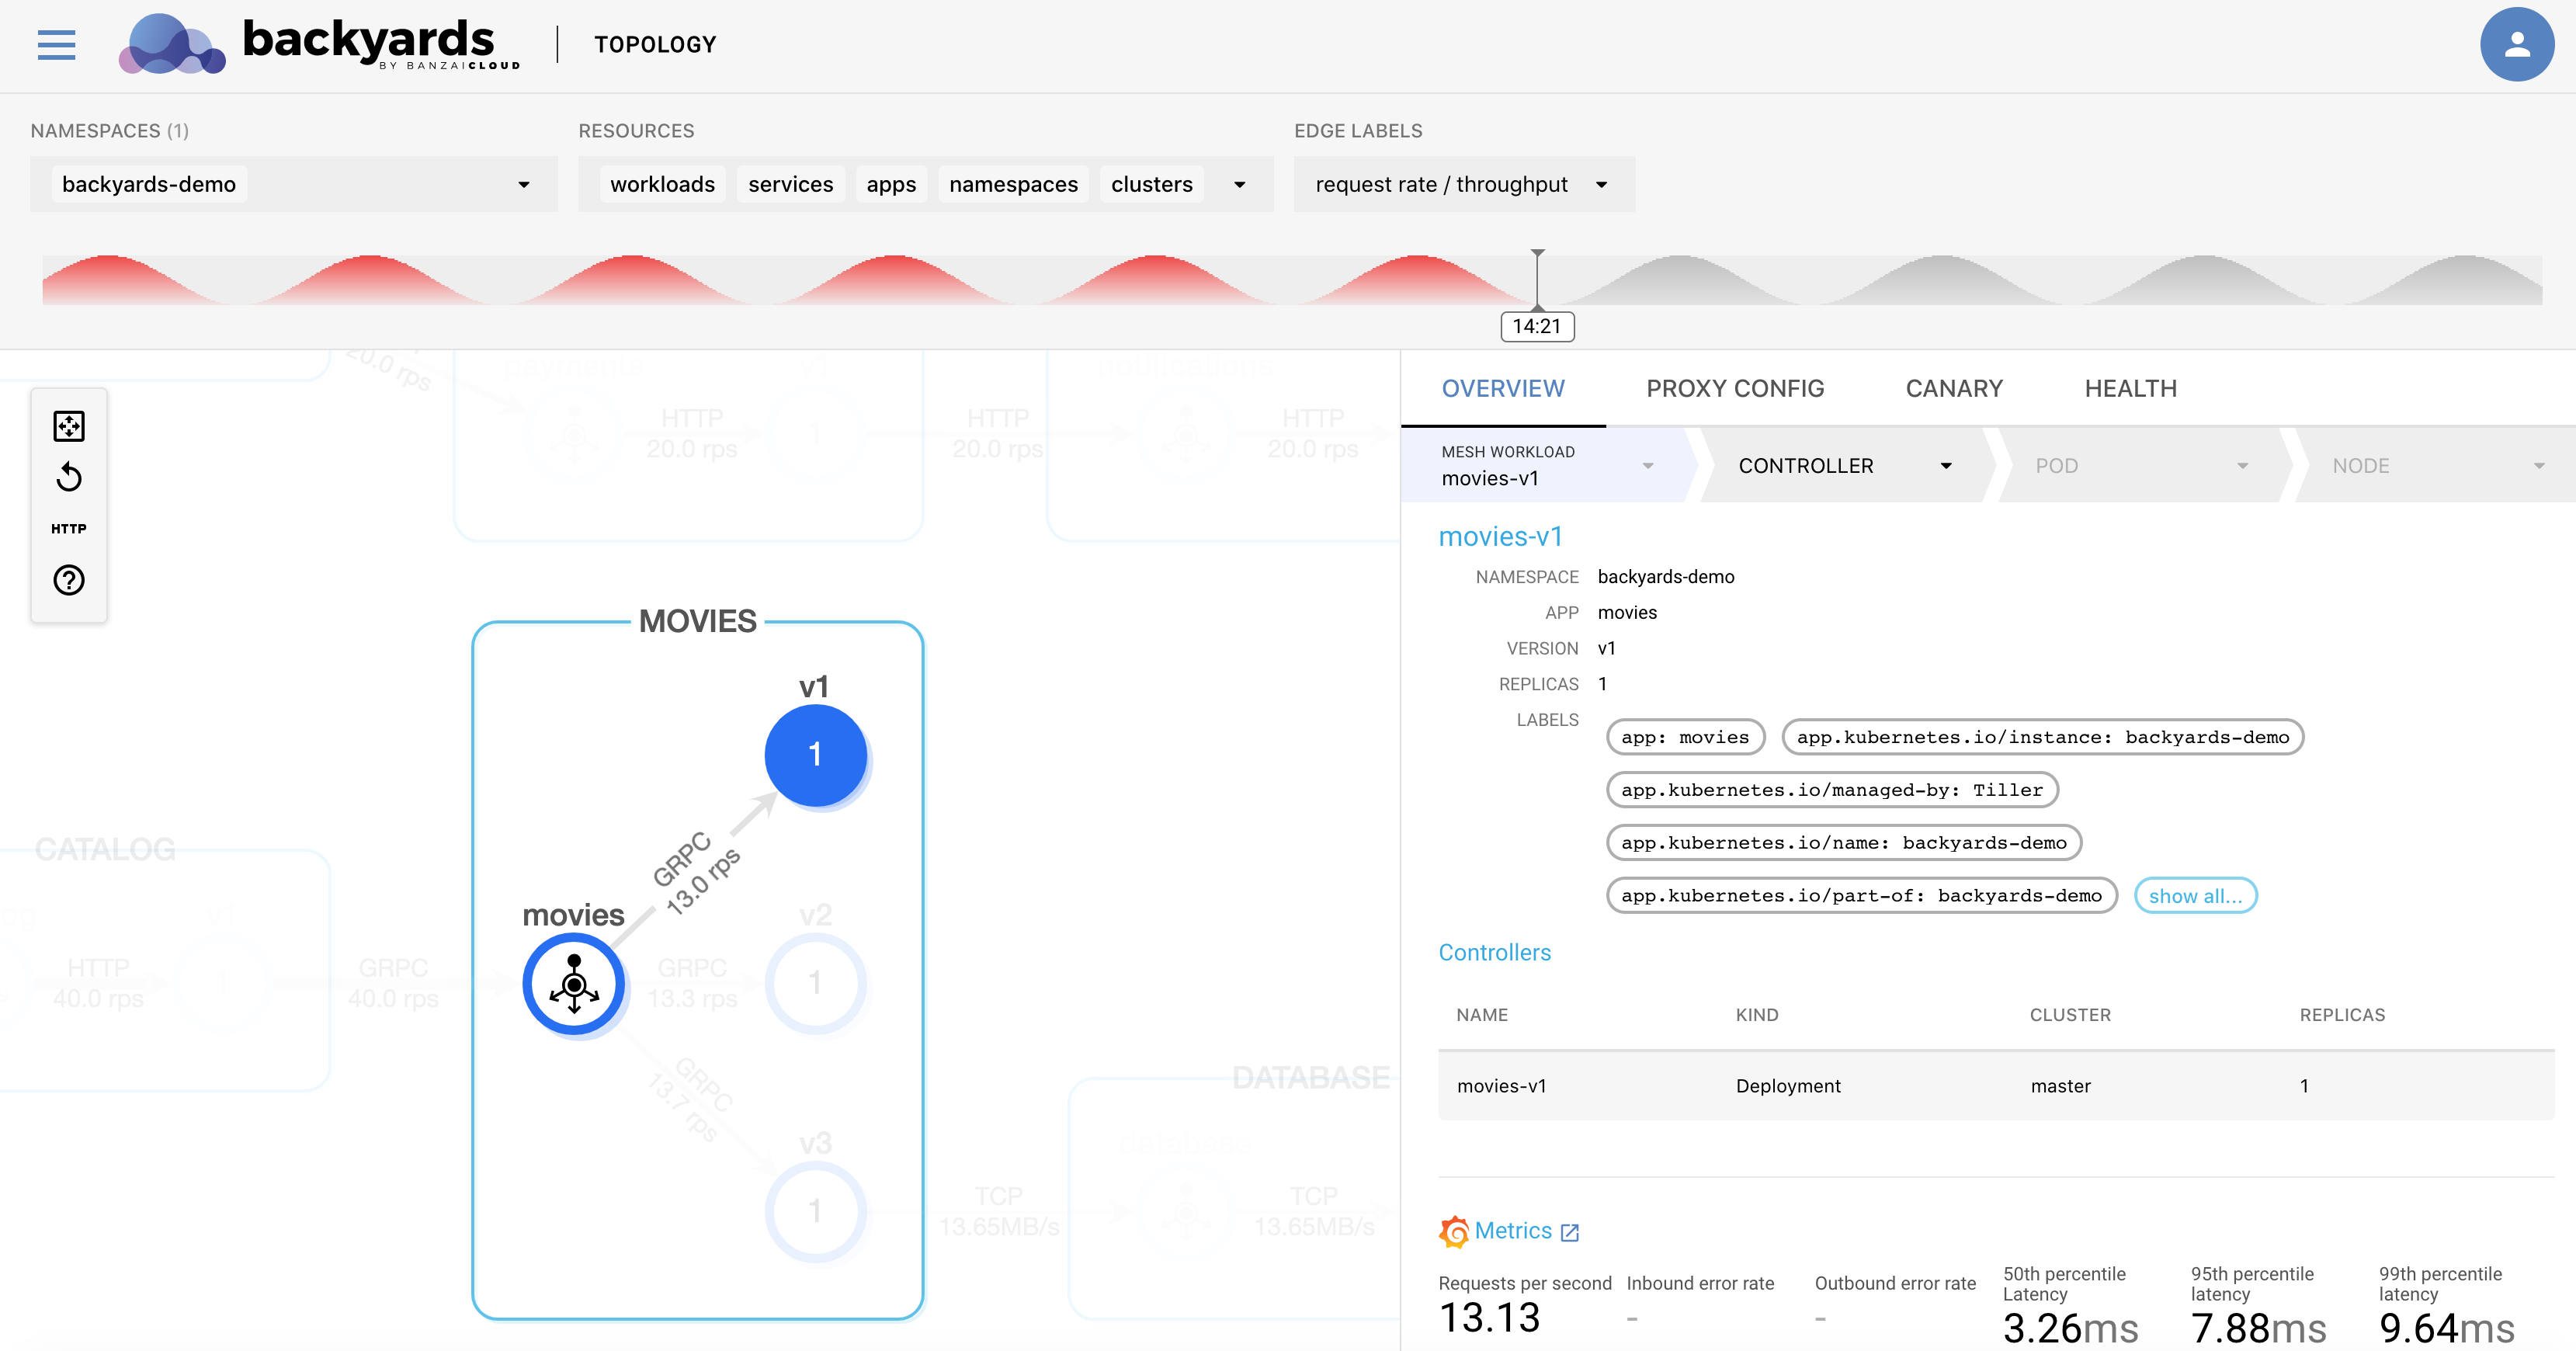
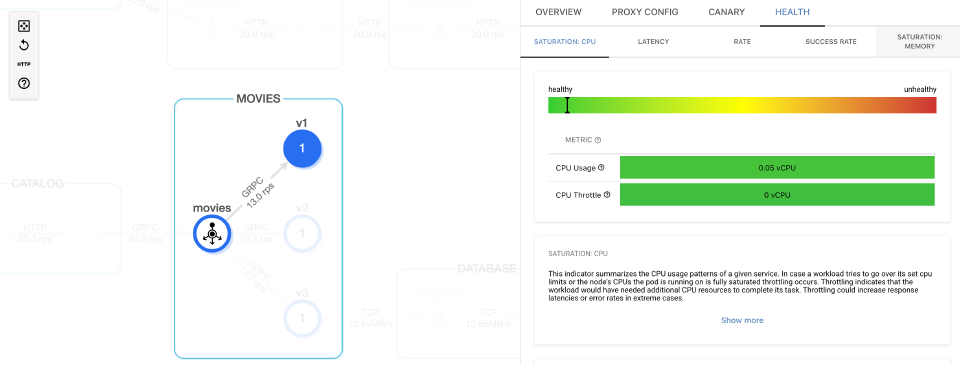
To display the metrics-based health of the workload or the service, select the HEALTH tab. You can scroll down to display the charts of the selected metric (for example, saturation, latency, or success rate).
Service details 🔗︎
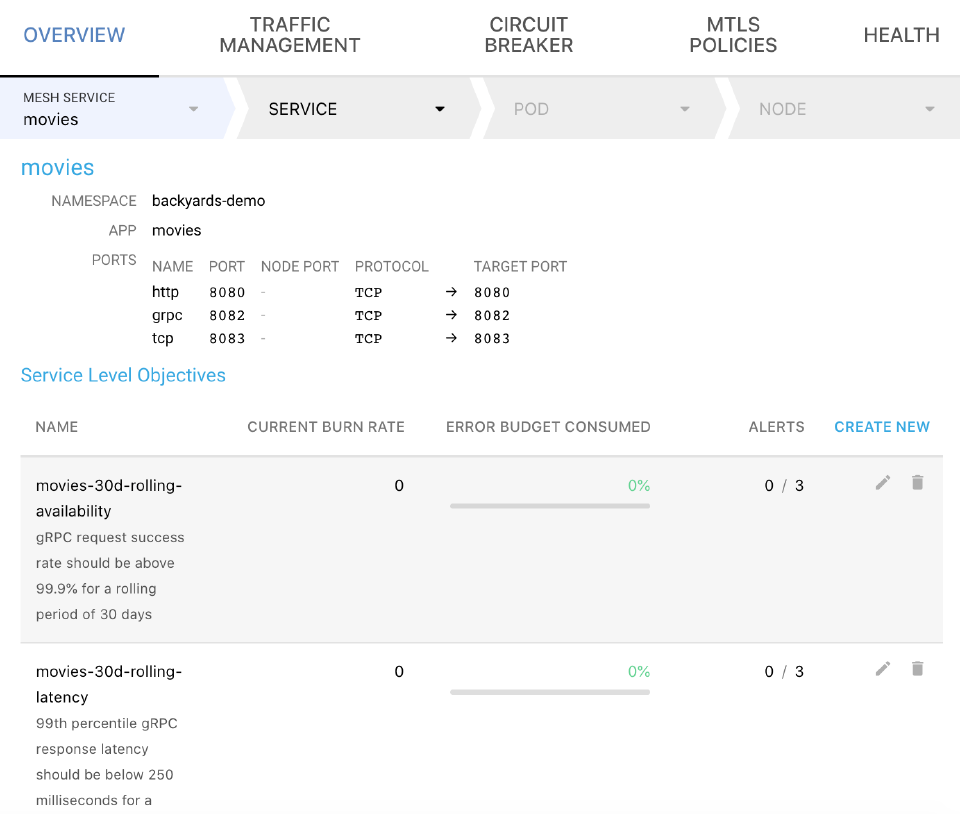
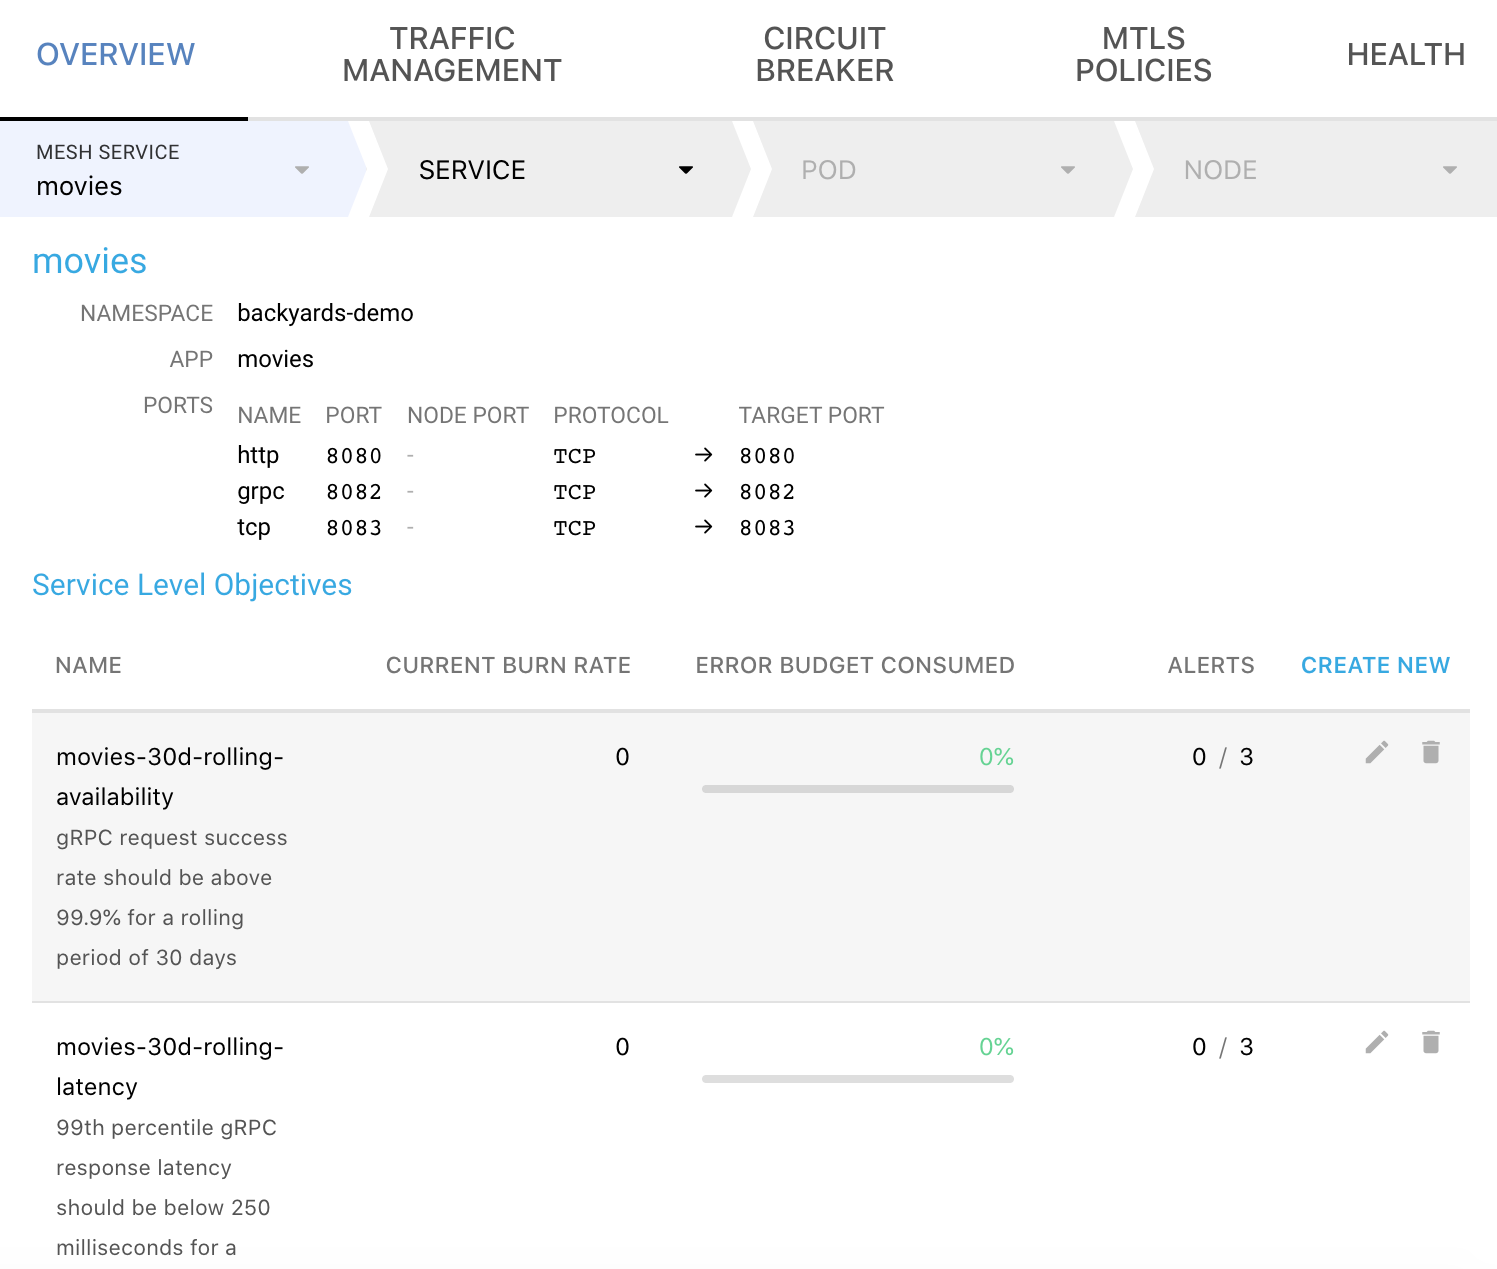
The following details of the service are displayed:
-
Namespace: The namespace the service belongs to.
-
APP: The application exposed using the service.
-
PORTS: The ports where the service is accessible, for example:
http 8080/TCP → 8080 grpc 8082/TCP → 8082 tcp 8083/TCP → 8083 -
Services: The services exposed in this resource. Click on the name of the service to display the details of the service.
-
Metrics: Dashboards of the most important metrics. Click
 to open the related dashboards in Grafana.
 -
Traces: Click
 to run tracing with Jaeger.
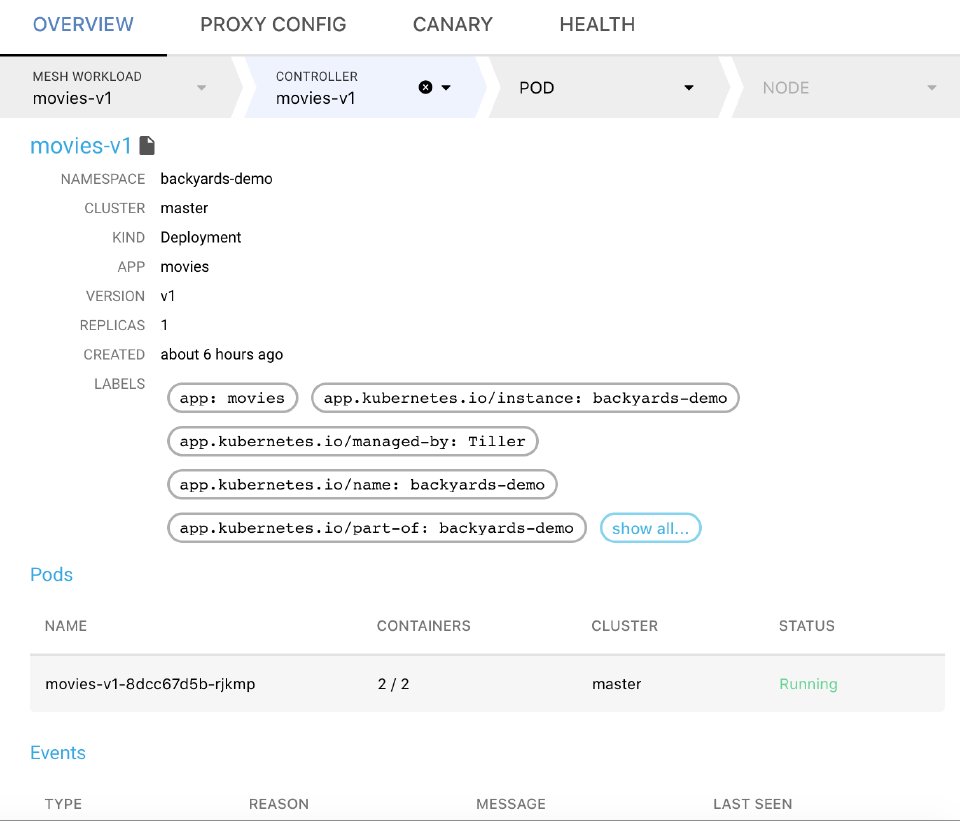
Workload details 🔗︎
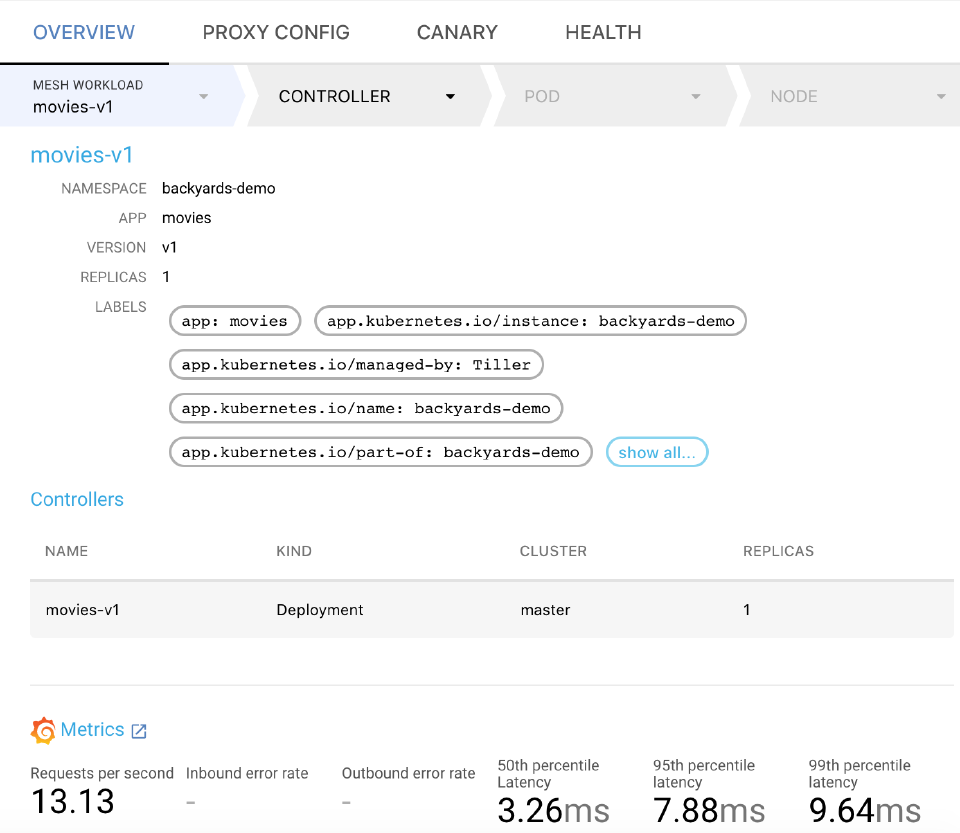

The following details of the workload are displayed:
- Namespace: The namespace the workload belongs to.
- APP: The application running in the workload.
- VERSION: The version number of the workload, for example, v2.
- REPLICAS: The number of replicas for the workload.
- LABELS: The list of Kubernetes labels assigned to the resource.
- Controllers: The controllers related to the workload. Click on a controller to display its details.
- Metrics: Dashboards of the most important metrics. Click to open the related dashboards in Grafana.
Service details 🔗︎
Select a Service in the SERVICE section of a service overview to display the details of the service.
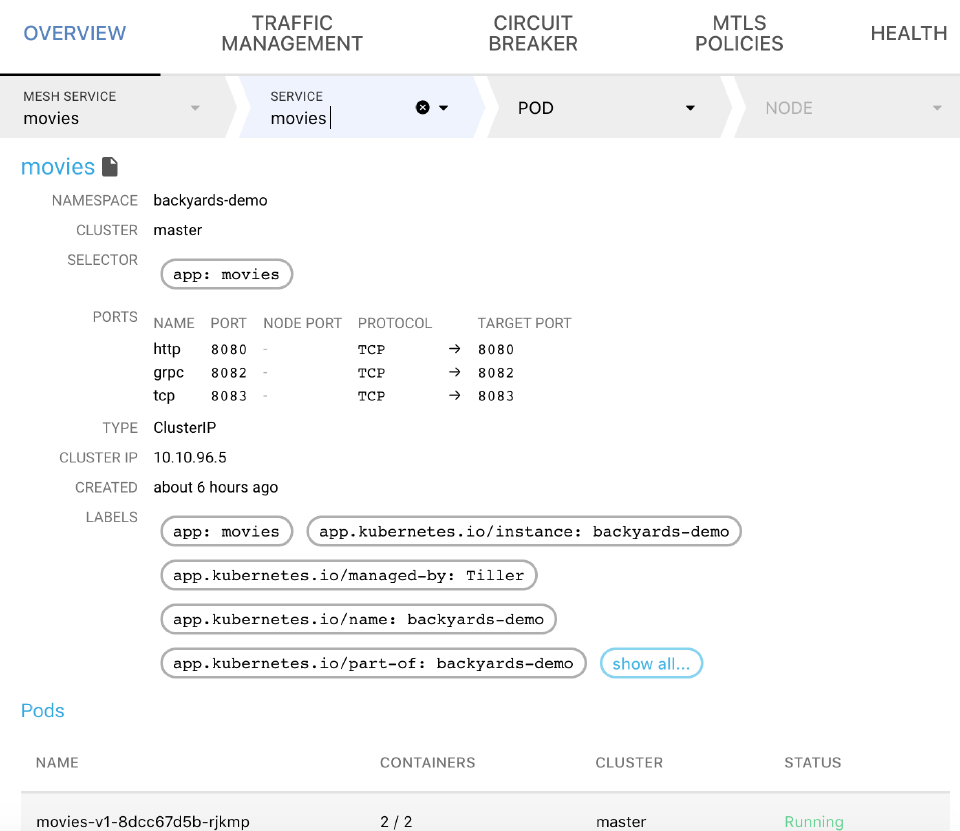
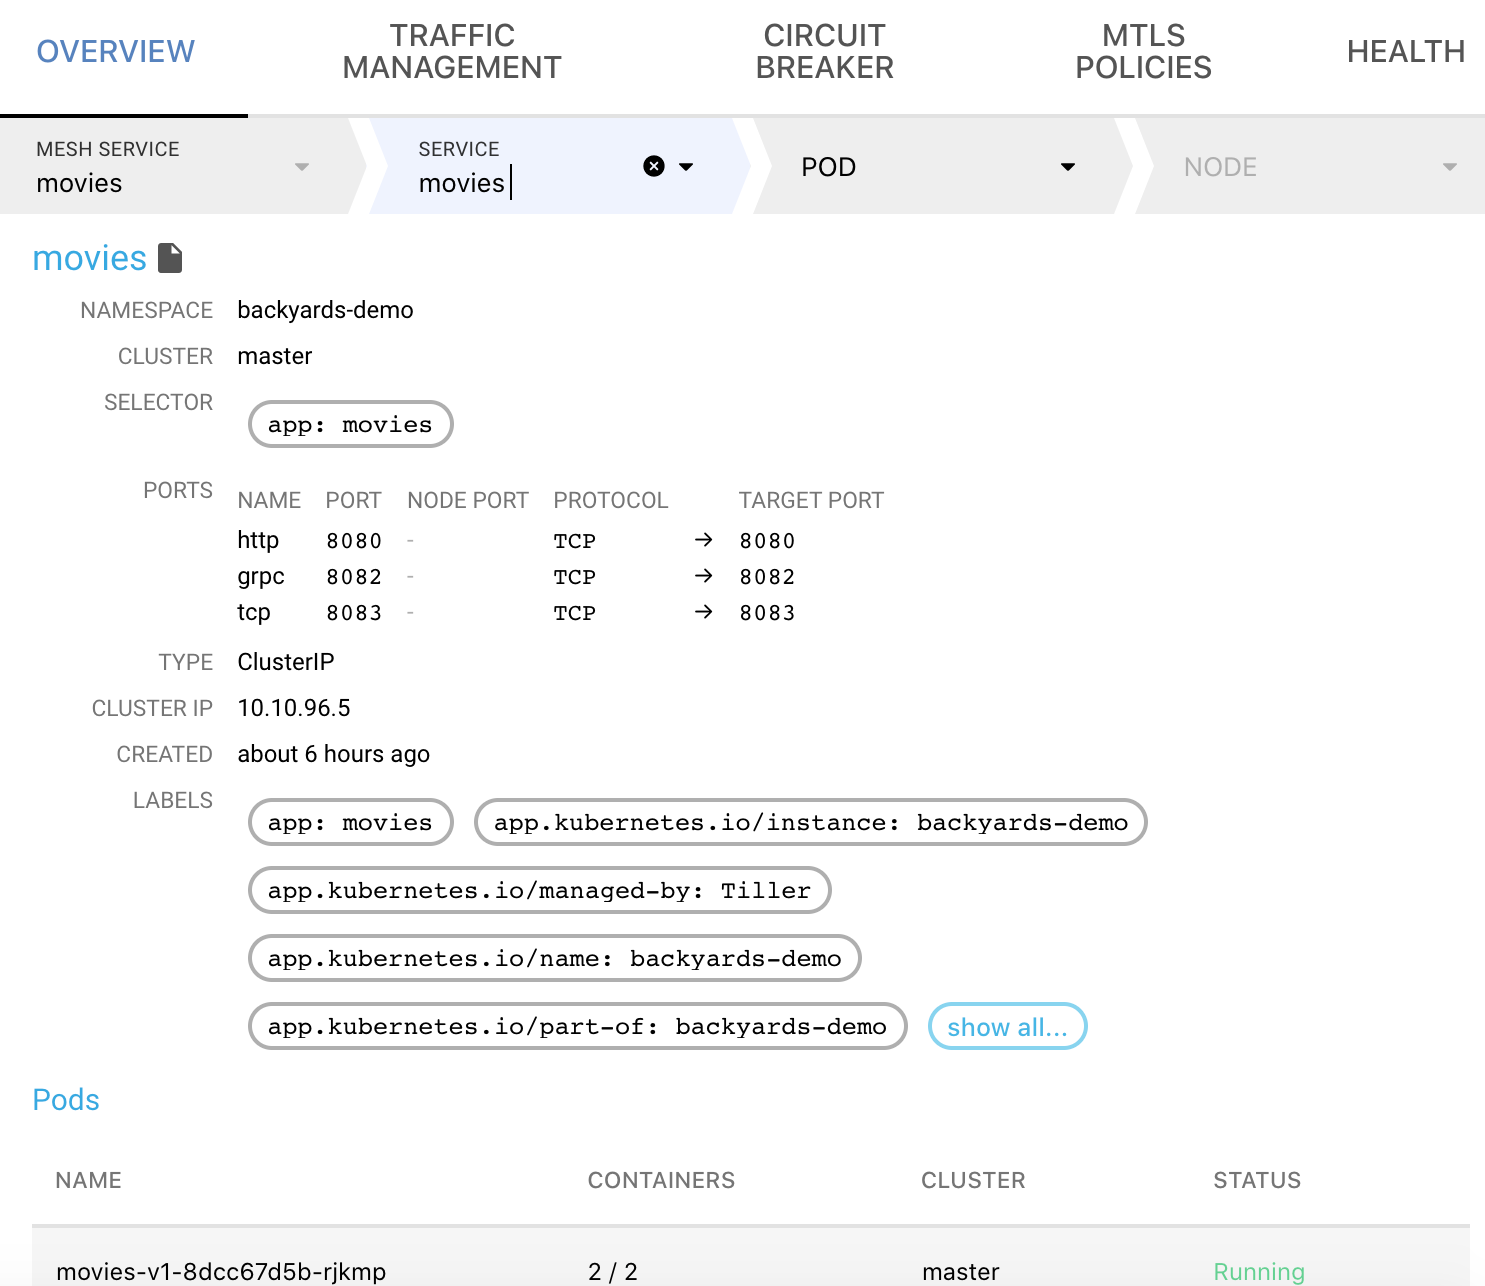
The following details of the service are displayed:
-
Namespace: The namespace the service belongs to.
-
CLUSTER: The name of the Kubernetes cluster the service belongs to.
-
SELECTOR: The label selector used to select the set of Pods targeted by the Service.
-
PORTS: The ports where the service is accessible, for example:
http 8080/TCP → 8080 grpc 8082/TCP → 8082 tcp 8083/TCP → 8083 -
TYPE: The ServiceType indicates how your service is exposed, for example, ClusterIP or LoadBalancer.
-
CLUSTER IP: The IP address corresponding to the ServiceType.
-
CREATED: The date when the service was started.
-
LABELS: The list of Kubernetes labels assigned to the resource.
-
Pods: The list of pods running this service, including their name, number of containers in the pod, and their status. Click on the name of the pod to display the details of the pod.
-
Events: Recent events related to the service resource.
Workload controller details 🔗︎
Select a deployment in the CONTROLLER section of a workload to display the details of the deployment.This view contains detailed information about the Kubernetes controller.
While the service mesh layer displays network level metrics and an aggregated view of the corresponding controllers, this view focuses on CPU and memory metrics, and the Kubernetes resources, like related pods or events. It’s also possible that multiple controllers belong to the same service mesh entity, for example, in a shared control plane multi-cluster scenario, when multiple clusters are running controllers that belong to the same logical workload.
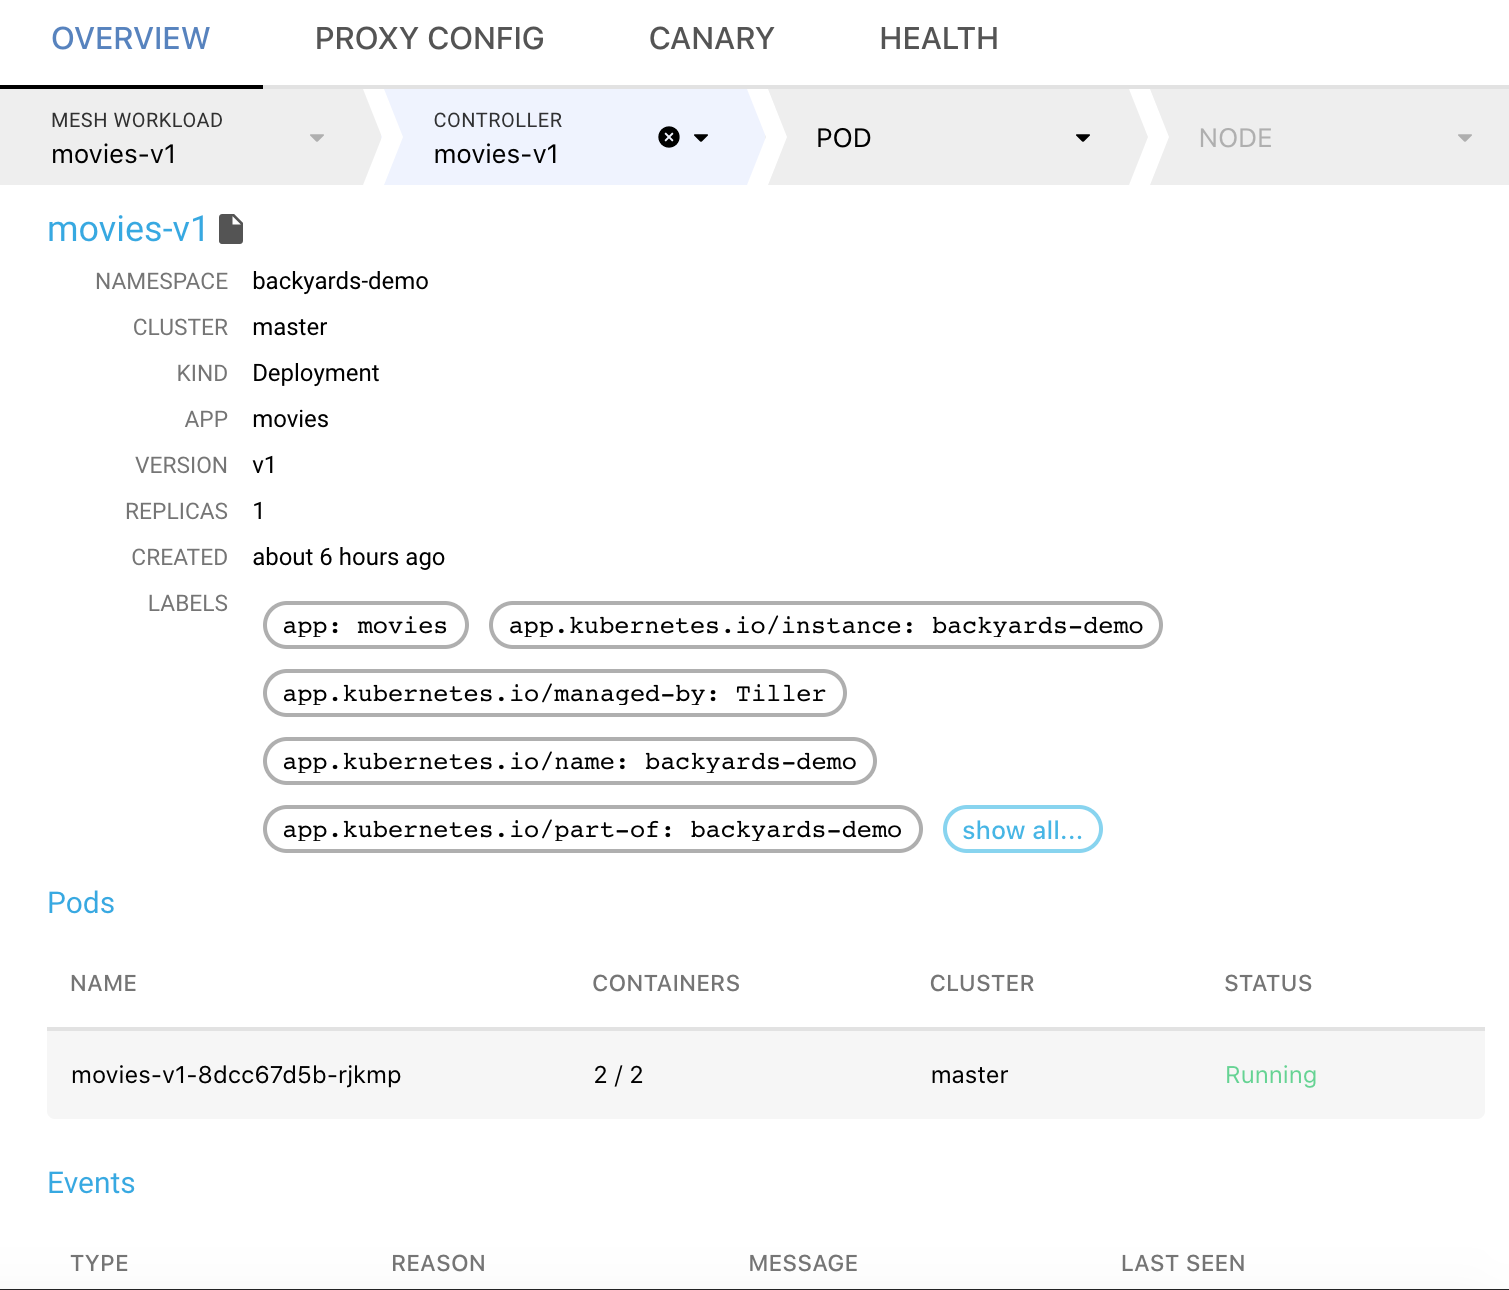
The following details of the workload controller are displayed:
- Namespace: The namespace the workload belongs to.
- CLUSTER: The name of the Kubernetes cluster the workload belongs to.
- Kind: The type of the controller, for example, Deployment.
- APP: The application running in the workload.
- VERSION: The version number of the workload, for example, v2.
- REPLICAS: The number of replicas for the workload.
- CREATED: The date when the workload was started.
- LABELS: The list of Kubernetes labels assigned to the resource.
- Pods: The list of pods running this workload. Click on the name of the pod to display the details of the pod.
- Events: Recent events related to the resource.
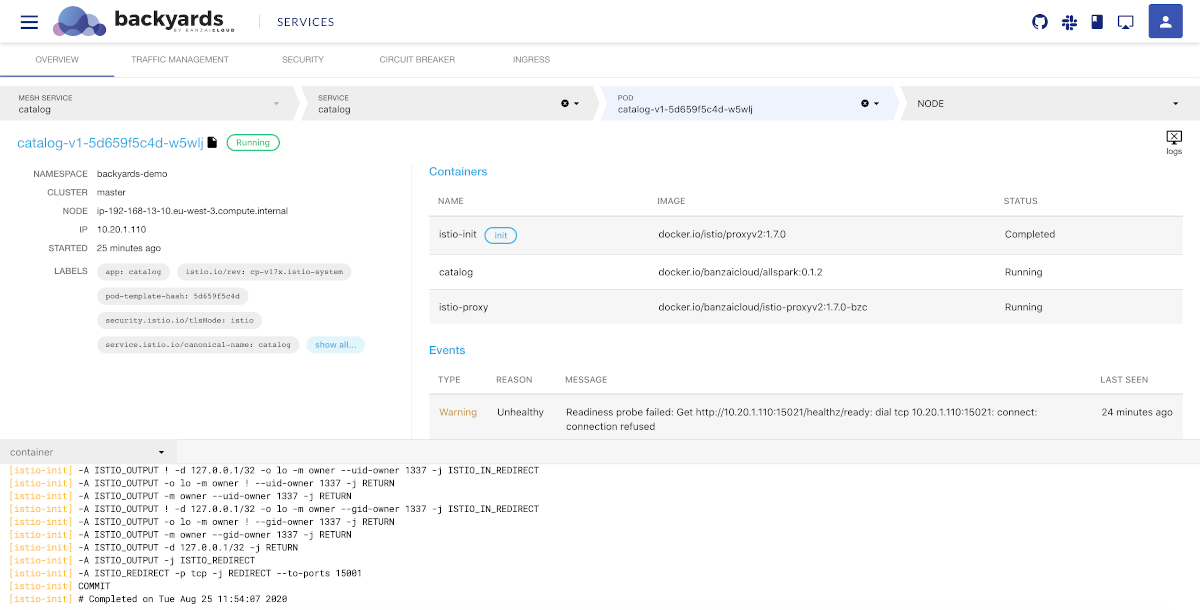
Pod details 🔗︎
To check the details of a pod, select a pod in the CONTROLLER > POD or the SERVICE > POD section.
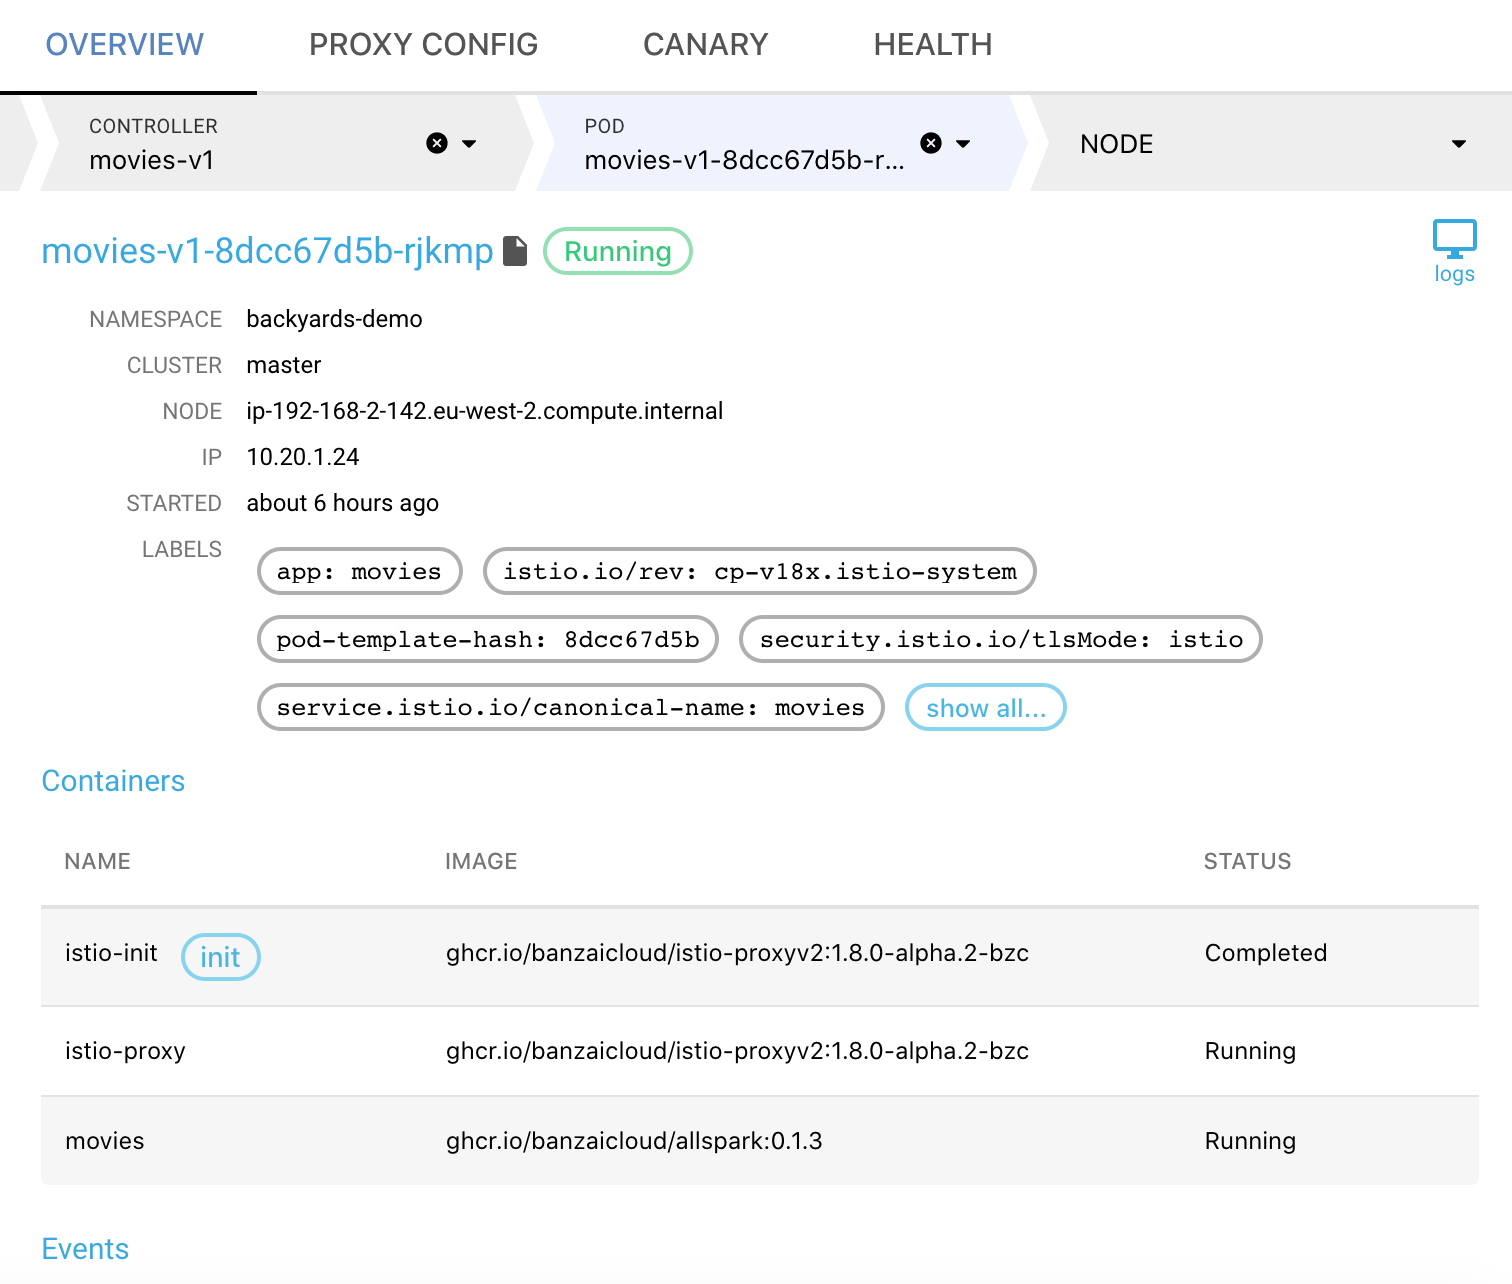
The following details of the pod are displayed:
- Namespace: The namespace the pod belongs to.
- CLUSTER: The name of the Kubernetes cluster the pod belongs to.
- NODE: The hostname of the node the pod is running on, for example, ip-192-168-1-1.us-east-2.compute.internal. Click on the name of the node to display the details of the node.
- IP: The IP address of the pod.
- STARTED: The date when the pod was started.
- LABELS: The list of Kubernetes labels assigned to the resource.
- Containers: The list of containers in the pod. Also includes the Name, Image, and Status of the container.
- Events: Recent events related to the resource.
- Metrics: Dashboards of the most important metrics. Click to open the related dashboards in Grafana.
To display the logs of the pod, click the ![]() icon. The pod logs are displayed at the bottom of the screen.
icon. The pod logs are displayed at the bottom of the screen.
Node details 🔗︎
To check the health of a node, select a node in the pod details view. The node view is the deepest layer of the drill-down view and shows information about a Kubernetes node.
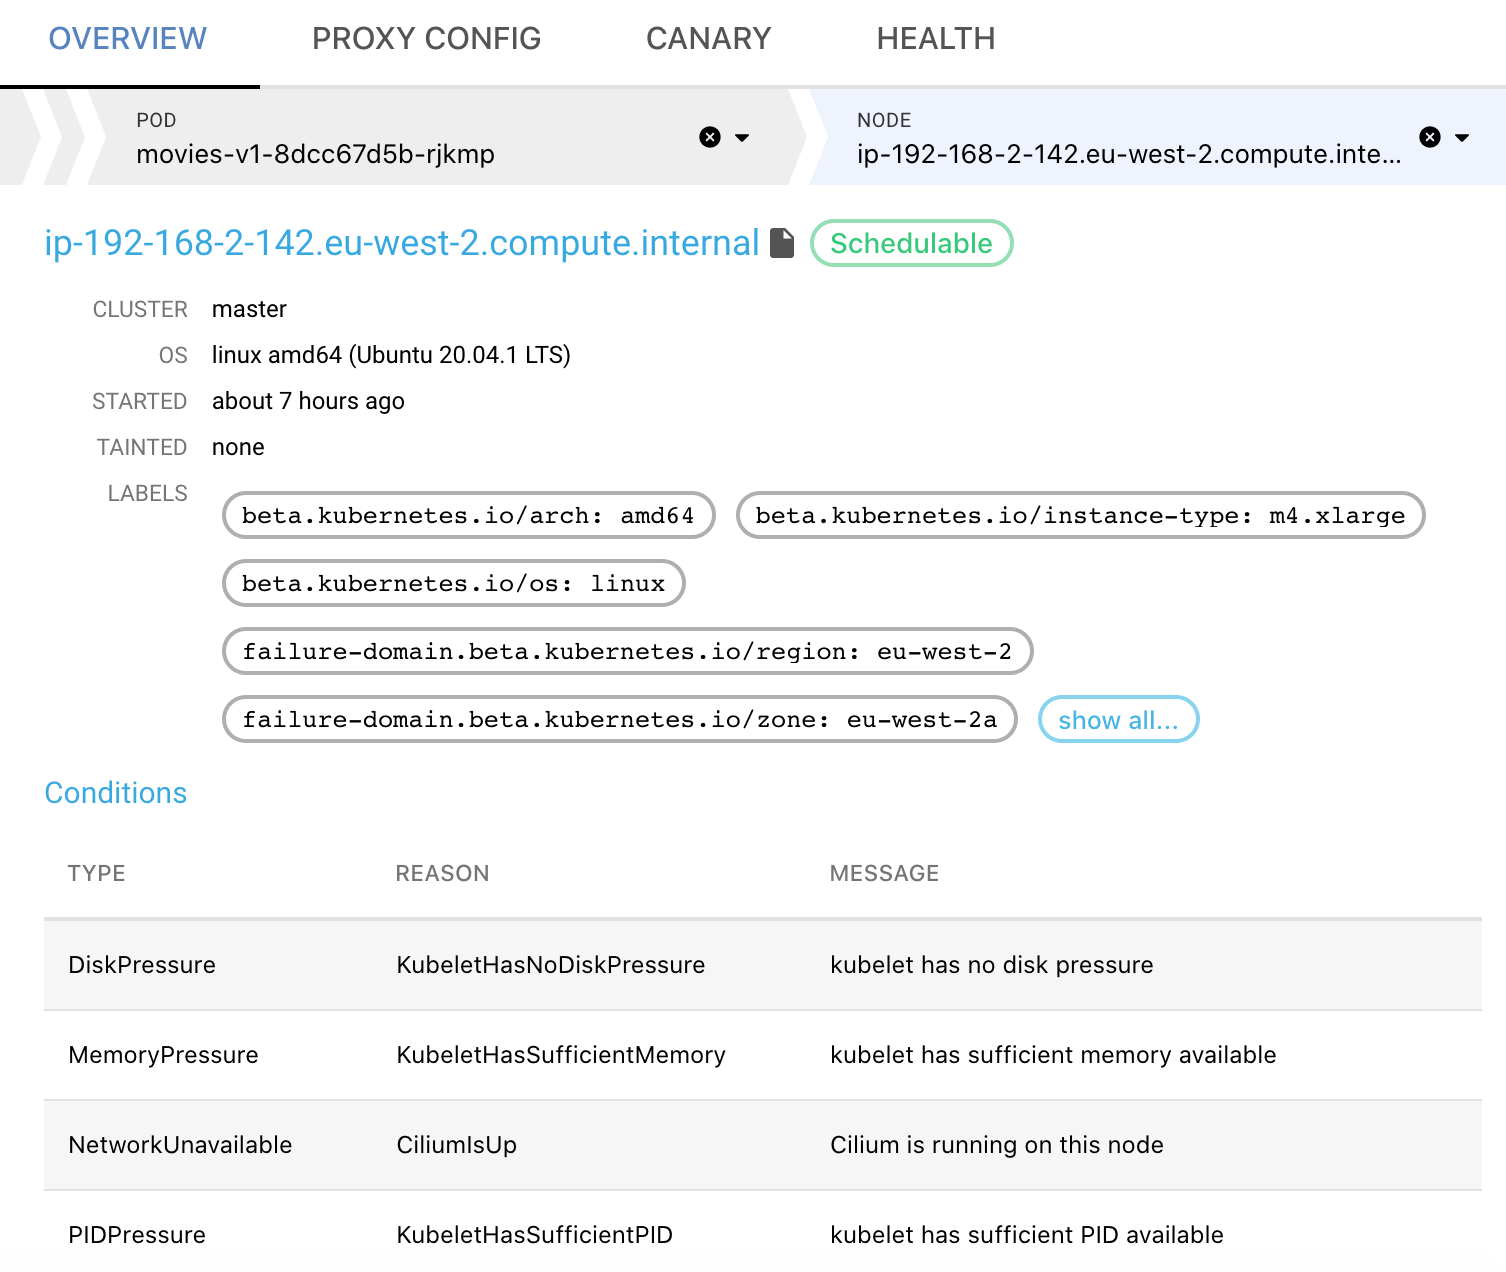
The following details of the node that the pod is running on are displayed:
- CLUSTER: The name of the Kubernetes cluster the node belongs to.
- OS: The operating system running on the node, for example: linux amd64 (Ubuntu 18.04.4 LTS)
- STARTED: The date when the node was started.
- TAINTS: The list of Kubernetes taints assigned to the node.
- LABELS: The list of Kubernetes labels assigned to the node.
- Conditions: The status of the node, for example, disk and memory pressure, or network and kubelet status.
- Pods: The list of pods currently running on the node.
- Events: Recent events related to the node.
- Metrics: Dashboards of the most important metrics. Click to open the related dashboards in Grafana.


