
Distributed tracing is the process of tracking individual requests throughout their whole call stack in the system.
With distributed tracing in place it is possible to visualize full call stacks, to see which service called which service, how long each call took and how much were the network latencies between them. It is possible to tell where a request failed or which service took too much time to respond.
Backyards uses Istio’s - and therefore Envoy’s - distributed tracing feature under the hood.
To collect and visualize this information Istio comes with tools like Jaeger, Zipkin, Lightstep and Datadog. Jaeger is the default tool and so far the most popular one.
Try it out! 🔗︎
- Jaeger is installed automatically by default when installing Backyards.
- The demo application uses golang services which are configured to propagate the necessary tracing headers.
When utilizing distributed tracing for your own services, you need to implement context propagation for yourself!
- When load is sent to the application then traces can be perceived right away.
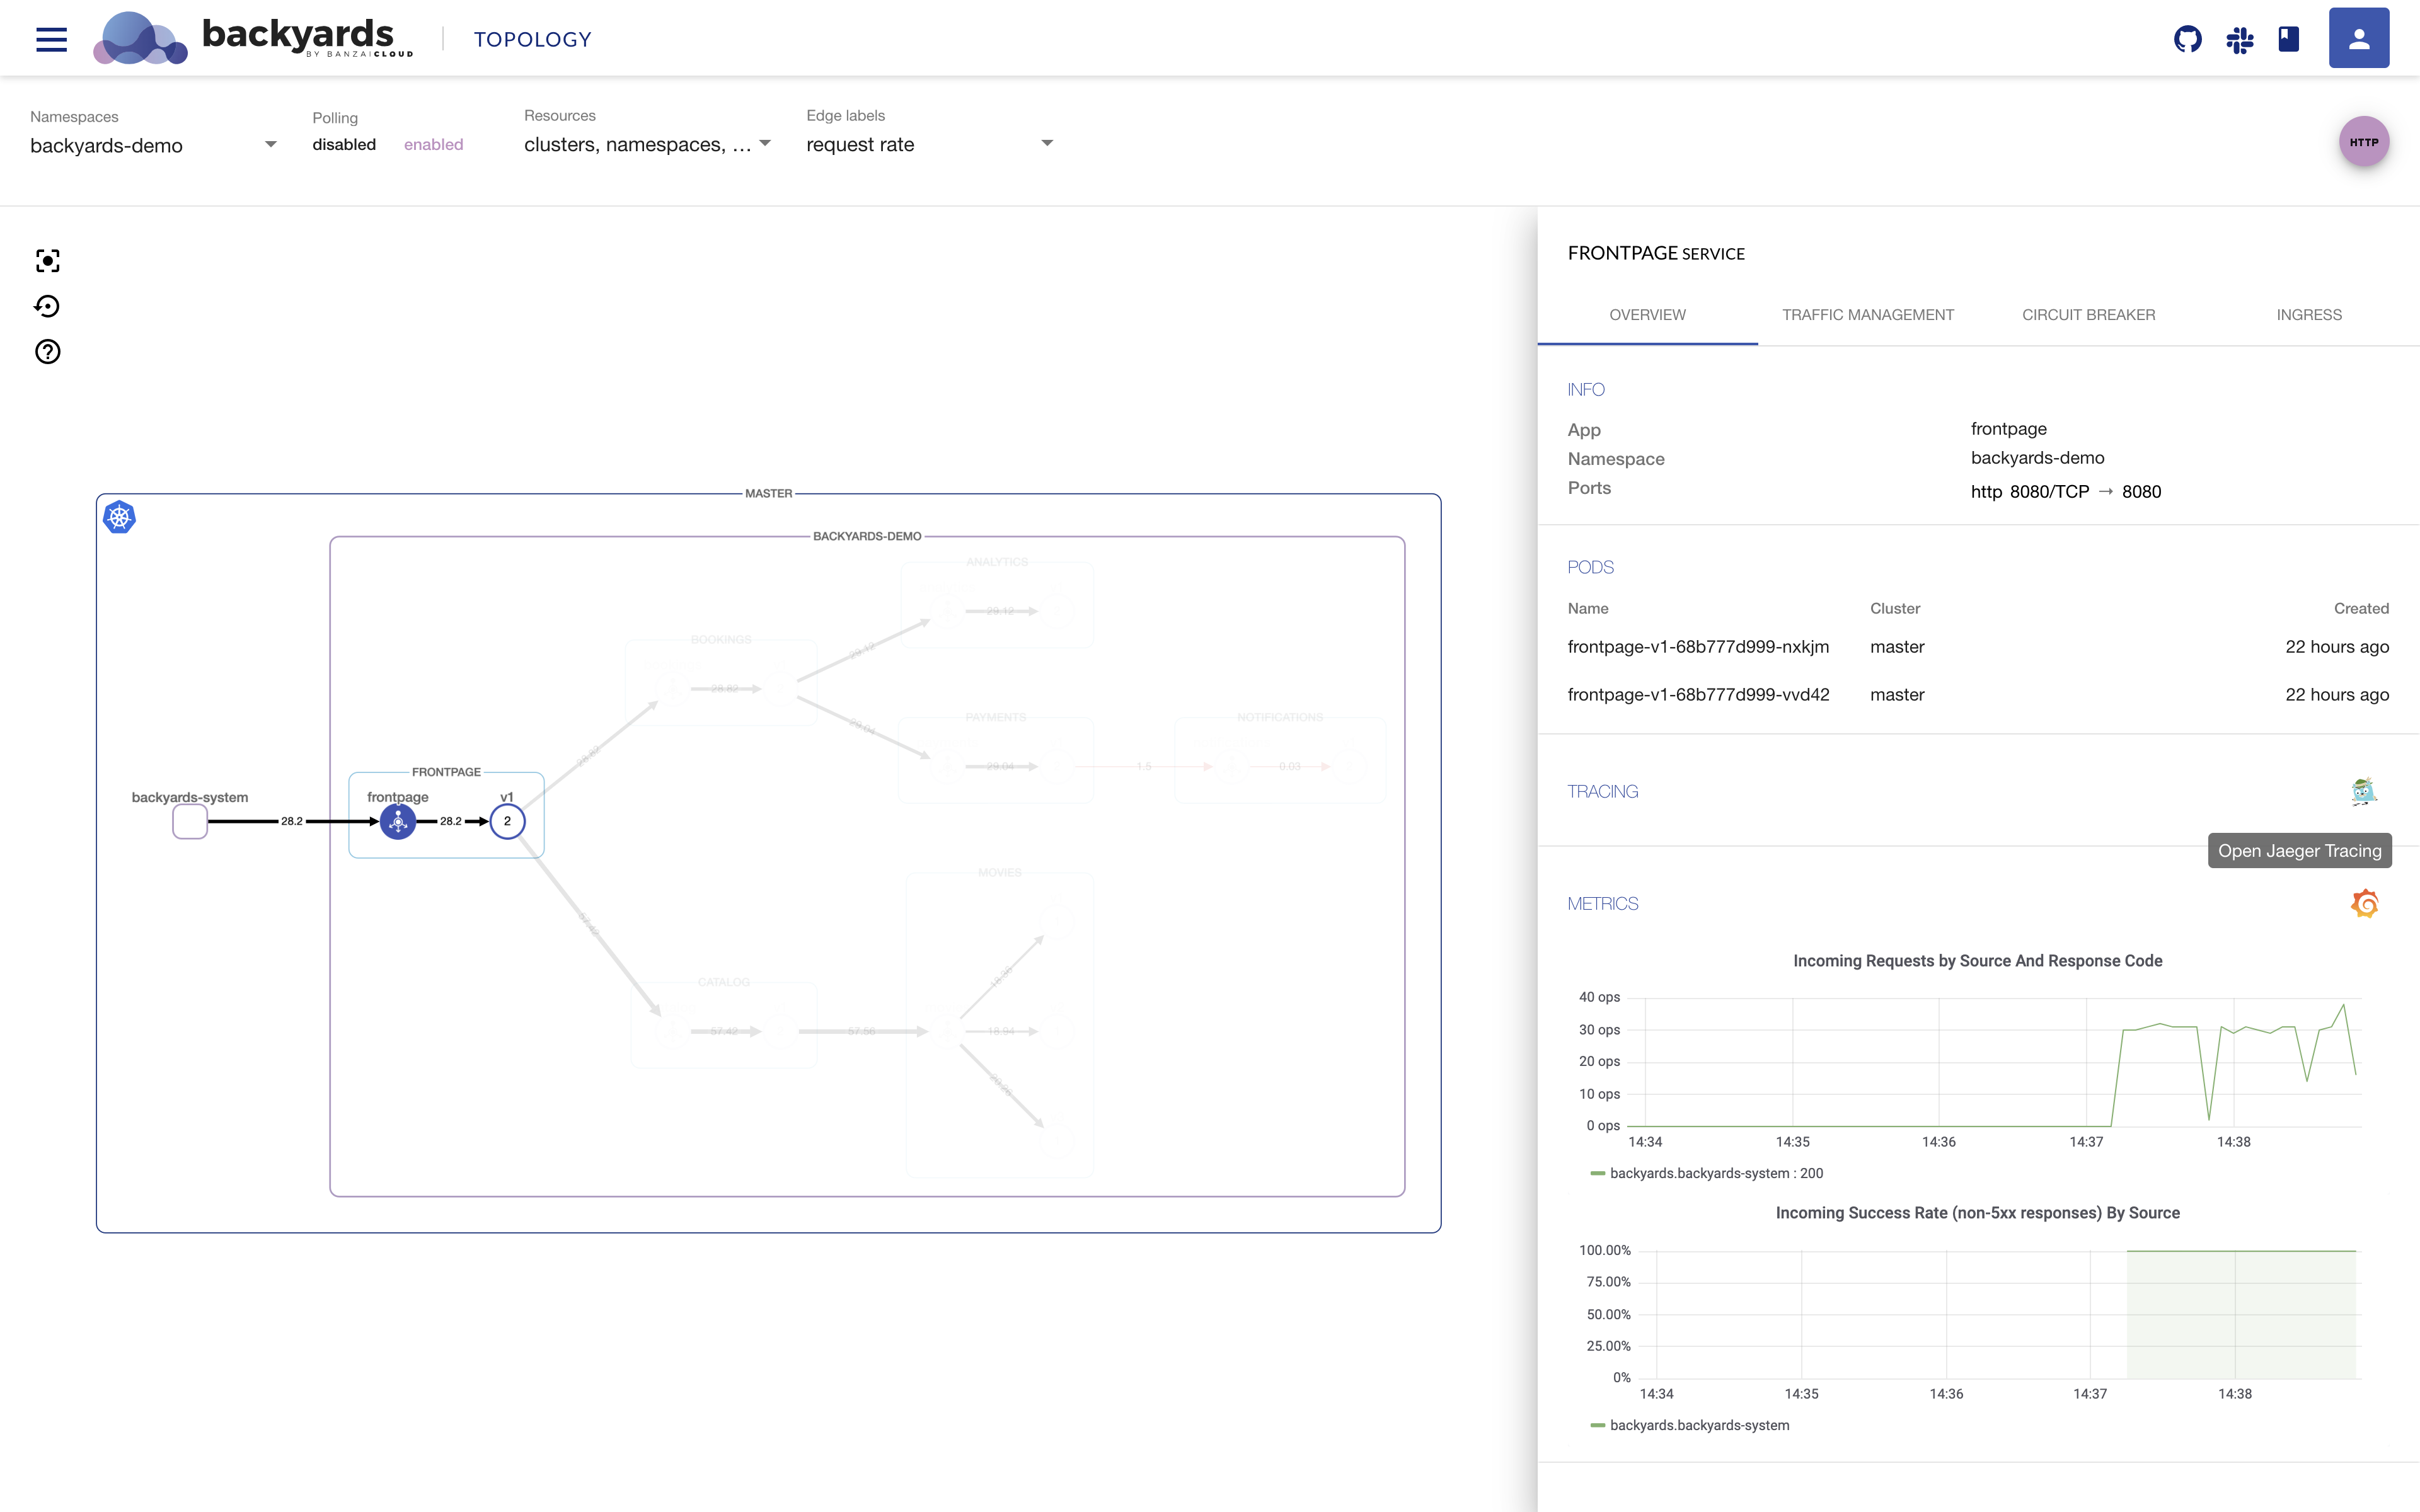
- Jaeger is exposed through an ingress gateway and the links are present on the UI (both on the graph and list view).
Jaeger link from the graph view:

Jaeger UI for the demo application:

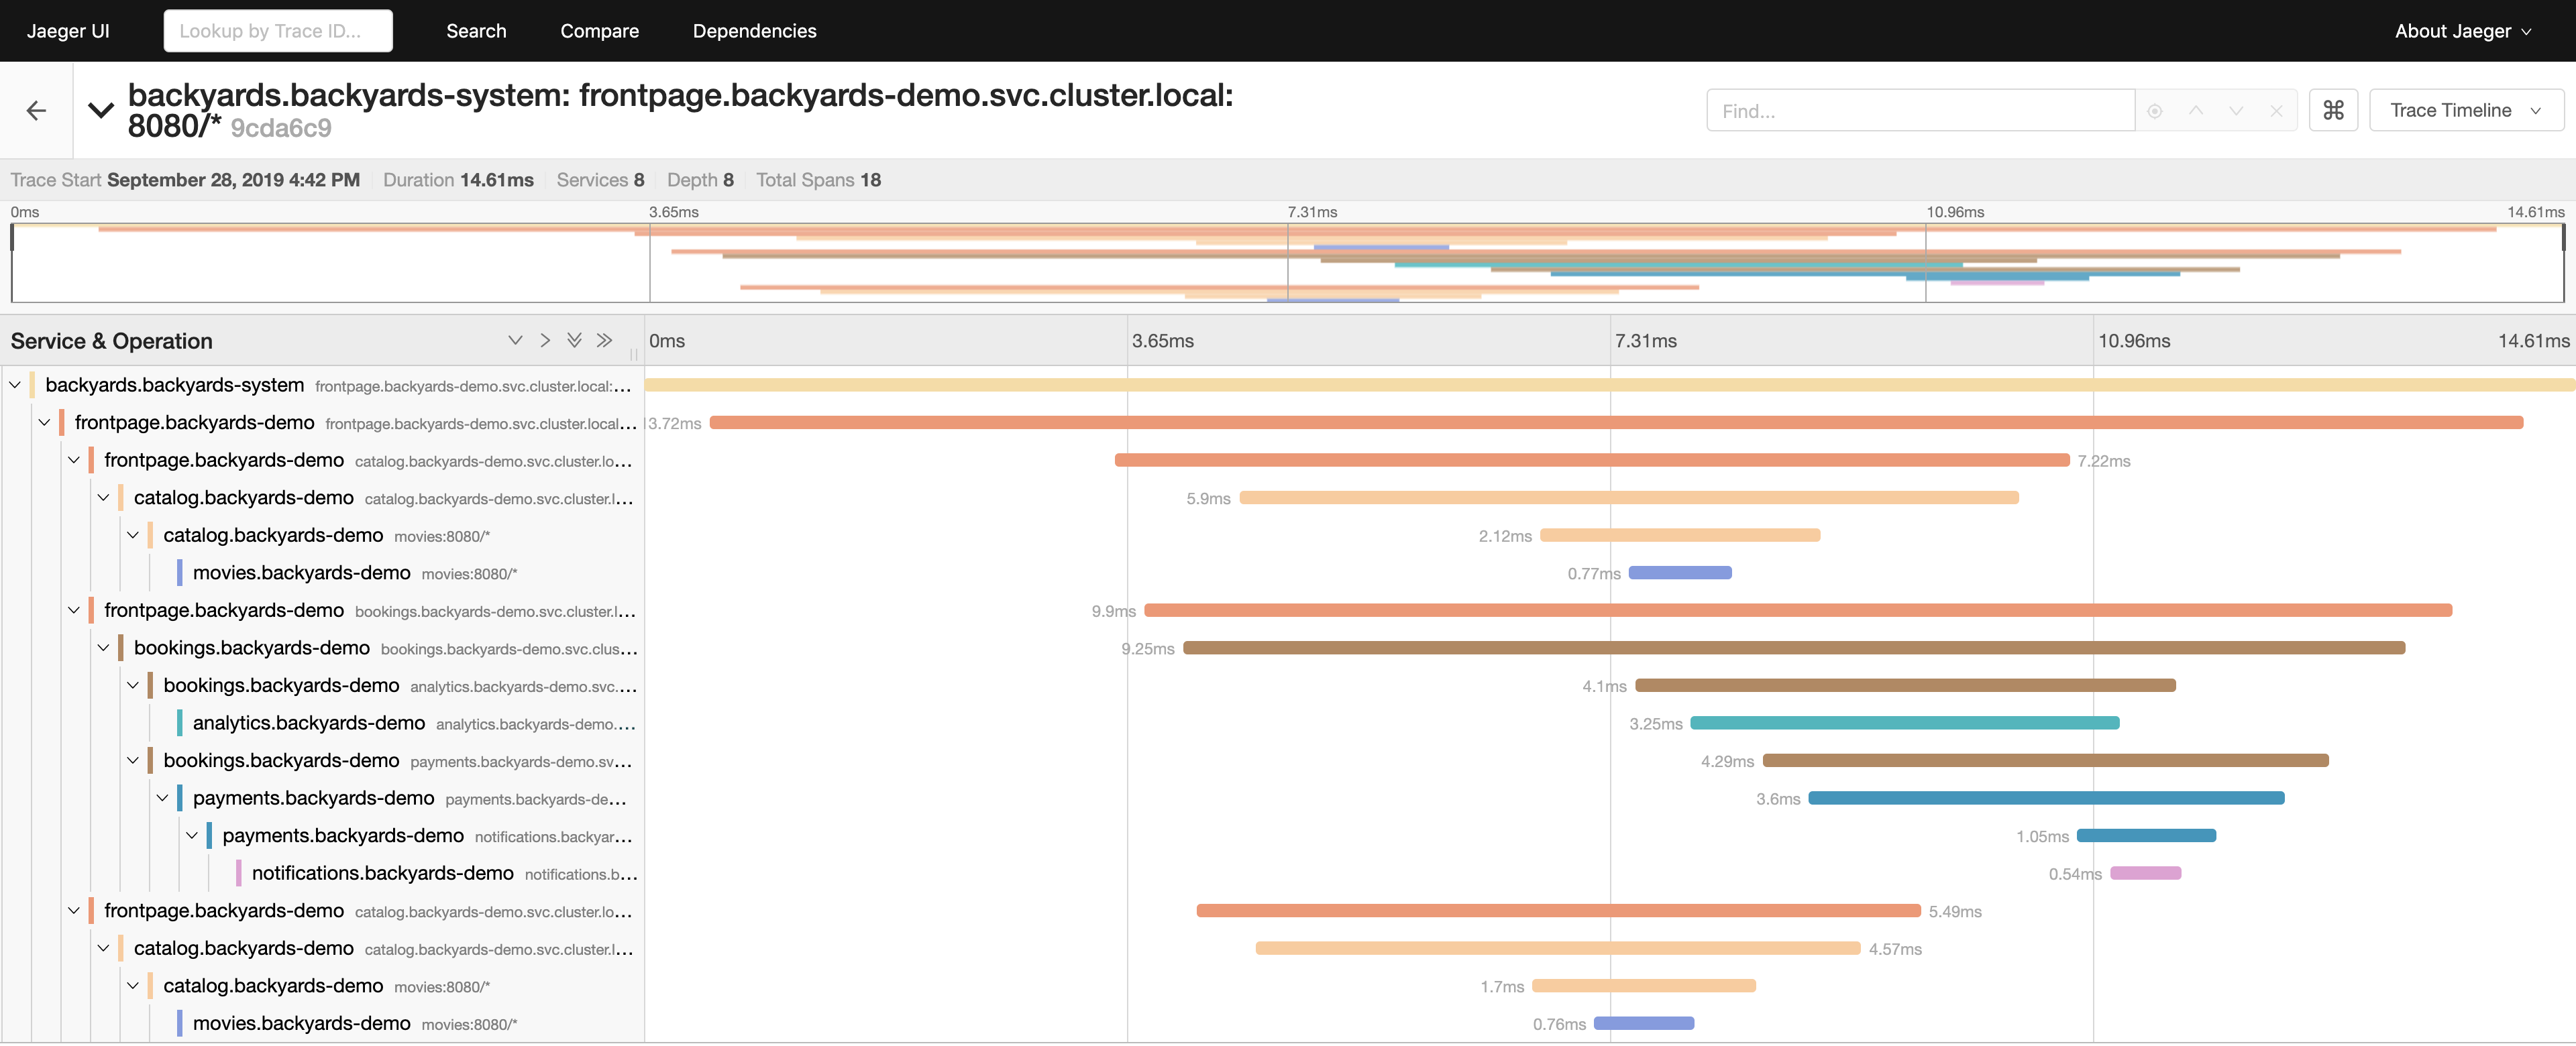
There you can see the whole call stack in the microservices architecture. You can see when exactly the root request was started and how much each request took. You can see e.g. that the analytics service took the most time out of the individual requests which is because it does some actual calculations (computes the value of Pi).


