

This section gives you a very brief overview of Service Level Objectives (SLOs), error budgets, and other related concepts, and shows you how to track them using Backyards.
For a more detailed introduction to these concepts, see the Tracking and enforcing SLOs on Kubernetes webinar blog post, or the Tracking and enforcing SLOs on Kubernetes webinar.
Even though Kubernetes is designed for fault tolerance, errors do happen. You can define a level of service and track your compliance to it using service level indicators (SLIs), service level objectives (SLOs), and error budgets. These are based on telemetry (mostly monitoring) information, so the most important thing before adopting an SLO model is to have meaningful, appropriate metrics and a proper and stable monitoring system in place.
Terminology 🔗︎
Let’s review the related terminology.
Service Level Indicator (SLI) 🔗︎
A Service Level Indicator (SLI) is a carefully defined quantitative measure of some aspect of the level of service that is provided. Basically, that’s what you measure as a level of service, for example:
- the success rate of HTTP requests,
- the percentage of requests below a certain latency threshold,
- the fraction of time when a service is available, or
- any other metrics that somehow describe the state of the service.
It’s usually a good practice to formulate the SLI as the ratio of two numbers: the good events divided by the total events. This way the SLI value is between 0 and 1 (or 0% and 100%), and it’s easily matched to the Service Level Objective (SLO) value that’s usually defined as a target percentage over a given timeframe. The previous examples are all following this practice.
Service Level Objective 🔗︎
The Service Level Objective (SLO) is a target value or range of values for a service level that is measured by an SLI. It defines the minimum level of reliability that the users of your service can expect. For example, if you want to have an 99.9% HTTP success rate, then your SLO is 99.9%.
An important aspect of the SLO is the period where it’s interpreted. An SLO can be defined for a rolling period, or for a calendar window. Usually, an SLO refers to a longer period, like a month, or 4 weeks. It’s always a good practice to continuously improve your SLOs based on the current performance of your system.
Compliance 🔗︎
Compliance measures the current performance of the system and is measured against your SLO. For example, if you have a 99.9% SLO goal for a 4 week period, then compliance is the exact measurement based on the same SLI, for example, 99.98765%.
Error budget 🔗︎
The error budget is a metric that determines how unreliable the service is allowed to be within a period of time.
The remaining error budget is the difference between the SLO and the actual compliance in the current period. If you have an SLO of 99.9% for a certain period, you have an error budget of 0.1% for that same period. If the compliance is 99.92% at the end of the period, it means that the remaining error budget is 20%. For example: if you expect 10 million requests this month, and you have a 99.9% SLO, then you’re allowed 10.000 requests to fail. These 10.000 requests are your error budget. If a single event causes 2.000 requests to fail, it burned through 20% of your error budget.
Burn rate 🔗︎
Burn rate is how fast the service consumes the error budget, relative to the SLO.
A burn rate of 1 for the whole SLO period means that you’ve steadily burned through exactly 100% of our error budget during that period. A burn rate of 2 means that you’re burning through the budget twice as fast as allowed, so you’ll exhaust your budget at halftime of the SLO period (or you’ll have twice as many failures as allowed by the SLO by the end of the period). The burn rate can be interpreted even for a shorter period than your SLO period, and it is the basis of a good alerting system.
Track SLOs with Backyards 🔗︎
Backyards displays the Service Level Objectives (SLOs) configured to a service both in the drill down view and on the Services page.
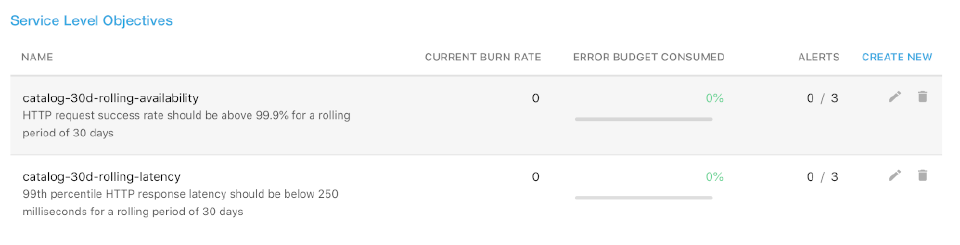
As an overview, Backyards displays the following information for every SLO configured for the service:
- NAME: The name and the description on the SLO.
- CURRENT BURN RATE: The current burn rate of the SLO.
- ERROR BUDGET CONSUMED: The percentage of the error budget already consumed for the period.
- ALERTS: The currently firing and the total number of alerts configured for the SLO.
Click on the name of an SLO to display its details. You can also modify an existing SLO, or create a new SLO.
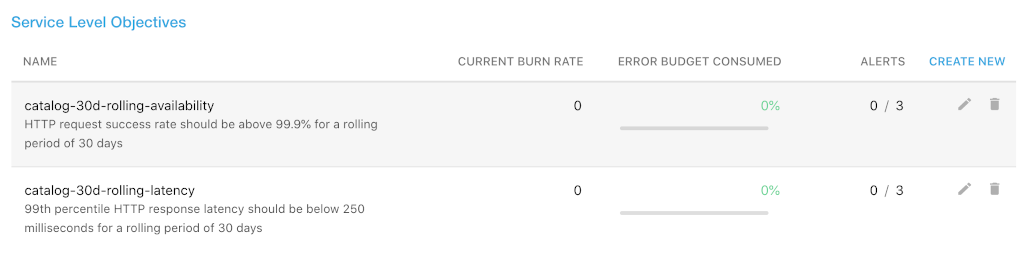
Details of an SLO 🔗︎
Clicking on the name of a Service Level Objective displays its details.

-
Time Window: The time period used for the SLO, for example, 30 days.
-
Type: The type of the SLO: rolling or calendar-based.
-
Target: The target success rate of the SLO.
-
DESCRIPTION: The description of the Service Level Objective.
-
NAMESPACE: The namespace of the service.
-
SERVICE: The name of the service the SLO applies to.
-
LABELS:
-
SLI: Shows an overview of the Service Level Indicator (SLI). Click the
 icon next to the name of the SLI to display its YAML configuration.
 -
Alerting Policies: The list of alerting policies defined for the service in Prometheus Alertmanager. To display the alerts in Prometheus, click the
 icon next to the Alerting Policies label. For each Alerting Policy, the following information is displayed.
-
NAME: The name of the Alerting Policy.
-
LOOKBACK WINDOWS: The primary and the control time-frame for which the burn rate threshold is calculated.
-
ALERT AFTER: The period for which the burn rate must be above the threshold to trigger the alert.
-
THRESHOLD: The BURN RATE THRESHOLD above which the alert is triggered.
-
SEVERITY: The severity of the alert.
-
STATE: The current state of the alert:
- inactive: the service works within the specified thresholds
- pending: the service works outside of the specified thresholds, waiting for the alert after period setting has not yet passed
- firing: the service is outside of the specified thresholds, an alert is triggered
You can modify an existing policy, or create a new Alerting Policy. Click the
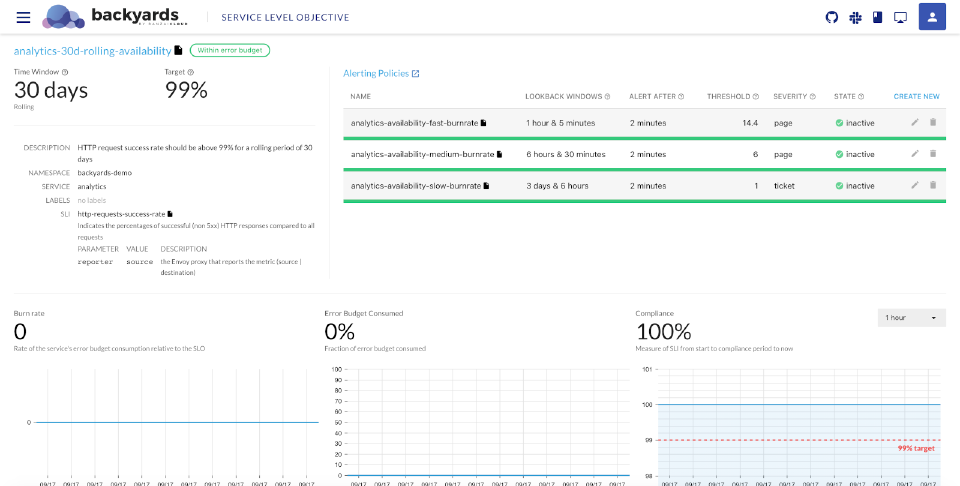
icon next to the name of the alerting policy to display its YAML configuration.To get an overview of the burn rates of the configured alerting policies, select ALERTING STRATEGY. The diagram shows when the first alert will fire, depending on the magnitude of the outage. ```
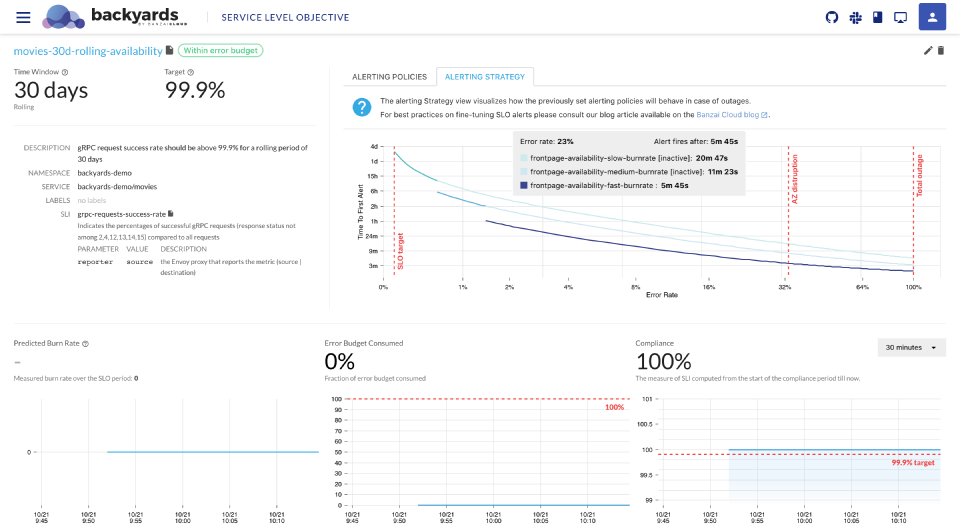
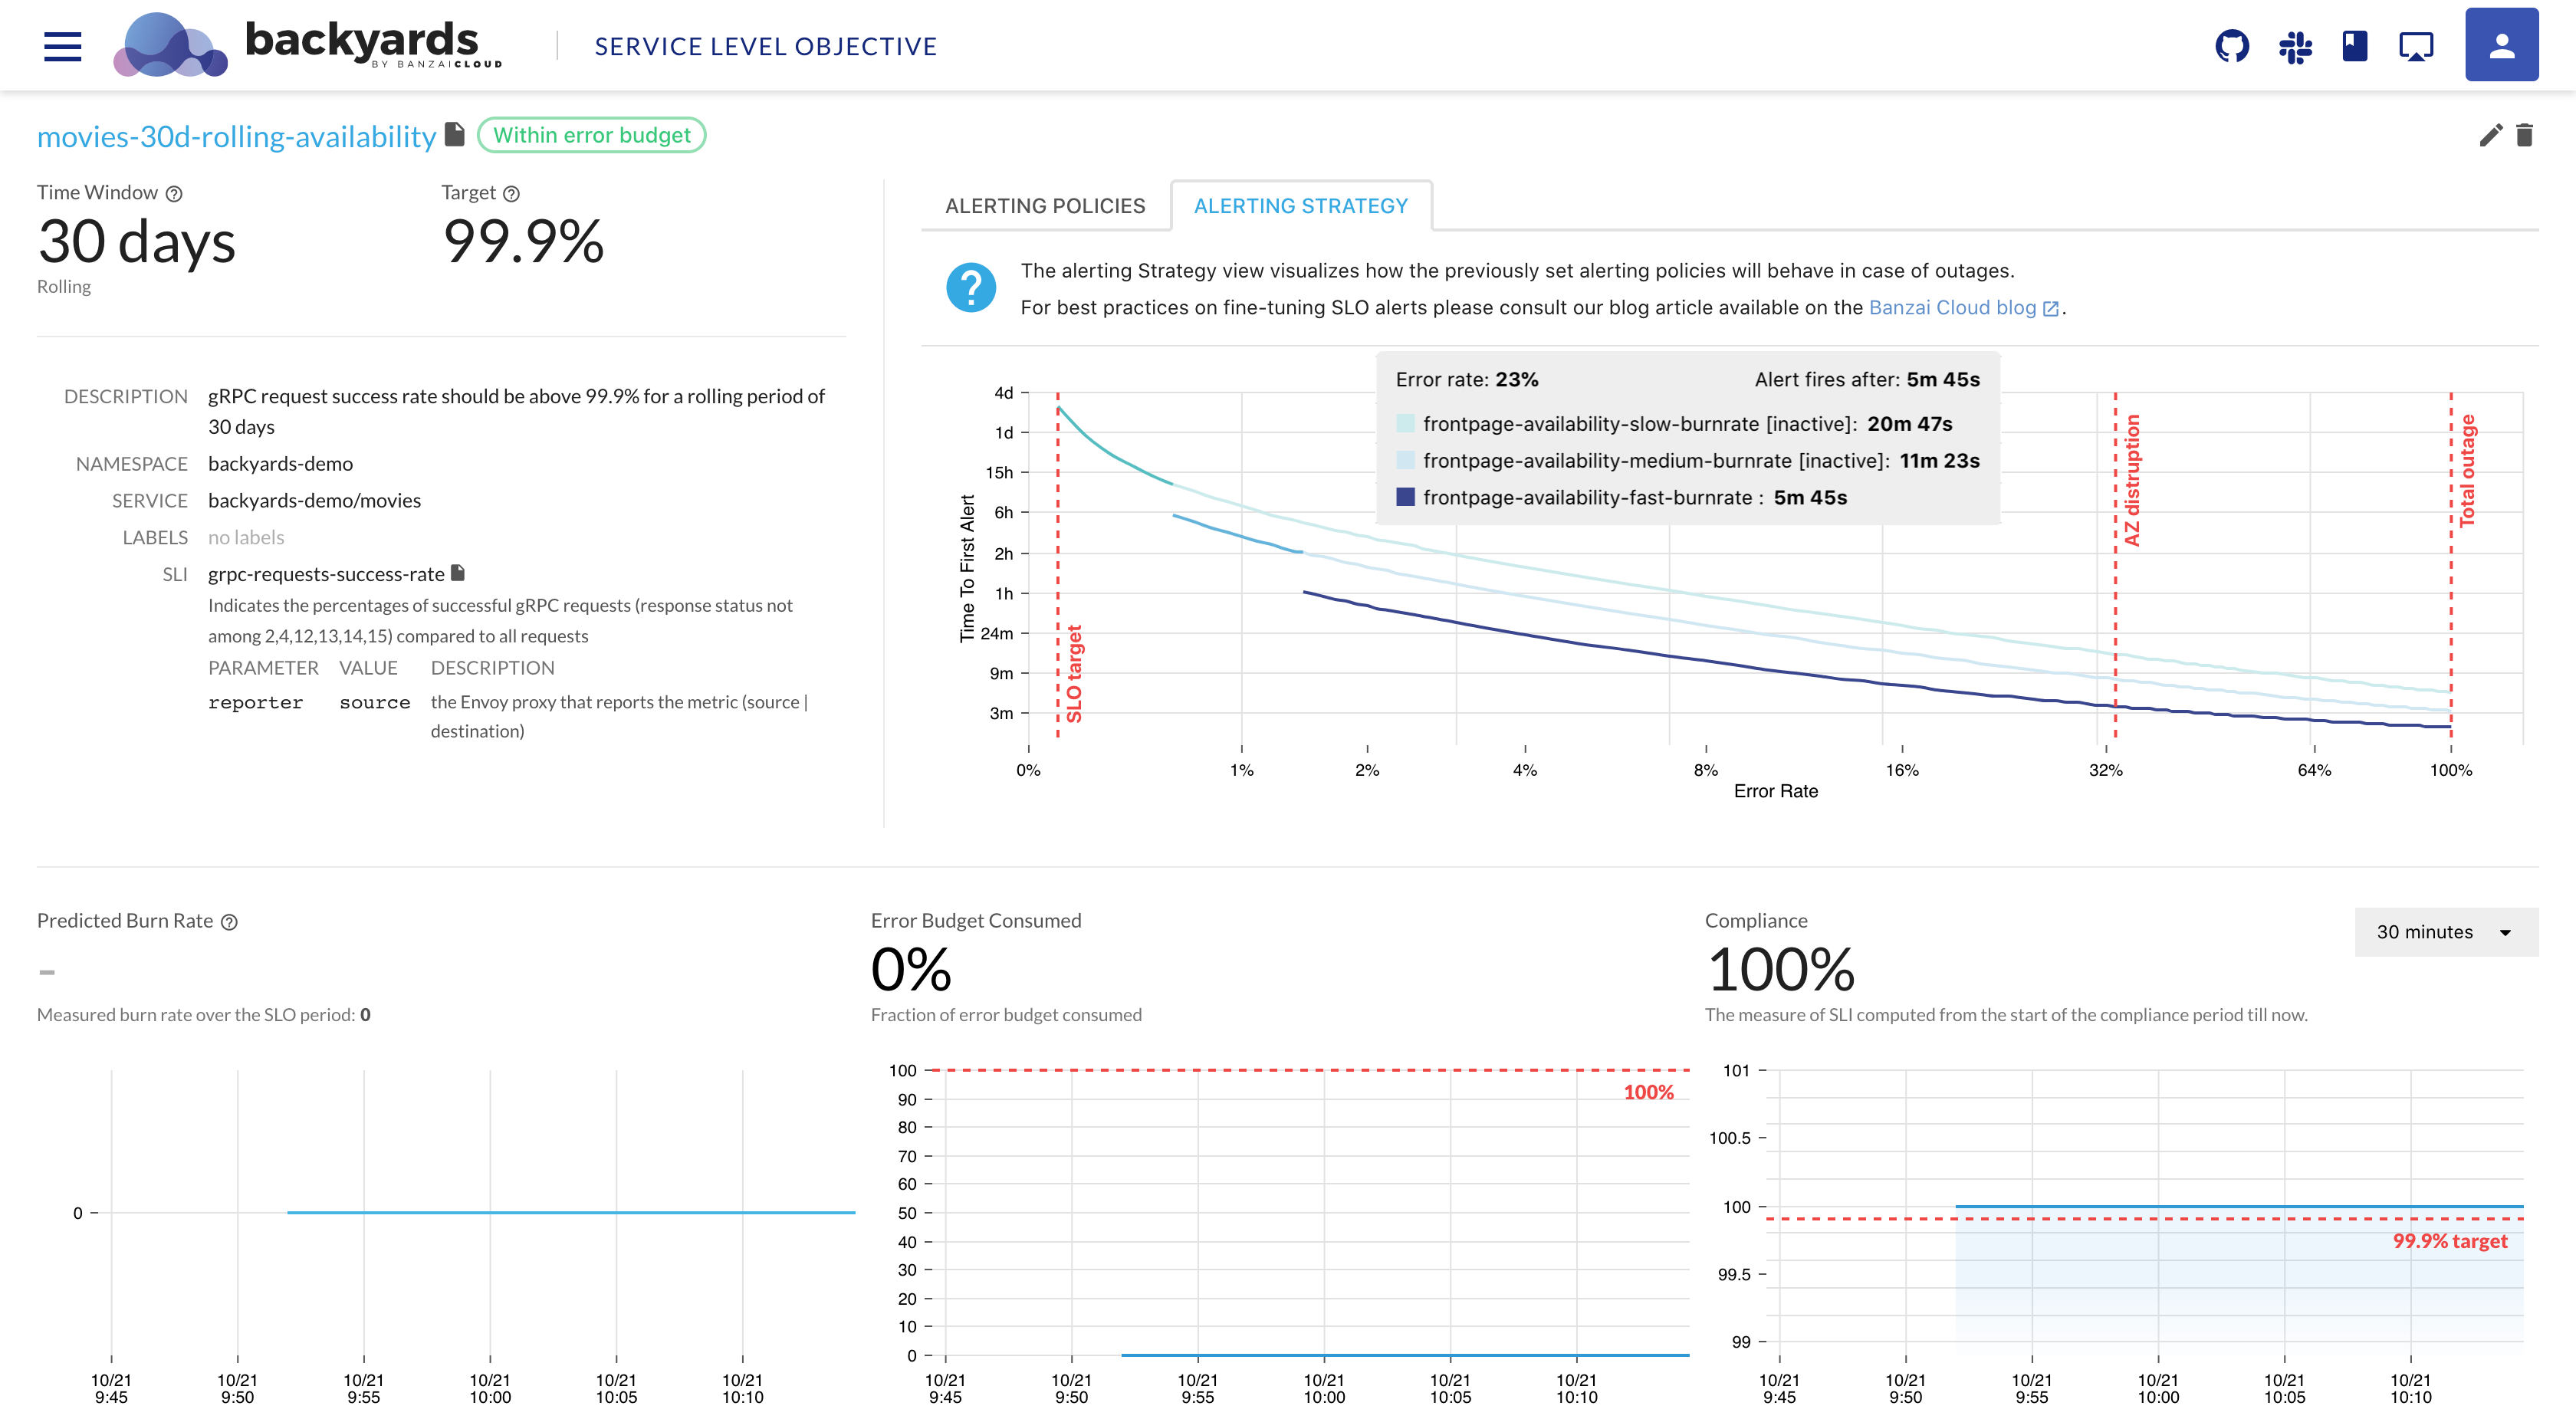
As burn rates are helpful tools for differentiating the alerting strategy based on the severity of a given outage, for best practices on setting up burn-rate based alerts please see our Burn Rate Based Alerting Demystified
-
-
Metrics: Displays the Burn rate, the Error Budget Consumed, and the Compliance for the selected time period.
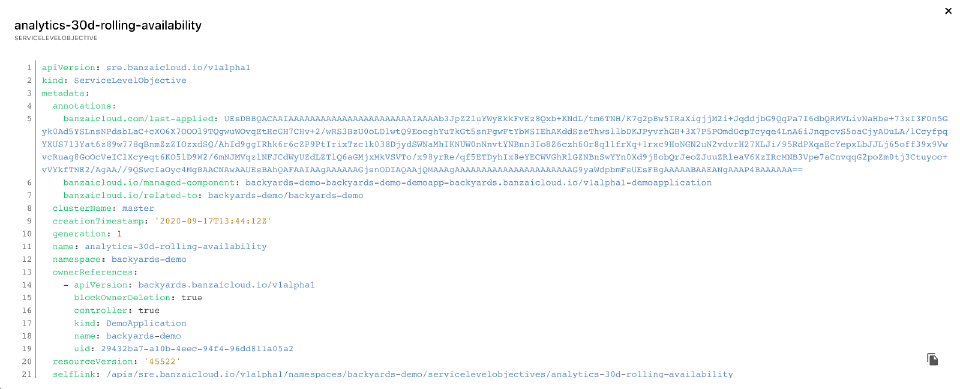
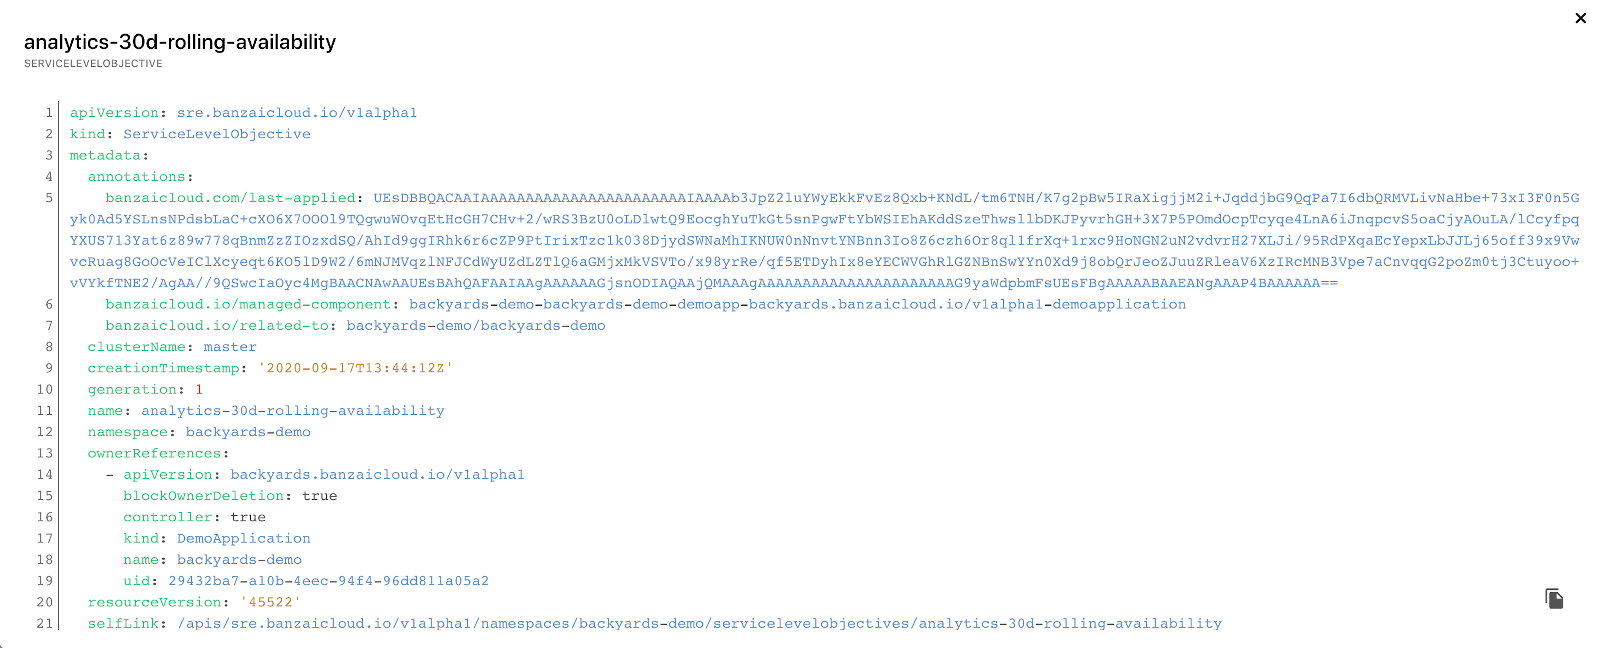
Click the ![]() icon next to the name of the SLO to display its YAML configuration.
icon next to the name of the SLO to display its YAML configuration.
Further information 🔗︎
- Create new Service Level Objectives (SLOs)
- For further information, you can also watch the recording of our webinar on Tracking and enforcing SLOs on Kubernetes.


